This pipeline computes the correlation between cancer subtypes identified by different molecular patterns and selected clinical features.
Testing the association between subtypes identified by 6 different clustering approaches and 11 clinical features across 181 patients, 6 significant findings detected with P value < 0.05 and Q value < 0.25.
-
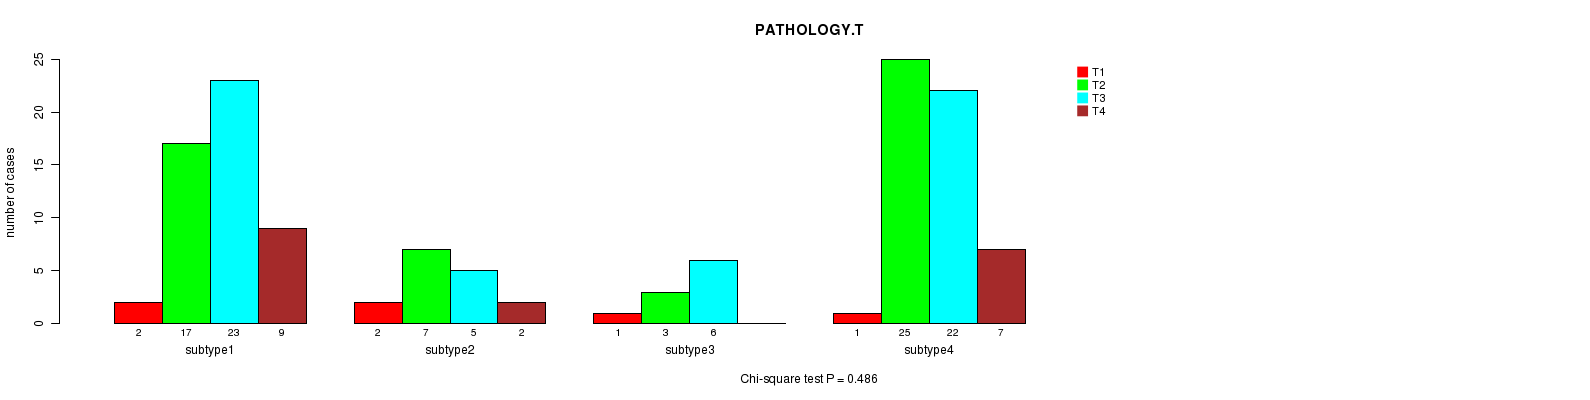
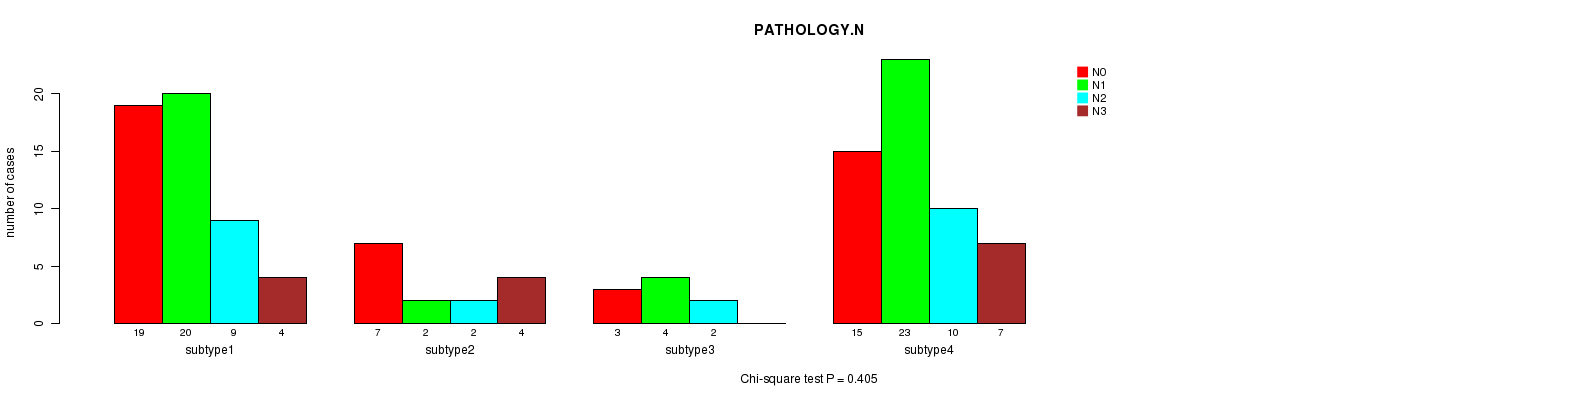
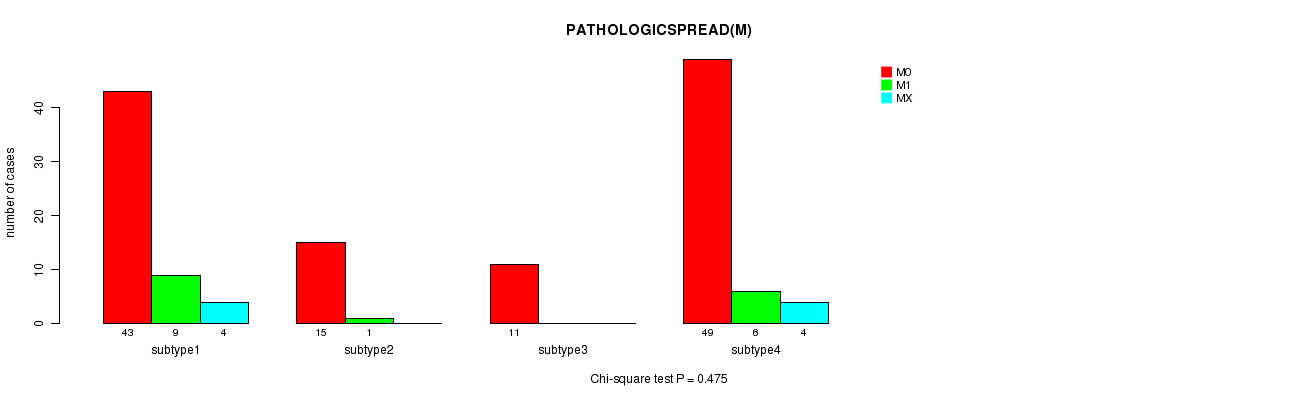
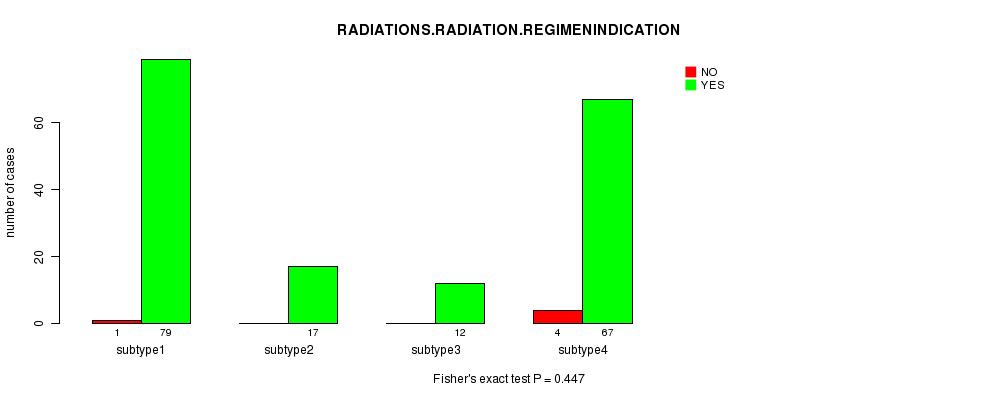
4 subtypes identified in current cancer cohort by 'Copy Number Ratio CNMF subtypes'. These subtypes do not correlate to any clinical features.
-
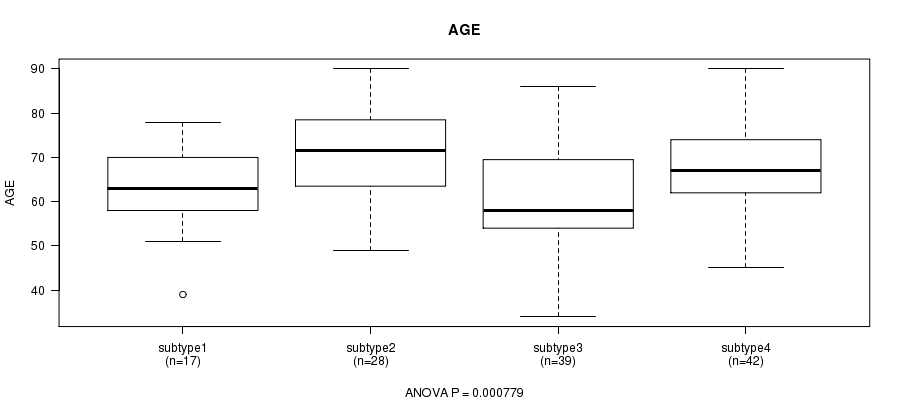
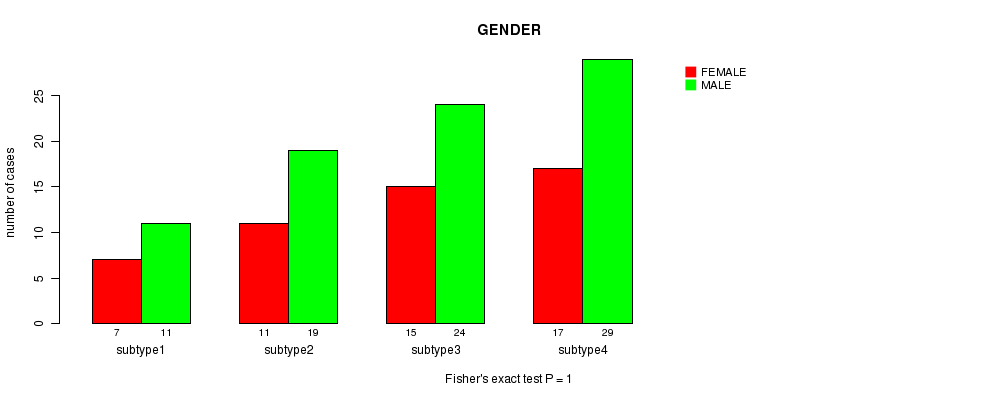
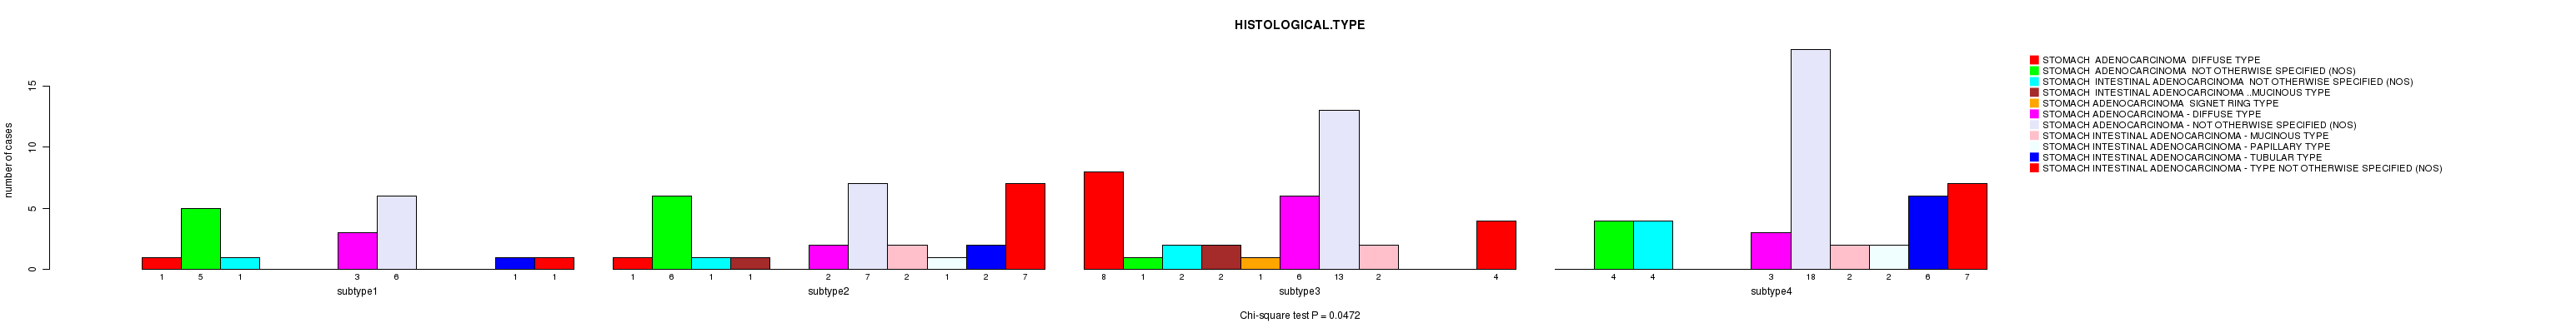
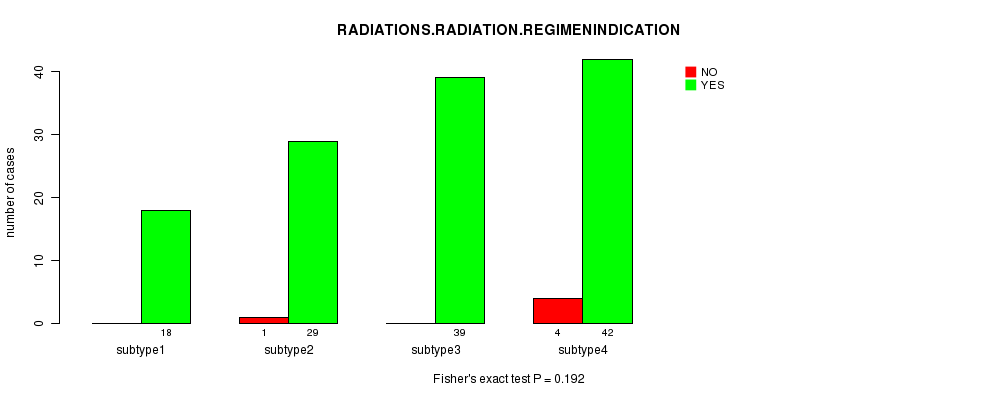
4 subtypes identified in current cancer cohort by 'METHLYATION CNMF'. These subtypes correlate to 'AGE'.
-
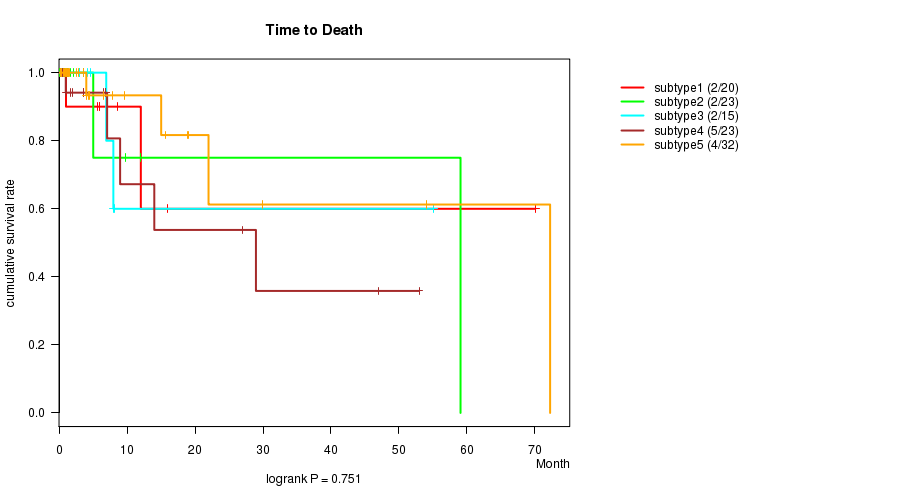
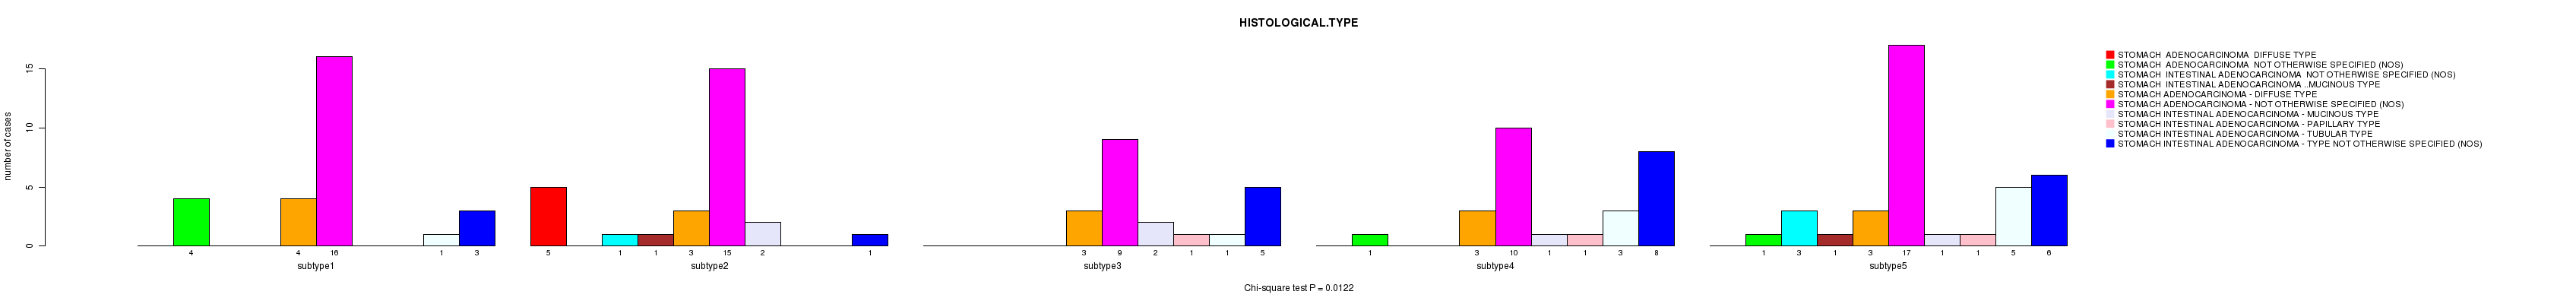
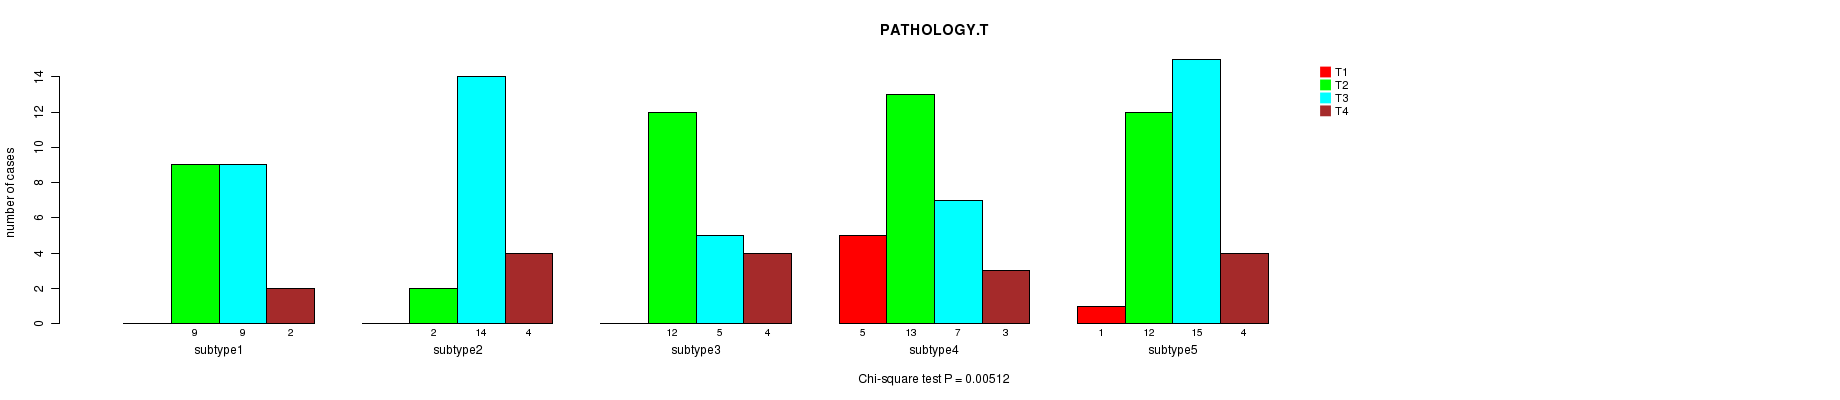
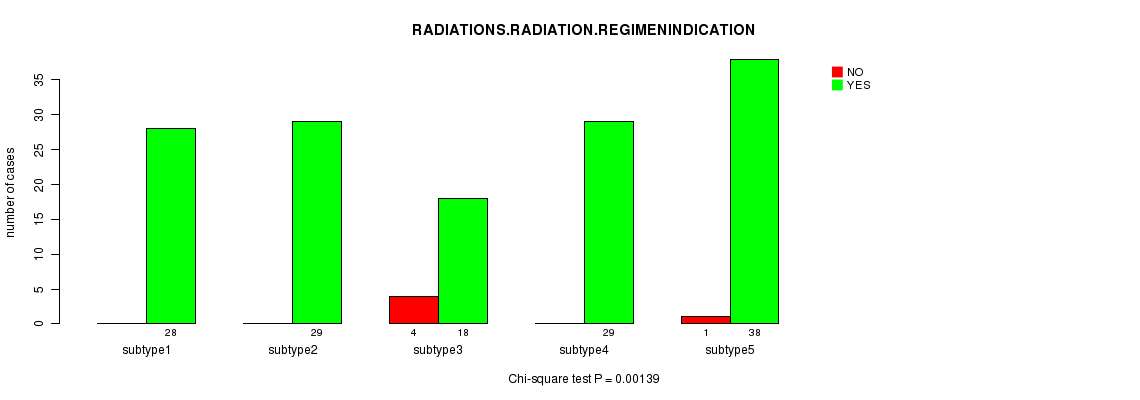
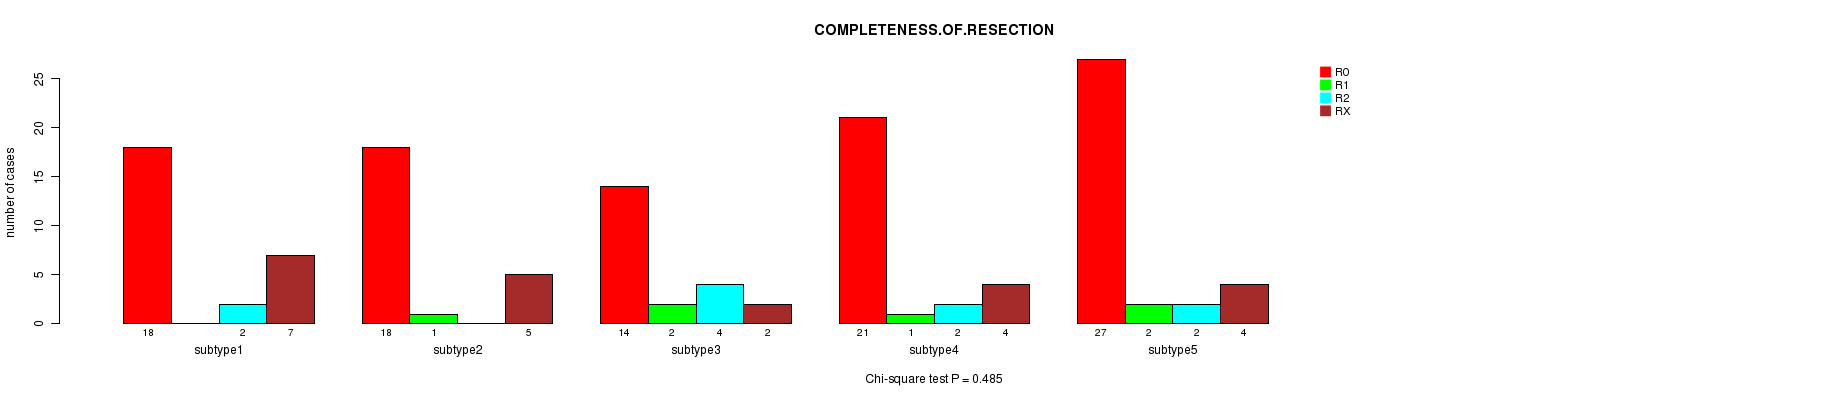
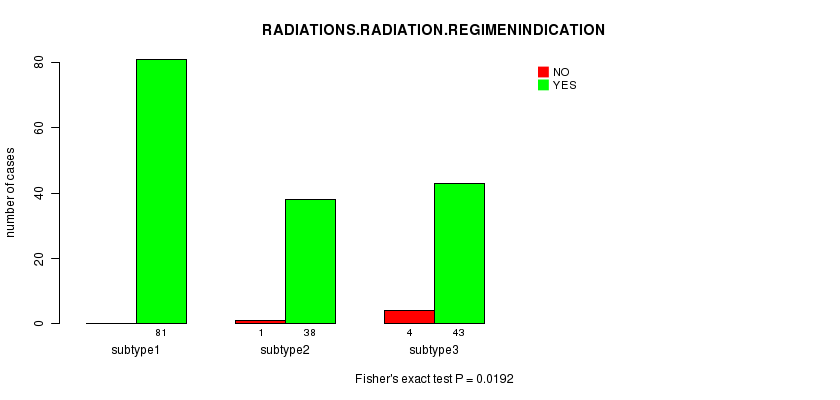
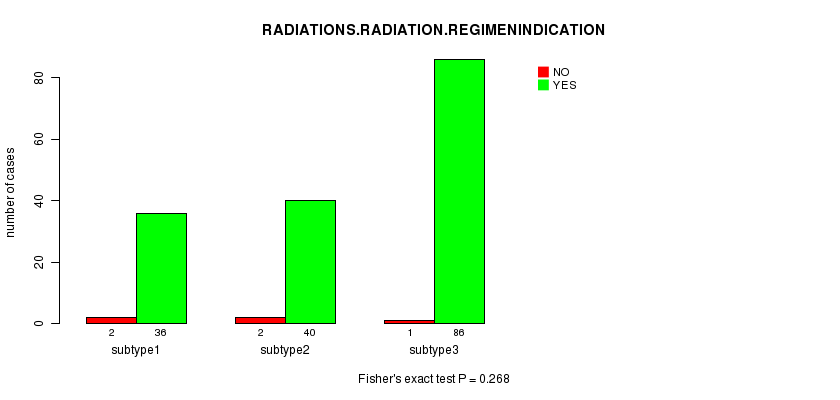
CNMF clustering analysis on sequencing-based mRNA expression data identified 5 subtypes that correlate to 'RADIATIONS.RADIATION.REGIMENINDICATION'.
-
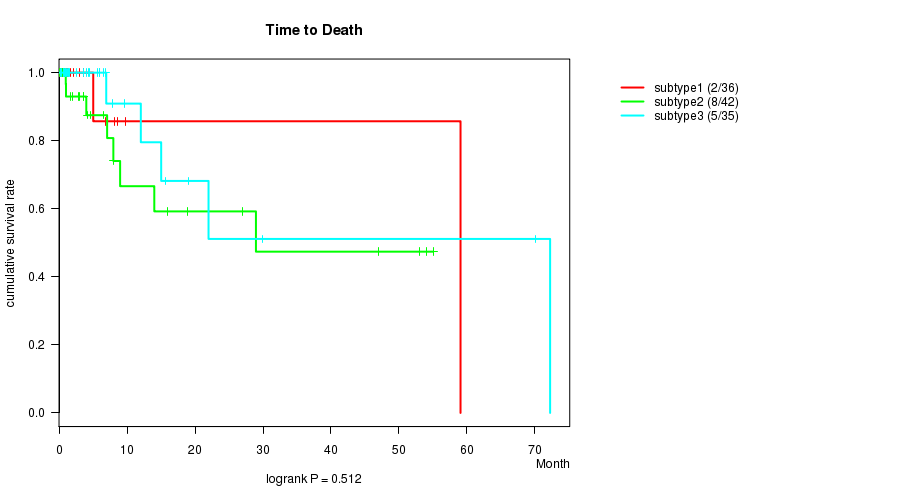
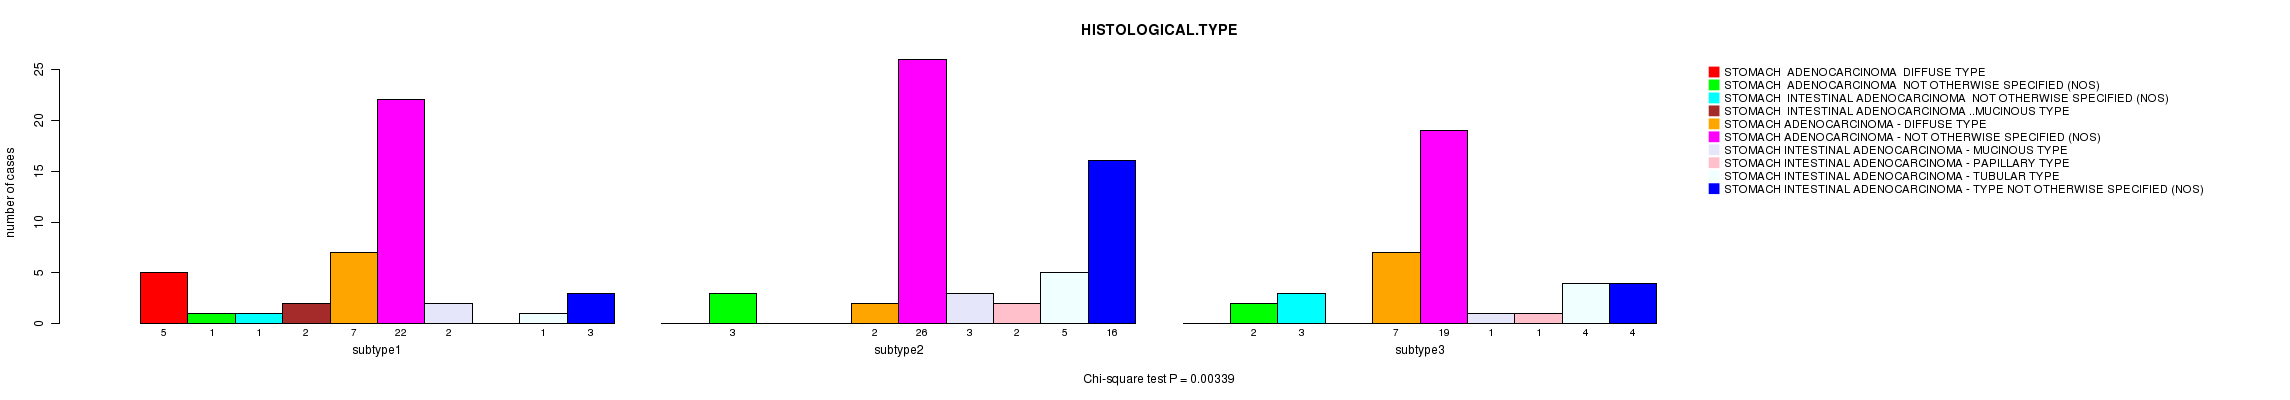
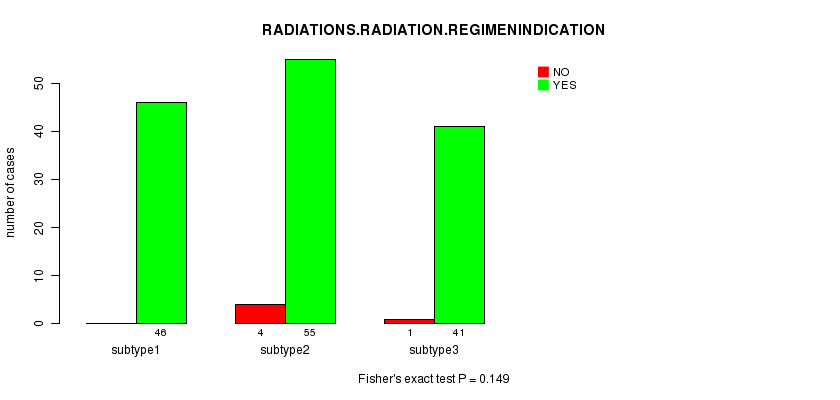
Consensus hierarchical clustering analysis on sequencing-based mRNA expression data identified 3 subtypes that correlate to 'AGE' and 'HISTOLOGICAL.TYPE'.
-
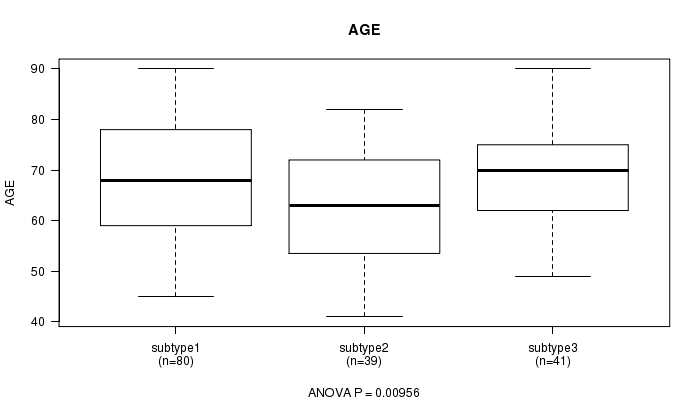
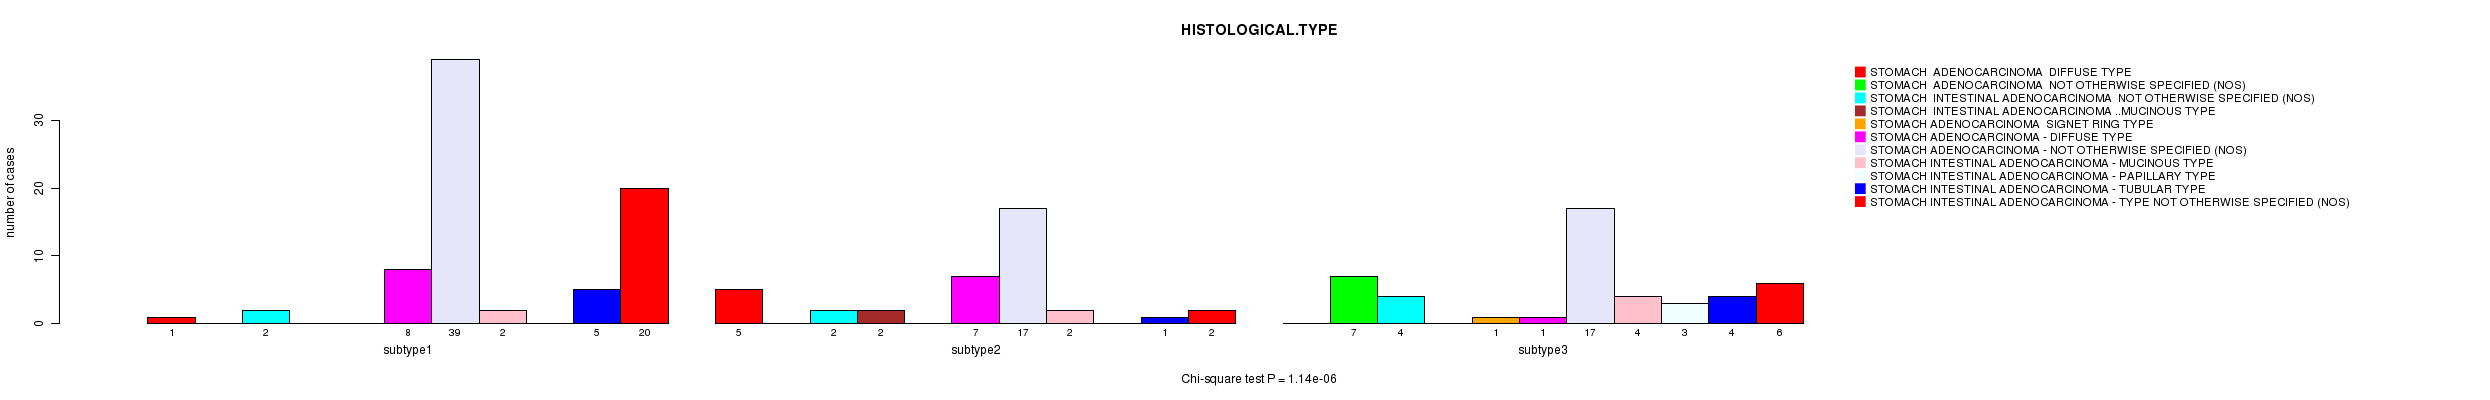
3 subtypes identified in current cancer cohort by 'MIRSEQ CNMF'. These subtypes correlate to 'HISTOLOGICAL.TYPE'.
-
3 subtypes identified in current cancer cohort by 'MIRSEQ CHIERARCHICAL'. These subtypes correlate to 'HISTOLOGICAL.TYPE'.
Table 1. Get Full Table Overview of the association between subtypes identified by 6 different clustering approaches and 11 clinical features. Shown in the table are P values (Q values). Thresholded by P value < 0.05 and Q value < 0.25, 6 significant findings detected.
|
Clinical Features |
Statistical Tests |
Copy Number Ratio CNMF subtypes |
METHLYATION CNMF |
RNAseq CNMF subtypes |
RNAseq cHierClus subtypes |
MIRSEQ CNMF |
MIRSEQ CHIERARCHICAL |
| Time to Death | logrank test |
0.331 (1.00) |
0.798 (1.00) |
0.751 (1.00) |
0.512 (1.00) |
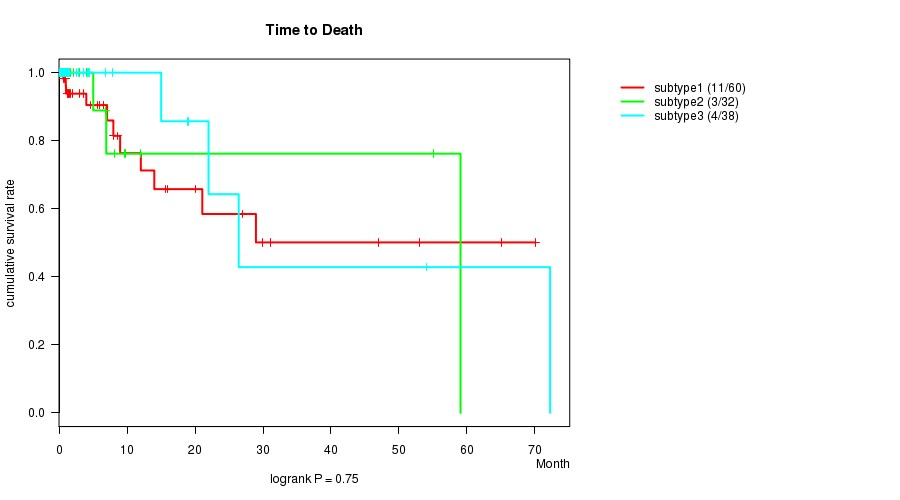
0.75 (1.00) |
0.651 (1.00) |
| AGE | ANOVA |
0.108 (1.00) |
0.000779 (0.0506) |
0.368 (1.00) |
0.00246 (0.152) |
0.00956 (0.554) |
0.367 (1.00) |
| GENDER | Fisher's exact test |
0.00486 (0.292) |
1 (1.00) |
0.691 (1.00) |
0.728 (1.00) |
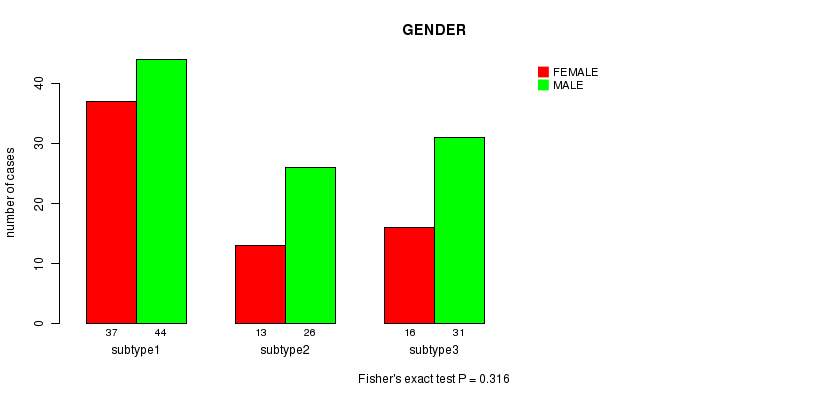
0.316 (1.00) |
0.955 (1.00) |
| HISTOLOGICAL TYPE | Chi-square test |
0.148 (1.00) |
0.0472 (1.00) |
0.0122 (0.684) |
0.00339 (0.207) |
1.14e-06 (7.56e-05) |
0.00112 (0.0714) |
| PATHOLOGY T | Chi-square test |
0.486 (1.00) |
0.0147 (0.808) |
0.00512 (0.302) |
0.0157 (0.842) |
0.856 (1.00) |
0.0557 (1.00) |
| PATHOLOGY N | Chi-square test |
0.405 (1.00) |
0.772 (1.00) |
0.633 (1.00) |
0.884 (1.00) |
0.559 (1.00) |
0.903 (1.00) |
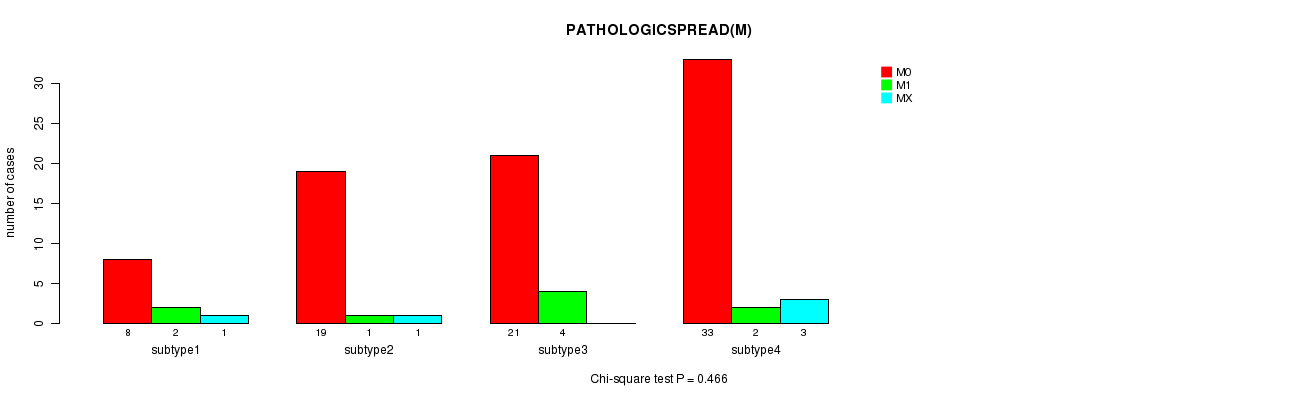
| PATHOLOGICSPREAD(M) | Chi-square test |
0.475 (1.00) |
0.466 (1.00) |
0.747 (1.00) |
0.826 (1.00) |
0.0929 (1.00) |
0.726 (1.00) |
| TUMOR STAGE | Chi-square test |
0.445 (1.00) |
0.0201 (1.00) |
0.322 (1.00) |
0.0939 (1.00) |
0.443 (1.00) |
0.304 (1.00) |
| RADIATIONS RADIATION REGIMENINDICATION | Fisher's exact test |
0.447 (1.00) |
0.192 (1.00) |
0.00139 (0.0874) |
0.149 (1.00) |
0.0192 (1) |
0.268 (1.00) |
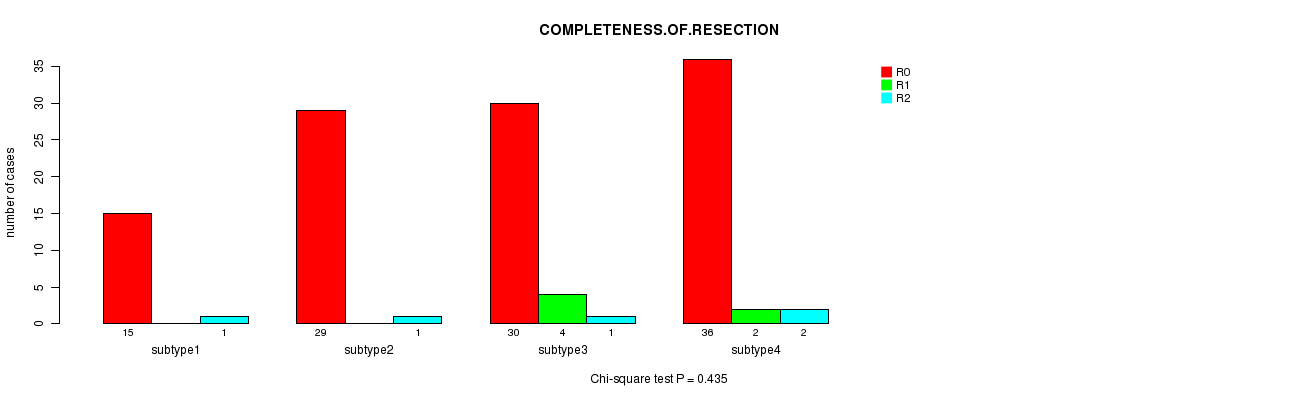
| COMPLETENESS OF RESECTION | Chi-square test |
0.404 (1.00) |
0.435 (1.00) |
0.485 (1.00) |
0.815 (1.00) |
0.0108 (0.617) |
0.386 (1.00) |
| NUMBER OF LYMPH NODES | ANOVA |
0.398 (1.00) |
0.716 (1.00) |
0.068 (1.00) |
0.103 (1.00) |
0.0156 (0.842) |
0.908 (1.00) |
Table S1. Get Full Table Description of clustering approach #1: 'Copy Number Ratio CNMF subtypes'
| Cluster Labels | 1 | 2 | 3 | 4 |
|---|---|---|---|---|
| Number of samples | 80 | 17 | 12 | 71 |
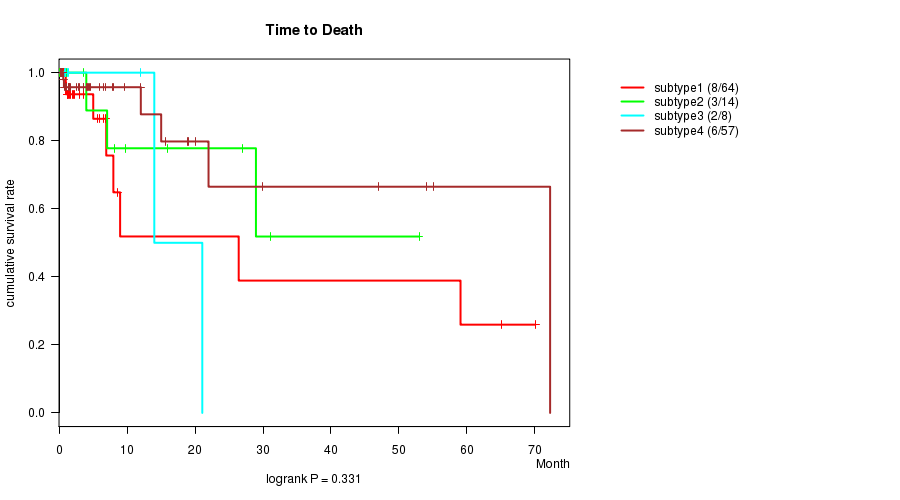
P value = 0.331 (logrank test), Q value = 1
Table S2. Clustering Approach #1: 'Copy Number Ratio CNMF subtypes' versus Clinical Feature #1: 'Time to Death'
| nPatients | nDeath | Duration Range (Median), Month | |
|---|---|---|---|
| ALL | 143 | 19 | 0.1 - 72.2 (1.2) |
| subtype1 | 64 | 8 | 0.1 - 70.1 (1.0) |
| subtype2 | 14 | 3 | 0.1 - 53.0 (7.6) |
| subtype3 | 8 | 2 | 0.8 - 21.1 (1.3) |
| subtype4 | 57 | 6 | 0.2 - 72.2 (3.0) |
Figure S1. Get High-res Image Clustering Approach #1: 'Copy Number Ratio CNMF subtypes' versus Clinical Feature #1: 'Time to Death'
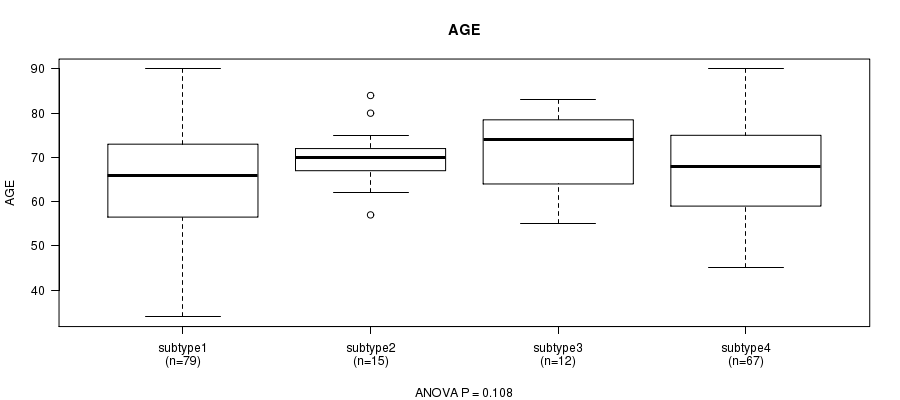
P value = 0.108 (ANOVA), Q value = 1
Table S3. Clustering Approach #1: 'Copy Number Ratio CNMF subtypes' versus Clinical Feature #2: 'AGE'
| nPatients | Mean (Std.Dev) | |
|---|---|---|
| ALL | 173 | 66.8 (11.1) |
| subtype1 | 79 | 64.9 (12.5) |
| subtype2 | 15 | 70.0 (6.6) |
| subtype3 | 12 | 71.7 (9.6) |
| subtype4 | 67 | 67.5 (10.2) |
Figure S2. Get High-res Image Clustering Approach #1: 'Copy Number Ratio CNMF subtypes' versus Clinical Feature #2: 'AGE'
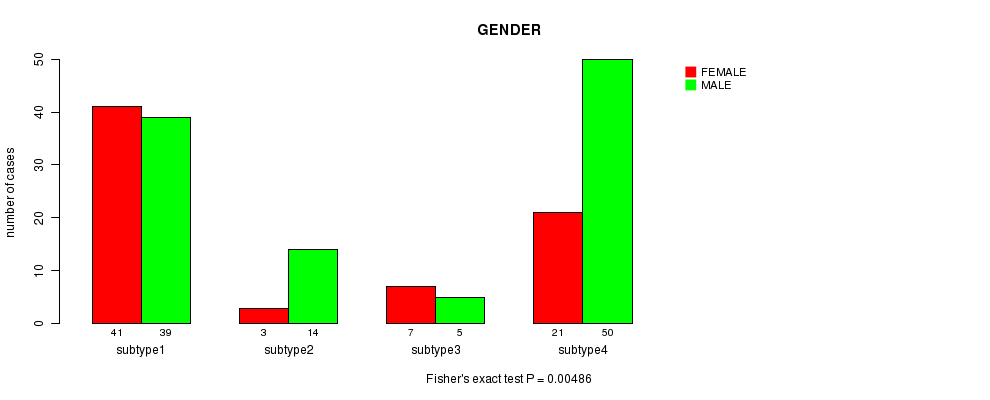
P value = 0.00486 (Fisher's exact test), Q value = 0.29
Table S4. Clustering Approach #1: 'Copy Number Ratio CNMF subtypes' versus Clinical Feature #3: 'GENDER'
| nPatients | FEMALE | MALE |
|---|---|---|
| ALL | 72 | 108 |
| subtype1 | 41 | 39 |
| subtype2 | 3 | 14 |
| subtype3 | 7 | 5 |
| subtype4 | 21 | 50 |
Figure S3. Get High-res Image Clustering Approach #1: 'Copy Number Ratio CNMF subtypes' versus Clinical Feature #3: 'GENDER'
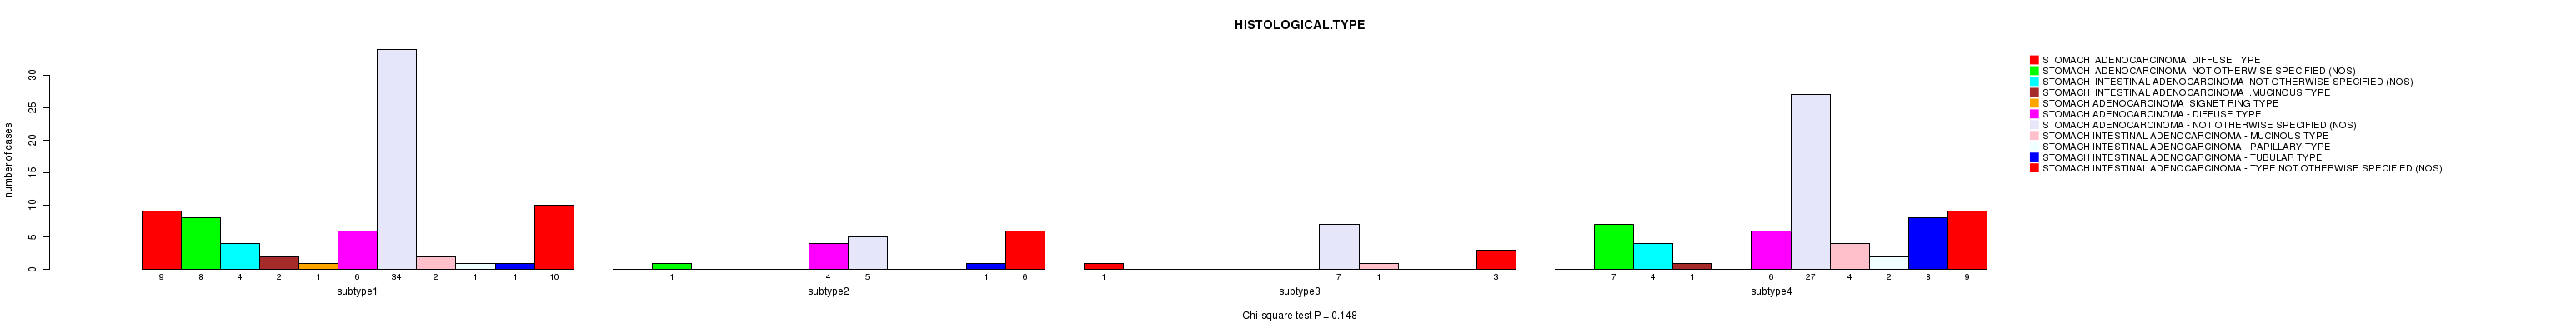
P value = 0.148 (Chi-square test), Q value = 1
Table S5. Clustering Approach #1: 'Copy Number Ratio CNMF subtypes' versus Clinical Feature #4: 'HISTOLOGICAL.TYPE'
| nPatients | STOMACH ADENOCARCINOMA DIFFUSE TYPE | STOMACH ADENOCARCINOMA NOT OTHERWISE SPECIFIED (NOS) | STOMACH INTESTINAL ADENOCARCINOMA NOT OTHERWISE SPECIFIED (NOS) | STOMACH INTESTINAL ADENOCARCINOMA MUCINOUS TYPE | STOMACH ADENOCARCINOMA SIGNET RING TYPE | STOMACH ADENOCARCINOMA - DIFFUSE TYPE | STOMACH ADENOCARCINOMA - NOT OTHERWISE SPECIFIED (NOS) | STOMACH INTESTINAL ADENOCARCINOMA - MUCINOUS TYPE | STOMACH INTESTINAL ADENOCARCINOMA - PAPILLARY TYPE | STOMACH INTESTINAL ADENOCARCINOMA - TUBULAR TYPE | STOMACH INTESTINAL ADENOCARCINOMA - TYPE NOT OTHERWISE SPECIFIED (NOS) |
|---|---|---|---|---|---|---|---|---|---|---|---|
| ALL | 10 | 16 | 8 | 3 | 1 | 16 | 73 | 7 | 3 | 10 | 28 |
| subtype1 | 9 | 8 | 4 | 2 | 1 | 6 | 34 | 2 | 1 | 1 | 10 |
| subtype2 | 0 | 1 | 0 | 0 | 0 | 4 | 5 | 0 | 0 | 1 | 6 |
| subtype3 | 1 | 0 | 0 | 0 | 0 | 0 | 7 | 1 | 0 | 0 | 3 |
| subtype4 | 0 | 7 | 4 | 1 | 0 | 6 | 27 | 4 | 2 | 8 | 9 |
Figure S4. Get High-res Image Clustering Approach #1: 'Copy Number Ratio CNMF subtypes' versus Clinical Feature #4: 'HISTOLOGICAL.TYPE'
P value = 0.486 (Chi-square test), Q value = 1
Table S6. Clustering Approach #1: 'Copy Number Ratio CNMF subtypes' versus Clinical Feature #5: 'PATHOLOGY.T'
| nPatients | T1 | T2 | T3 | T4 |
|---|---|---|---|---|
| ALL | 6 | 52 | 56 | 18 |
| subtype1 | 2 | 17 | 23 | 9 |
| subtype2 | 2 | 7 | 5 | 2 |
| subtype3 | 1 | 3 | 6 | 0 |
| subtype4 | 1 | 25 | 22 | 7 |
Figure S5. Get High-res Image Clustering Approach #1: 'Copy Number Ratio CNMF subtypes' versus Clinical Feature #5: 'PATHOLOGY.T'
P value = 0.405 (Chi-square test), Q value = 1
Table S7. Clustering Approach #1: 'Copy Number Ratio CNMF subtypes' versus Clinical Feature #6: 'PATHOLOGY.N'
| nPatients | N0 | N1 | N2 | N3 |
|---|---|---|---|---|
| ALL | 44 | 49 | 23 | 15 |
| subtype1 | 19 | 20 | 9 | 4 |
| subtype2 | 7 | 2 | 2 | 4 |
| subtype3 | 3 | 4 | 2 | 0 |
| subtype4 | 15 | 23 | 10 | 7 |
Figure S6. Get High-res Image Clustering Approach #1: 'Copy Number Ratio CNMF subtypes' versus Clinical Feature #6: 'PATHOLOGY.N'
P value = 0.475 (Chi-square test), Q value = 1
Table S8. Clustering Approach #1: 'Copy Number Ratio CNMF subtypes' versus Clinical Feature #7: 'PATHOLOGICSPREAD(M)'
| nPatients | M0 | M1 | MX |
|---|---|---|---|
| ALL | 118 | 16 | 8 |
| subtype1 | 43 | 9 | 4 |
| subtype2 | 15 | 1 | 0 |
| subtype3 | 11 | 0 | 0 |
| subtype4 | 49 | 6 | 4 |
Figure S7. Get High-res Image Clustering Approach #1: 'Copy Number Ratio CNMF subtypes' versus Clinical Feature #7: 'PATHOLOGICSPREAD(M)'
P value = 0.445 (Chi-square test), Q value = 1
Table S9. Clustering Approach #1: 'Copy Number Ratio CNMF subtypes' versus Clinical Feature #8: 'TUMOR.STAGE'
| nPatients | I | II | III | IV |
|---|---|---|---|---|
| ALL | 24 | 37 | 39 | 26 |
| subtype1 | 10 | 13 | 15 | 11 |
| subtype2 | 5 | 3 | 4 | 3 |
| subtype3 | 0 | 4 | 5 | 0 |
| subtype4 | 9 | 17 | 15 | 12 |
Figure S8. Get High-res Image Clustering Approach #1: 'Copy Number Ratio CNMF subtypes' versus Clinical Feature #8: 'TUMOR.STAGE'

P value = 0.447 (Fisher's exact test), Q value = 1
Table S10. Clustering Approach #1: 'Copy Number Ratio CNMF subtypes' versus Clinical Feature #9: 'RADIATIONS.RADIATION.REGIMENINDICATION'
| nPatients | NO | YES |
|---|---|---|
| ALL | 5 | 175 |
| subtype1 | 1 | 79 |
| subtype2 | 0 | 17 |
| subtype3 | 0 | 12 |
| subtype4 | 4 | 67 |
Figure S9. Get High-res Image Clustering Approach #1: 'Copy Number Ratio CNMF subtypes' versus Clinical Feature #9: 'RADIATIONS.RADIATION.REGIMENINDICATION'
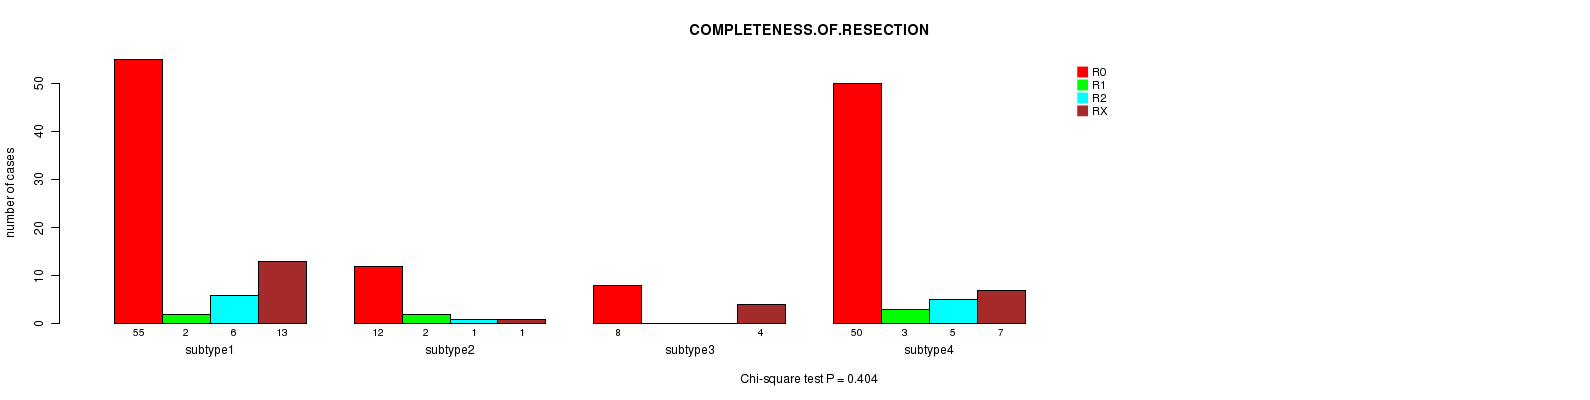
P value = 0.404 (Chi-square test), Q value = 1
Table S11. Clustering Approach #1: 'Copy Number Ratio CNMF subtypes' versus Clinical Feature #10: 'COMPLETENESS.OF.RESECTION'
| nPatients | R0 | R1 | R2 | RX |
|---|---|---|---|---|
| ALL | 125 | 7 | 12 | 25 |
| subtype1 | 55 | 2 | 6 | 13 |
| subtype2 | 12 | 2 | 1 | 1 |
| subtype3 | 8 | 0 | 0 | 4 |
| subtype4 | 50 | 3 | 5 | 7 |
Figure S10. Get High-res Image Clustering Approach #1: 'Copy Number Ratio CNMF subtypes' versus Clinical Feature #10: 'COMPLETENESS.OF.RESECTION'
P value = 0.398 (ANOVA), Q value = 1
Table S12. Clustering Approach #1: 'Copy Number Ratio CNMF subtypes' versus Clinical Feature #11: 'NUMBER.OF.LYMPH.NODES'
| nPatients | Mean (Std.Dev) | |
|---|---|---|
| ALL | 136 | 4.0 (5.6) |
| subtype1 | 67 | 3.3 (4.5) |
| subtype2 | 8 | 6.2 (7.4) |
| subtype3 | 8 | 3.2 (4.0) |
| subtype4 | 53 | 4.6 (6.7) |
Figure S11. Get High-res Image Clustering Approach #1: 'Copy Number Ratio CNMF subtypes' versus Clinical Feature #11: 'NUMBER.OF.LYMPH.NODES'
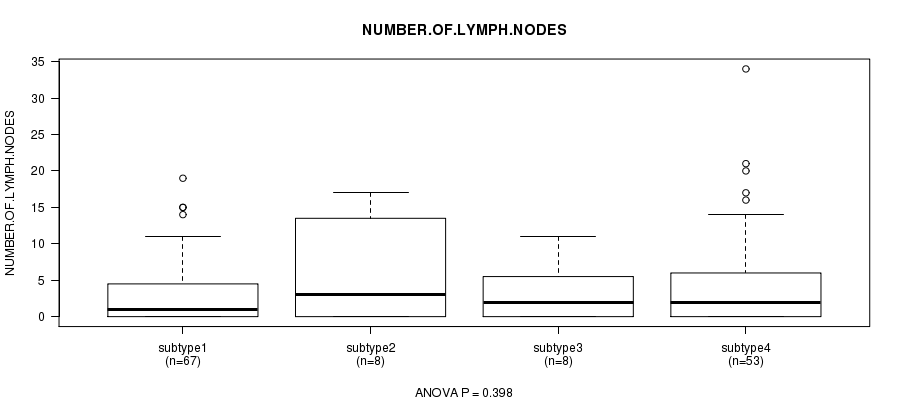
Table S13. Get Full Table Description of clustering approach #2: 'METHLYATION CNMF'
| Cluster Labels | 1 | 2 | 3 | 4 |
|---|---|---|---|---|
| Number of samples | 18 | 30 | 39 | 46 |
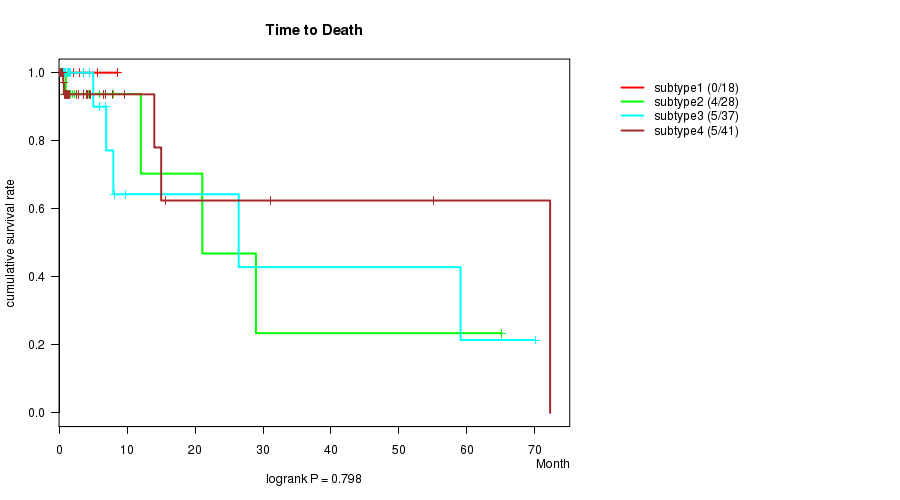
P value = 0.798 (logrank test), Q value = 1
Table S14. Clustering Approach #2: 'METHLYATION CNMF' versus Clinical Feature #1: 'Time to Death'
| nPatients | nDeath | Duration Range (Median), Month | |
|---|---|---|---|
| ALL | 124 | 14 | 0.1 - 72.2 (1.0) |
| subtype1 | 18 | 0 | 0.1 - 8.7 (0.9) |
| subtype2 | 28 | 4 | 0.1 - 65.1 (1.0) |
| subtype3 | 37 | 5 | 0.1 - 70.1 (1.0) |
| subtype4 | 41 | 5 | 0.1 - 72.2 (1.5) |
Figure S12. Get High-res Image Clustering Approach #2: 'METHLYATION CNMF' versus Clinical Feature #1: 'Time to Death'
P value = 0.000779 (ANOVA), Q value = 0.051
Table S15. Clustering Approach #2: 'METHLYATION CNMF' versus Clinical Feature #2: 'AGE'
| nPatients | Mean (Std.Dev) | |
|---|---|---|
| ALL | 126 | 65.6 (11.2) |
| subtype1 | 17 | 62.8 (10.0) |
| subtype2 | 28 | 71.1 (10.0) |
| subtype3 | 39 | 60.9 (11.9) |
| subtype4 | 42 | 67.4 (9.7) |
Figure S13. Get High-res Image Clustering Approach #2: 'METHLYATION CNMF' versus Clinical Feature #2: 'AGE'
P value = 1 (Fisher's exact test), Q value = 1
Table S16. Clustering Approach #2: 'METHLYATION CNMF' versus Clinical Feature #3: 'GENDER'
| nPatients | FEMALE | MALE |
|---|---|---|
| ALL | 50 | 83 |
| subtype1 | 7 | 11 |
| subtype2 | 11 | 19 |
| subtype3 | 15 | 24 |
| subtype4 | 17 | 29 |
Figure S14. Get High-res Image Clustering Approach #2: 'METHLYATION CNMF' versus Clinical Feature #3: 'GENDER'
P value = 0.0472 (Chi-square test), Q value = 1
Table S17. Clustering Approach #2: 'METHLYATION CNMF' versus Clinical Feature #4: 'HISTOLOGICAL.TYPE'
| nPatients | STOMACH ADENOCARCINOMA DIFFUSE TYPE | STOMACH ADENOCARCINOMA NOT OTHERWISE SPECIFIED (NOS) | STOMACH INTESTINAL ADENOCARCINOMA NOT OTHERWISE SPECIFIED (NOS) | STOMACH INTESTINAL ADENOCARCINOMA MUCINOUS TYPE | STOMACH ADENOCARCINOMA SIGNET RING TYPE | STOMACH ADENOCARCINOMA - DIFFUSE TYPE | STOMACH ADENOCARCINOMA - NOT OTHERWISE SPECIFIED (NOS) | STOMACH INTESTINAL ADENOCARCINOMA - MUCINOUS TYPE | STOMACH INTESTINAL ADENOCARCINOMA - PAPILLARY TYPE | STOMACH INTESTINAL ADENOCARCINOMA - TUBULAR TYPE | STOMACH INTESTINAL ADENOCARCINOMA - TYPE NOT OTHERWISE SPECIFIED (NOS) |
|---|---|---|---|---|---|---|---|---|---|---|---|
| ALL | 10 | 16 | 8 | 3 | 1 | 14 | 44 | 6 | 3 | 9 | 19 |
| subtype1 | 1 | 5 | 1 | 0 | 0 | 3 | 6 | 0 | 0 | 1 | 1 |
| subtype2 | 1 | 6 | 1 | 1 | 0 | 2 | 7 | 2 | 1 | 2 | 7 |
| subtype3 | 8 | 1 | 2 | 2 | 1 | 6 | 13 | 2 | 0 | 0 | 4 |
| subtype4 | 0 | 4 | 4 | 0 | 0 | 3 | 18 | 2 | 2 | 6 | 7 |
Figure S15. Get High-res Image Clustering Approach #2: 'METHLYATION CNMF' versus Clinical Feature #4: 'HISTOLOGICAL.TYPE'
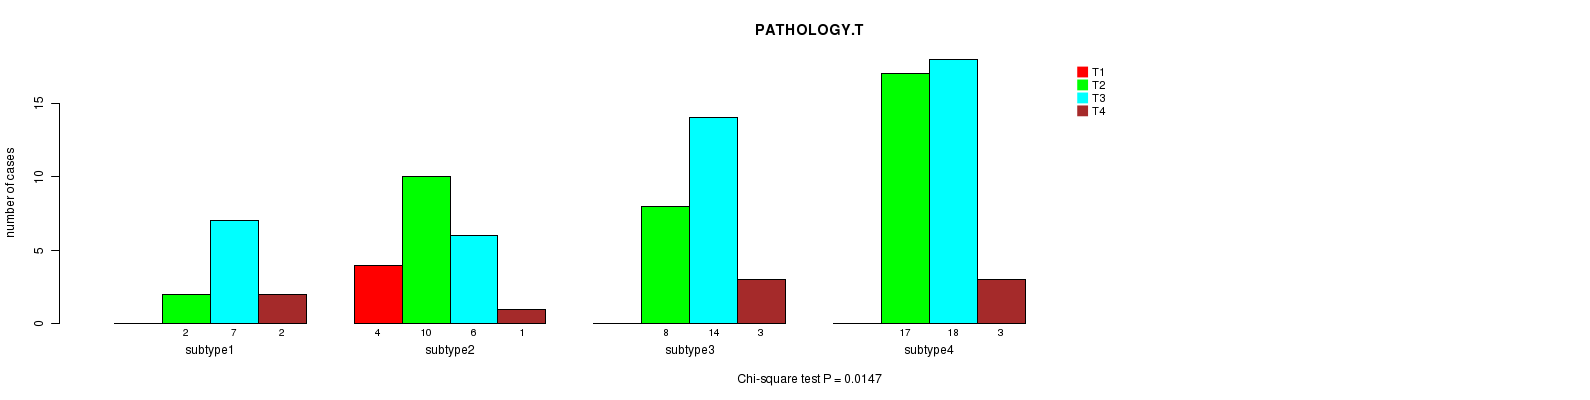
P value = 0.0147 (Chi-square test), Q value = 0.81
Table S18. Clustering Approach #2: 'METHLYATION CNMF' versus Clinical Feature #5: 'PATHOLOGY.T'
| nPatients | T1 | T2 | T3 | T4 |
|---|---|---|---|---|
| ALL | 4 | 37 | 45 | 9 |
| subtype1 | 0 | 2 | 7 | 2 |
| subtype2 | 4 | 10 | 6 | 1 |
| subtype3 | 0 | 8 | 14 | 3 |
| subtype4 | 0 | 17 | 18 | 3 |
Figure S16. Get High-res Image Clustering Approach #2: 'METHLYATION CNMF' versus Clinical Feature #5: 'PATHOLOGY.T'
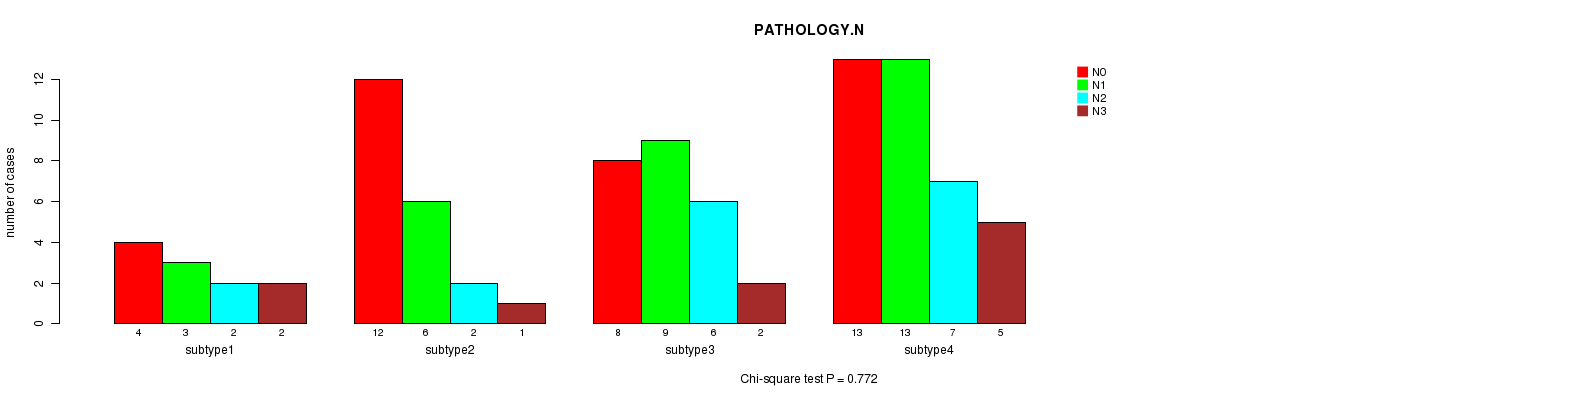
P value = 0.772 (Chi-square test), Q value = 1
Table S19. Clustering Approach #2: 'METHLYATION CNMF' versus Clinical Feature #6: 'PATHOLOGY.N'
| nPatients | N0 | N1 | N2 | N3 |
|---|---|---|---|---|
| ALL | 37 | 31 | 17 | 10 |
| subtype1 | 4 | 3 | 2 | 2 |
| subtype2 | 12 | 6 | 2 | 1 |
| subtype3 | 8 | 9 | 6 | 2 |
| subtype4 | 13 | 13 | 7 | 5 |
Figure S17. Get High-res Image Clustering Approach #2: 'METHLYATION CNMF' versus Clinical Feature #6: 'PATHOLOGY.N'
P value = 0.466 (Chi-square test), Q value = 1
Table S20. Clustering Approach #2: 'METHLYATION CNMF' versus Clinical Feature #7: 'PATHOLOGICSPREAD(M)'
| nPatients | M0 | M1 | MX |
|---|---|---|---|
| ALL | 81 | 9 | 5 |
| subtype1 | 8 | 2 | 1 |
| subtype2 | 19 | 1 | 1 |
| subtype3 | 21 | 4 | 0 |
| subtype4 | 33 | 2 | 3 |
Figure S18. Get High-res Image Clustering Approach #2: 'METHLYATION CNMF' versus Clinical Feature #7: 'PATHOLOGICSPREAD(M)'
P value = 0.0201 (Chi-square test), Q value = 1
Table S21. Clustering Approach #2: 'METHLYATION CNMF' versus Clinical Feature #8: 'TUMOR.STAGE'
| nPatients | I | II | III | IV |
|---|---|---|---|---|
| ALL | 17 | 33 | 30 | 15 |
| subtype1 | 1 | 2 | 6 | 2 |
| subtype2 | 10 | 6 | 3 | 2 |
| subtype3 | 2 | 10 | 8 | 5 |
| subtype4 | 4 | 15 | 13 | 6 |
Figure S19. Get High-res Image Clustering Approach #2: 'METHLYATION CNMF' versus Clinical Feature #8: 'TUMOR.STAGE'

P value = 0.192 (Fisher's exact test), Q value = 1
Table S22. Clustering Approach #2: 'METHLYATION CNMF' versus Clinical Feature #9: 'RADIATIONS.RADIATION.REGIMENINDICATION'
| nPatients | NO | YES |
|---|---|---|
| ALL | 5 | 128 |
| subtype1 | 0 | 18 |
| subtype2 | 1 | 29 |
| subtype3 | 0 | 39 |
| subtype4 | 4 | 42 |
Figure S20. Get High-res Image Clustering Approach #2: 'METHLYATION CNMF' versus Clinical Feature #9: 'RADIATIONS.RADIATION.REGIMENINDICATION'
P value = 0.435 (Chi-square test), Q value = 1
Table S23. Clustering Approach #2: 'METHLYATION CNMF' versus Clinical Feature #10: 'COMPLETENESS.OF.RESECTION'
| nPatients | R0 | R1 | R2 |
|---|---|---|---|
| ALL | 110 | 6 | 5 |
| subtype1 | 15 | 0 | 1 |
| subtype2 | 29 | 0 | 1 |
| subtype3 | 30 | 4 | 1 |
| subtype4 | 36 | 2 | 2 |
Figure S21. Get High-res Image Clustering Approach #2: 'METHLYATION CNMF' versus Clinical Feature #10: 'COMPLETENESS.OF.RESECTION'
P value = 0.716 (ANOVA), Q value = 1
Table S24. Clustering Approach #2: 'METHLYATION CNMF' versus Clinical Feature #11: 'NUMBER.OF.LYMPH.NODES'
| nPatients | Mean (Std.Dev) | |
|---|---|---|
| ALL | 122 | 4.2 (5.9) |
| subtype1 | 16 | 5.6 (6.6) |
| subtype2 | 29 | 3.5 (6.9) |
| subtype3 | 36 | 4.1 (5.5) |
| subtype4 | 41 | 4.1 (5.2) |
Figure S22. Get High-res Image Clustering Approach #2: 'METHLYATION CNMF' versus Clinical Feature #11: 'NUMBER.OF.LYMPH.NODES'
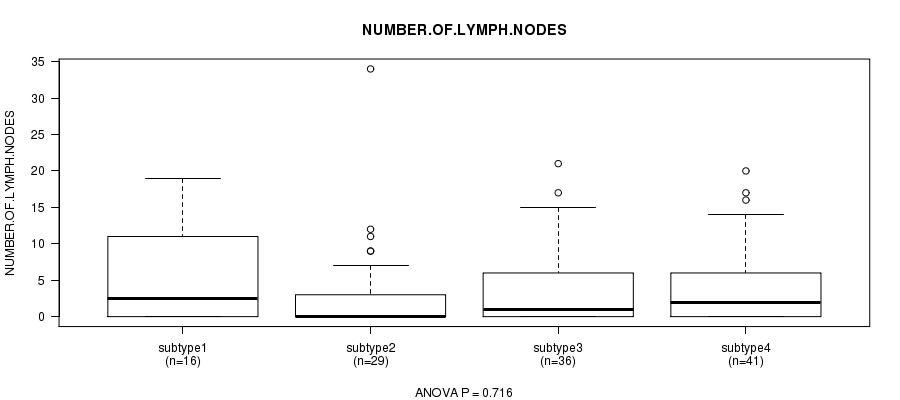
Table S25. Get Full Table Description of clustering approach #3: 'RNAseq CNMF subtypes'
| Cluster Labels | 1 | 2 | 3 | 4 | 5 |
|---|---|---|---|---|---|
| Number of samples | 28 | 29 | 22 | 29 | 39 |
P value = 0.751 (logrank test), Q value = 1
Table S26. Clustering Approach #3: 'RNAseq CNMF subtypes' versus Clinical Feature #1: 'Time to Death'
| nPatients | nDeath | Duration Range (Median), Month | |
|---|---|---|---|
| ALL | 113 | 15 | 0.1 - 72.2 (1.4) |
| subtype1 | 20 | 2 | 0.1 - 70.1 (1.0) |
| subtype2 | 23 | 2 | 0.1 - 59.0 (1.2) |
| subtype3 | 15 | 2 | 0.2 - 55.0 (3.0) |
| subtype4 | 23 | 5 | 0.2 - 53.0 (3.6) |
| subtype5 | 32 | 4 | 0.3 - 72.2 (3.2) |
Figure S23. Get High-res Image Clustering Approach #3: 'RNAseq CNMF subtypes' versus Clinical Feature #1: 'Time to Death'
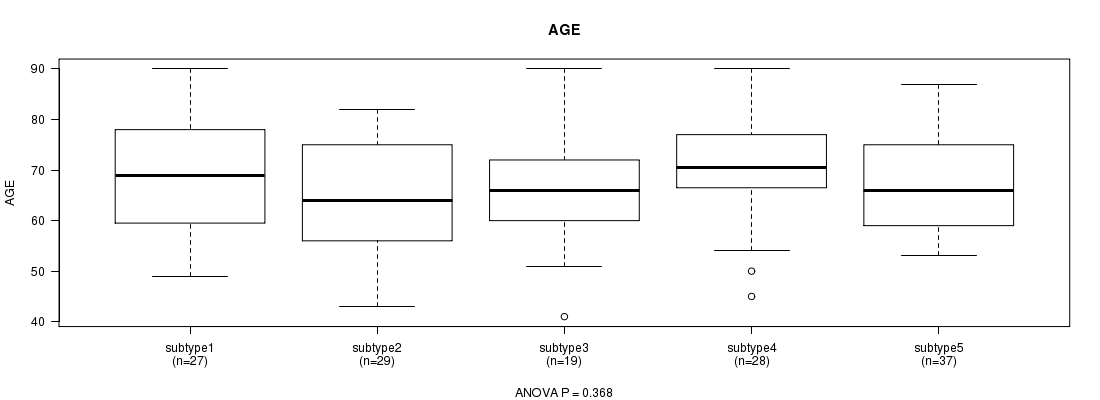
P value = 0.368 (ANOVA), Q value = 1
Table S27. Clustering Approach #3: 'RNAseq CNMF subtypes' versus Clinical Feature #2: 'AGE'
| nPatients | Mean (Std.Dev) | |
|---|---|---|
| ALL | 140 | 67.2 (10.7) |
| subtype1 | 27 | 68.4 (11.0) |
| subtype2 | 29 | 64.4 (11.7) |
| subtype3 | 19 | 66.2 (12.2) |
| subtype4 | 28 | 70.0 (10.3) |
| subtype5 | 37 | 67.1 (9.0) |
Figure S24. Get High-res Image Clustering Approach #3: 'RNAseq CNMF subtypes' versus Clinical Feature #2: 'AGE'
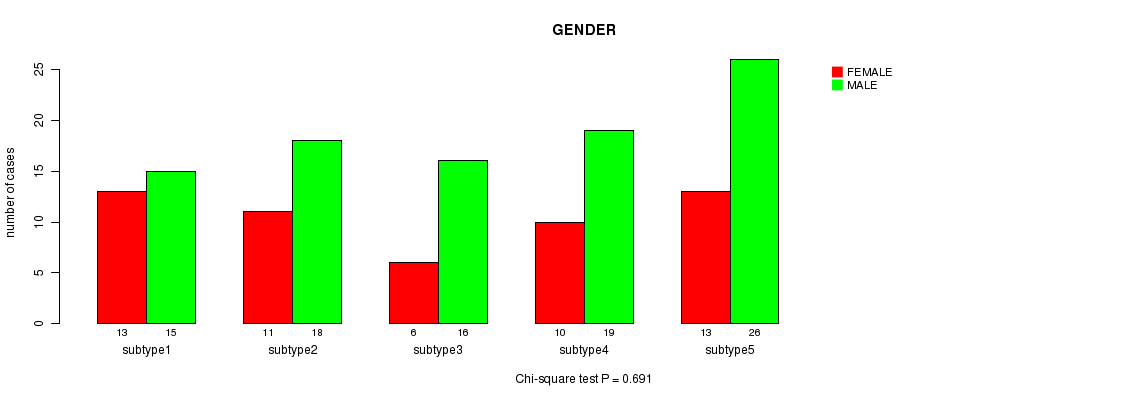
P value = 0.691 (Chi-square test), Q value = 1
Table S28. Clustering Approach #3: 'RNAseq CNMF subtypes' versus Clinical Feature #3: 'GENDER'
| nPatients | FEMALE | MALE |
|---|---|---|
| ALL | 53 | 94 |
| subtype1 | 13 | 15 |
| subtype2 | 11 | 18 |
| subtype3 | 6 | 16 |
| subtype4 | 10 | 19 |
| subtype5 | 13 | 26 |
Figure S25. Get High-res Image Clustering Approach #3: 'RNAseq CNMF subtypes' versus Clinical Feature #3: 'GENDER'
P value = 0.0122 (Chi-square test), Q value = 0.68
Table S29. Clustering Approach #3: 'RNAseq CNMF subtypes' versus Clinical Feature #4: 'HISTOLOGICAL.TYPE'
| nPatients | STOMACH ADENOCARCINOMA DIFFUSE TYPE | STOMACH ADENOCARCINOMA NOT OTHERWISE SPECIFIED (NOS) | STOMACH INTESTINAL ADENOCARCINOMA NOT OTHERWISE SPECIFIED (NOS) | STOMACH INTESTINAL ADENOCARCINOMA MUCINOUS TYPE | STOMACH ADENOCARCINOMA - DIFFUSE TYPE | STOMACH ADENOCARCINOMA - NOT OTHERWISE SPECIFIED (NOS) | STOMACH INTESTINAL ADENOCARCINOMA - MUCINOUS TYPE | STOMACH INTESTINAL ADENOCARCINOMA - PAPILLARY TYPE | STOMACH INTESTINAL ADENOCARCINOMA - TUBULAR TYPE | STOMACH INTESTINAL ADENOCARCINOMA - TYPE NOT OTHERWISE SPECIFIED (NOS) |
|---|---|---|---|---|---|---|---|---|---|---|
| ALL | 5 | 6 | 4 | 2 | 16 | 67 | 6 | 3 | 10 | 23 |
| subtype1 | 0 | 4 | 0 | 0 | 4 | 16 | 0 | 0 | 1 | 3 |
| subtype2 | 5 | 0 | 1 | 1 | 3 | 15 | 2 | 0 | 0 | 1 |
| subtype3 | 0 | 0 | 0 | 0 | 3 | 9 | 2 | 1 | 1 | 5 |
| subtype4 | 0 | 1 | 0 | 0 | 3 | 10 | 1 | 1 | 3 | 8 |
| subtype5 | 0 | 1 | 3 | 1 | 3 | 17 | 1 | 1 | 5 | 6 |
Figure S26. Get High-res Image Clustering Approach #3: 'RNAseq CNMF subtypes' versus Clinical Feature #4: 'HISTOLOGICAL.TYPE'
P value = 0.00512 (Chi-square test), Q value = 0.3
Table S30. Clustering Approach #3: 'RNAseq CNMF subtypes' versus Clinical Feature #5: 'PATHOLOGY.T'
| nPatients | T1 | T2 | T3 | T4 |
|---|---|---|---|---|
| ALL | 6 | 48 | 50 | 17 |
| subtype1 | 0 | 9 | 9 | 2 |
| subtype2 | 0 | 2 | 14 | 4 |
| subtype3 | 0 | 12 | 5 | 4 |
| subtype4 | 5 | 13 | 7 | 3 |
| subtype5 | 1 | 12 | 15 | 4 |
Figure S27. Get High-res Image Clustering Approach #3: 'RNAseq CNMF subtypes' versus Clinical Feature #5: 'PATHOLOGY.T'
P value = 0.633 (Chi-square test), Q value = 1
Table S31. Clustering Approach #3: 'RNAseq CNMF subtypes' versus Clinical Feature #6: 'PATHOLOGY.N'
| nPatients | N0 | N1 | N2 | N3 |
|---|---|---|---|---|
| ALL | 41 | 44 | 20 | 14 |
| subtype1 | 8 | 8 | 2 | 2 |
| subtype2 | 6 | 9 | 4 | 2 |
| subtype3 | 4 | 10 | 3 | 5 |
| subtype4 | 13 | 6 | 5 | 2 |
| subtype5 | 10 | 11 | 6 | 3 |
Figure S28. Get High-res Image Clustering Approach #3: 'RNAseq CNMF subtypes' versus Clinical Feature #6: 'PATHOLOGY.N'

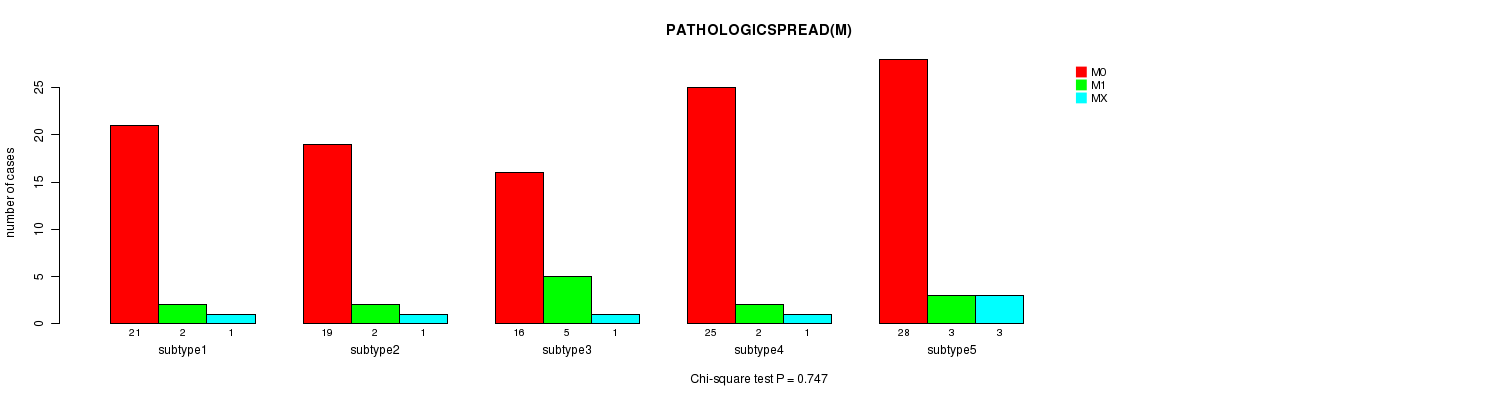
P value = 0.747 (Chi-square test), Q value = 1
Table S32. Clustering Approach #3: 'RNAseq CNMF subtypes' versus Clinical Feature #7: 'PATHOLOGICSPREAD(M)'
| nPatients | M0 | M1 | MX |
|---|---|---|---|
| ALL | 109 | 14 | 7 |
| subtype1 | 21 | 2 | 1 |
| subtype2 | 19 | 2 | 1 |
| subtype3 | 16 | 5 | 1 |
| subtype4 | 25 | 2 | 1 |
| subtype5 | 28 | 3 | 3 |
Figure S29. Get High-res Image Clustering Approach #3: 'RNAseq CNMF subtypes' versus Clinical Feature #7: 'PATHOLOGICSPREAD(M)'
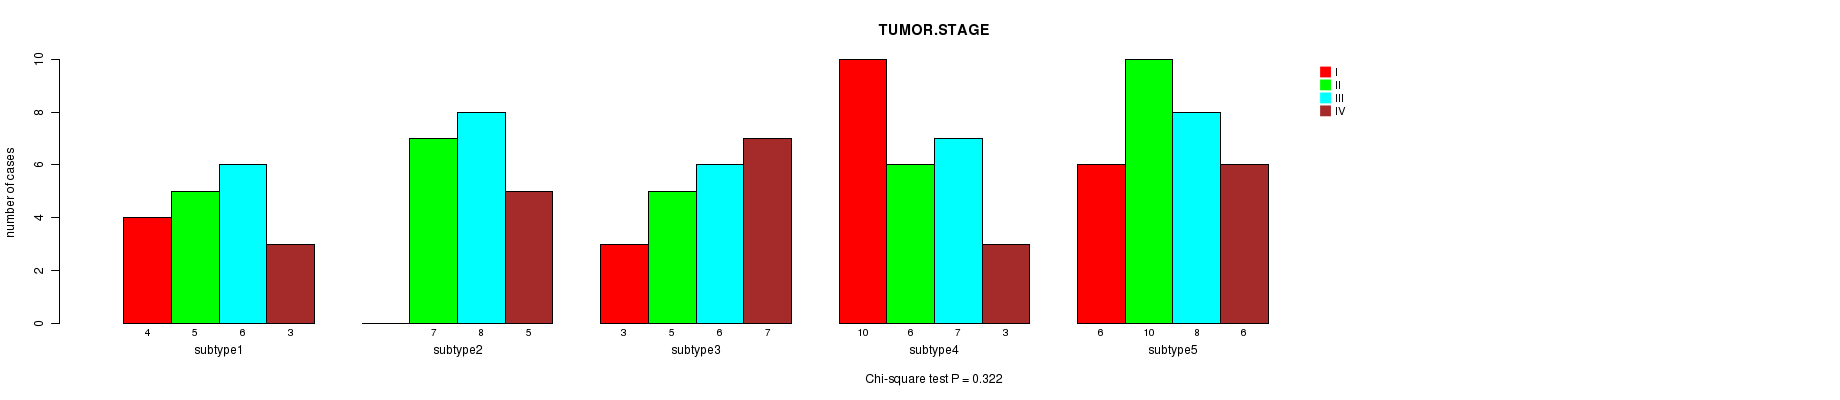
P value = 0.322 (Chi-square test), Q value = 1
Table S33. Clustering Approach #3: 'RNAseq CNMF subtypes' versus Clinical Feature #8: 'TUMOR.STAGE'
| nPatients | I | II | III | IV |
|---|---|---|---|---|
| ALL | 23 | 33 | 35 | 24 |
| subtype1 | 4 | 5 | 6 | 3 |
| subtype2 | 0 | 7 | 8 | 5 |
| subtype3 | 3 | 5 | 6 | 7 |
| subtype4 | 10 | 6 | 7 | 3 |
| subtype5 | 6 | 10 | 8 | 6 |
Figure S30. Get High-res Image Clustering Approach #3: 'RNAseq CNMF subtypes' versus Clinical Feature #8: 'TUMOR.STAGE'
P value = 0.00139 (Chi-square test), Q value = 0.087
Table S34. Clustering Approach #3: 'RNAseq CNMF subtypes' versus Clinical Feature #9: 'RADIATIONS.RADIATION.REGIMENINDICATION'
| nPatients | NO | YES |
|---|---|---|
| ALL | 5 | 142 |
| subtype1 | 0 | 28 |
| subtype2 | 0 | 29 |
| subtype3 | 4 | 18 |
| subtype4 | 0 | 29 |
| subtype5 | 1 | 38 |
Figure S31. Get High-res Image Clustering Approach #3: 'RNAseq CNMF subtypes' versus Clinical Feature #9: 'RADIATIONS.RADIATION.REGIMENINDICATION'
P value = 0.485 (Chi-square test), Q value = 1
Table S35. Clustering Approach #3: 'RNAseq CNMF subtypes' versus Clinical Feature #10: 'COMPLETENESS.OF.RESECTION'
| nPatients | R0 | R1 | R2 | RX |
|---|---|---|---|---|
| ALL | 98 | 6 | 10 | 22 |
| subtype1 | 18 | 0 | 2 | 7 |
| subtype2 | 18 | 1 | 0 | 5 |
| subtype3 | 14 | 2 | 4 | 2 |
| subtype4 | 21 | 1 | 2 | 4 |
| subtype5 | 27 | 2 | 2 | 4 |
Figure S32. Get High-res Image Clustering Approach #3: 'RNAseq CNMF subtypes' versus Clinical Feature #10: 'COMPLETENESS.OF.RESECTION'
P value = 0.068 (ANOVA), Q value = 1
Table S36. Clustering Approach #3: 'RNAseq CNMF subtypes' versus Clinical Feature #11: 'NUMBER.OF.LYMPH.NODES'
| nPatients | Mean (Std.Dev) | |
|---|---|---|
| ALL | 105 | 4.3 (6.1) |
| subtype1 | 18 | 4.1 (8.7) |
| subtype2 | 24 | 5.5 (4.9) |
| subtype3 | 17 | 6.4 (7.1) |
| subtype4 | 19 | 1.0 (1.8) |
| subtype5 | 27 | 4.2 (5.5) |
Figure S33. Get High-res Image Clustering Approach #3: 'RNAseq CNMF subtypes' versus Clinical Feature #11: 'NUMBER.OF.LYMPH.NODES'
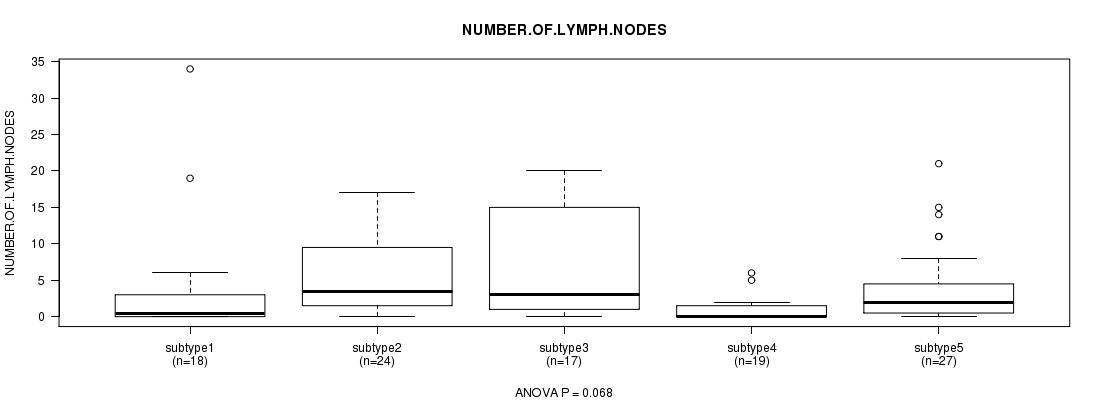
Table S37. Get Full Table Description of clustering approach #4: 'RNAseq cHierClus subtypes'
| Cluster Labels | 1 | 2 | 3 |
|---|---|---|---|
| Number of samples | 46 | 59 | 42 |
P value = 0.512 (logrank test), Q value = 1
Table S38. Clustering Approach #4: 'RNAseq cHierClus subtypes' versus Clinical Feature #1: 'Time to Death'
| nPatients | nDeath | Duration Range (Median), Month | |
|---|---|---|---|
| ALL | 113 | 15 | 0.1 - 72.2 (1.4) |
| subtype1 | 36 | 2 | 0.1 - 59.0 (1.0) |
| subtype2 | 42 | 8 | 0.1 - 55.0 (2.5) |
| subtype3 | 35 | 5 | 0.3 - 72.2 (4.3) |
Figure S34. Get High-res Image Clustering Approach #4: 'RNAseq cHierClus subtypes' versus Clinical Feature #1: 'Time to Death'
P value = 0.00246 (ANOVA), Q value = 0.15
Table S39. Clustering Approach #4: 'RNAseq cHierClus subtypes' versus Clinical Feature #2: 'AGE'
| nPatients | Mean (Std.Dev) | |
|---|---|---|
| ALL | 140 | 67.2 (10.7) |
| subtype1 | 45 | 64.1 (10.6) |
| subtype2 | 55 | 71.0 (10.6) |
| subtype3 | 40 | 65.6 (9.7) |
Figure S35. Get High-res Image Clustering Approach #4: 'RNAseq cHierClus subtypes' versus Clinical Feature #2: 'AGE'

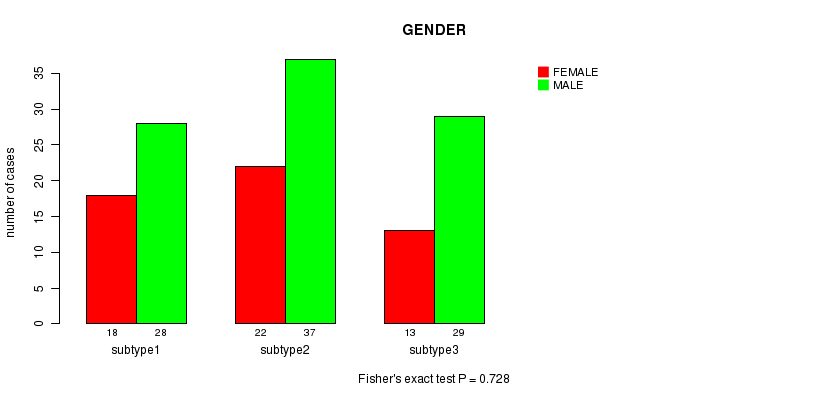
P value = 0.728 (Fisher's exact test), Q value = 1
Table S40. Clustering Approach #4: 'RNAseq cHierClus subtypes' versus Clinical Feature #3: 'GENDER'
| nPatients | FEMALE | MALE |
|---|---|---|
| ALL | 53 | 94 |
| subtype1 | 18 | 28 |
| subtype2 | 22 | 37 |
| subtype3 | 13 | 29 |
Figure S36. Get High-res Image Clustering Approach #4: 'RNAseq cHierClus subtypes' versus Clinical Feature #3: 'GENDER'
P value = 0.00339 (Chi-square test), Q value = 0.21
Table S41. Clustering Approach #4: 'RNAseq cHierClus subtypes' versus Clinical Feature #4: 'HISTOLOGICAL.TYPE'
| nPatients | STOMACH ADENOCARCINOMA DIFFUSE TYPE | STOMACH ADENOCARCINOMA NOT OTHERWISE SPECIFIED (NOS) | STOMACH INTESTINAL ADENOCARCINOMA NOT OTHERWISE SPECIFIED (NOS) | STOMACH INTESTINAL ADENOCARCINOMA MUCINOUS TYPE | STOMACH ADENOCARCINOMA - DIFFUSE TYPE | STOMACH ADENOCARCINOMA - NOT OTHERWISE SPECIFIED (NOS) | STOMACH INTESTINAL ADENOCARCINOMA - MUCINOUS TYPE | STOMACH INTESTINAL ADENOCARCINOMA - PAPILLARY TYPE | STOMACH INTESTINAL ADENOCARCINOMA - TUBULAR TYPE | STOMACH INTESTINAL ADENOCARCINOMA - TYPE NOT OTHERWISE SPECIFIED (NOS) |
|---|---|---|---|---|---|---|---|---|---|---|
| ALL | 5 | 6 | 4 | 2 | 16 | 67 | 6 | 3 | 10 | 23 |
| subtype1 | 5 | 1 | 1 | 2 | 7 | 22 | 2 | 0 | 1 | 3 |
| subtype2 | 0 | 3 | 0 | 0 | 2 | 26 | 3 | 2 | 5 | 16 |
| subtype3 | 0 | 2 | 3 | 0 | 7 | 19 | 1 | 1 | 4 | 4 |
Figure S37. Get High-res Image Clustering Approach #4: 'RNAseq cHierClus subtypes' versus Clinical Feature #4: 'HISTOLOGICAL.TYPE'
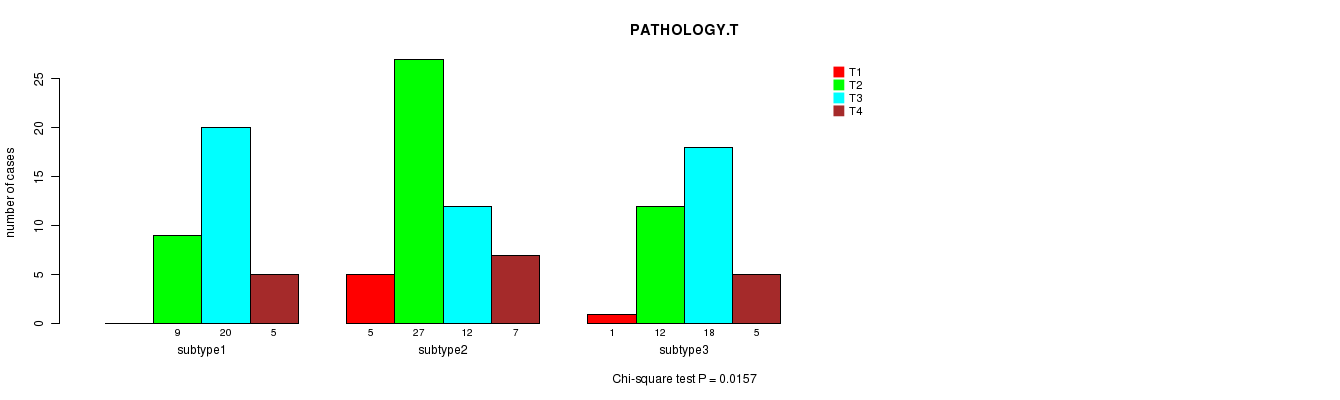
P value = 0.0157 (Chi-square test), Q value = 0.84
Table S42. Clustering Approach #4: 'RNAseq cHierClus subtypes' versus Clinical Feature #5: 'PATHOLOGY.T'
| nPatients | T1 | T2 | T3 | T4 |
|---|---|---|---|---|
| ALL | 6 | 48 | 50 | 17 |
| subtype1 | 0 | 9 | 20 | 5 |
| subtype2 | 5 | 27 | 12 | 7 |
| subtype3 | 1 | 12 | 18 | 5 |
Figure S38. Get High-res Image Clustering Approach #4: 'RNAseq cHierClus subtypes' versus Clinical Feature #5: 'PATHOLOGY.T'
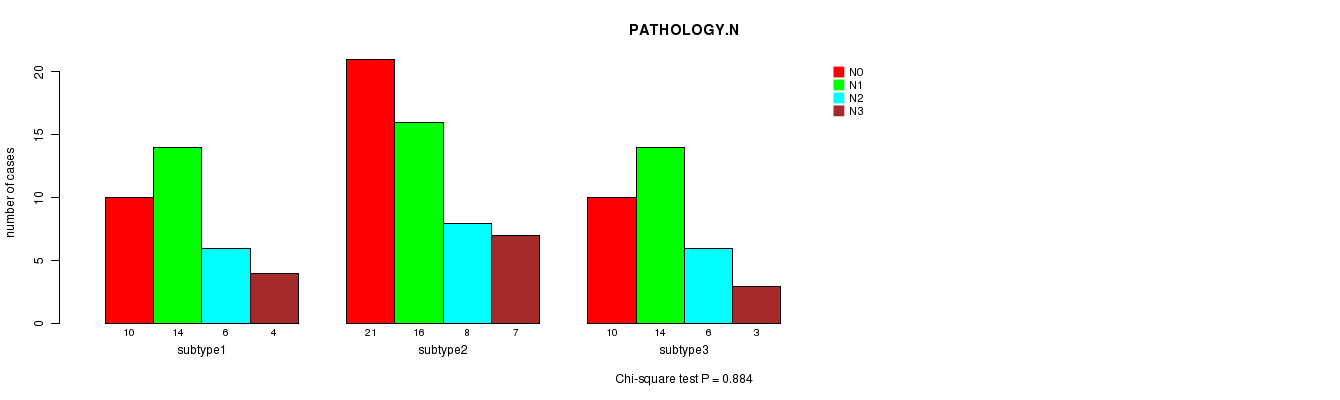
P value = 0.884 (Chi-square test), Q value = 1
Table S43. Clustering Approach #4: 'RNAseq cHierClus subtypes' versus Clinical Feature #6: 'PATHOLOGY.N'
| nPatients | N0 | N1 | N2 | N3 |
|---|---|---|---|---|
| ALL | 41 | 44 | 20 | 14 |
| subtype1 | 10 | 14 | 6 | 4 |
| subtype2 | 21 | 16 | 8 | 7 |
| subtype3 | 10 | 14 | 6 | 3 |
Figure S39. Get High-res Image Clustering Approach #4: 'RNAseq cHierClus subtypes' versus Clinical Feature #6: 'PATHOLOGY.N'
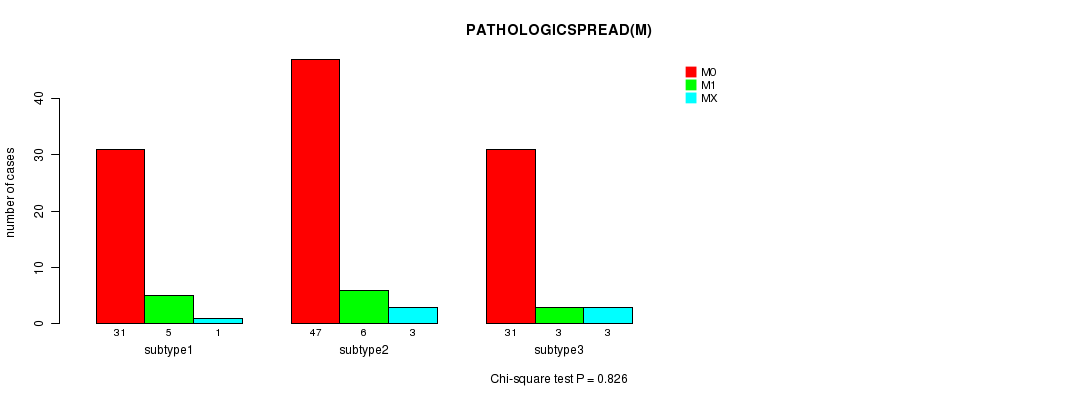
P value = 0.826 (Chi-square test), Q value = 1
Table S44. Clustering Approach #4: 'RNAseq cHierClus subtypes' versus Clinical Feature #7: 'PATHOLOGICSPREAD(M)'
| nPatients | M0 | M1 | MX |
|---|---|---|---|
| ALL | 109 | 14 | 7 |
| subtype1 | 31 | 5 | 1 |
| subtype2 | 47 | 6 | 3 |
| subtype3 | 31 | 3 | 3 |
Figure S40. Get High-res Image Clustering Approach #4: 'RNAseq cHierClus subtypes' versus Clinical Feature #7: 'PATHOLOGICSPREAD(M)'
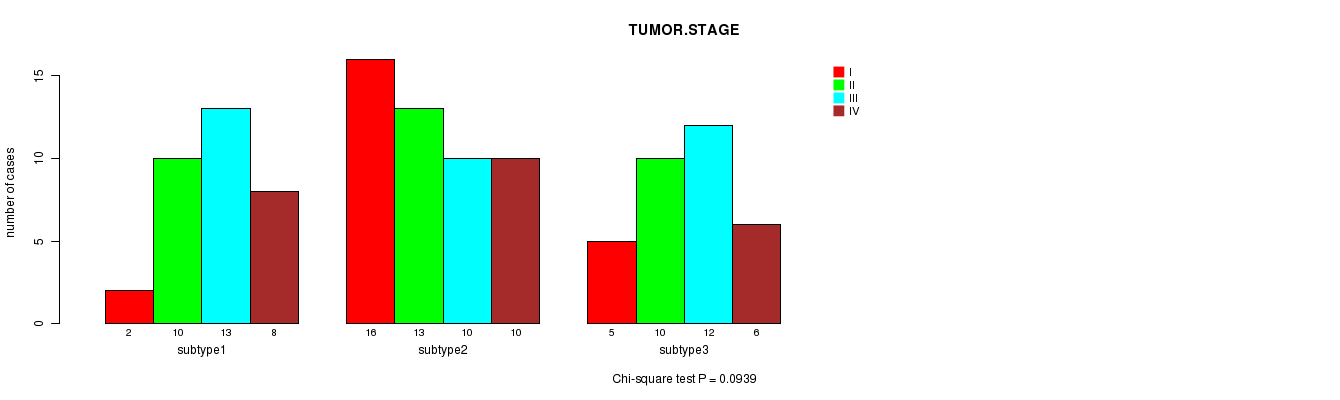
P value = 0.0939 (Chi-square test), Q value = 1
Table S45. Clustering Approach #4: 'RNAseq cHierClus subtypes' versus Clinical Feature #8: 'TUMOR.STAGE'
| nPatients | I | II | III | IV |
|---|---|---|---|---|
| ALL | 23 | 33 | 35 | 24 |
| subtype1 | 2 | 10 | 13 | 8 |
| subtype2 | 16 | 13 | 10 | 10 |
| subtype3 | 5 | 10 | 12 | 6 |
Figure S41. Get High-res Image Clustering Approach #4: 'RNAseq cHierClus subtypes' versus Clinical Feature #8: 'TUMOR.STAGE'
P value = 0.149 (Fisher's exact test), Q value = 1
Table S46. Clustering Approach #4: 'RNAseq cHierClus subtypes' versus Clinical Feature #9: 'RADIATIONS.RADIATION.REGIMENINDICATION'
| nPatients | NO | YES |
|---|---|---|
| ALL | 5 | 142 |
| subtype1 | 0 | 46 |
| subtype2 | 4 | 55 |
| subtype3 | 1 | 41 |
Figure S42. Get High-res Image Clustering Approach #4: 'RNAseq cHierClus subtypes' versus Clinical Feature #9: 'RADIATIONS.RADIATION.REGIMENINDICATION'
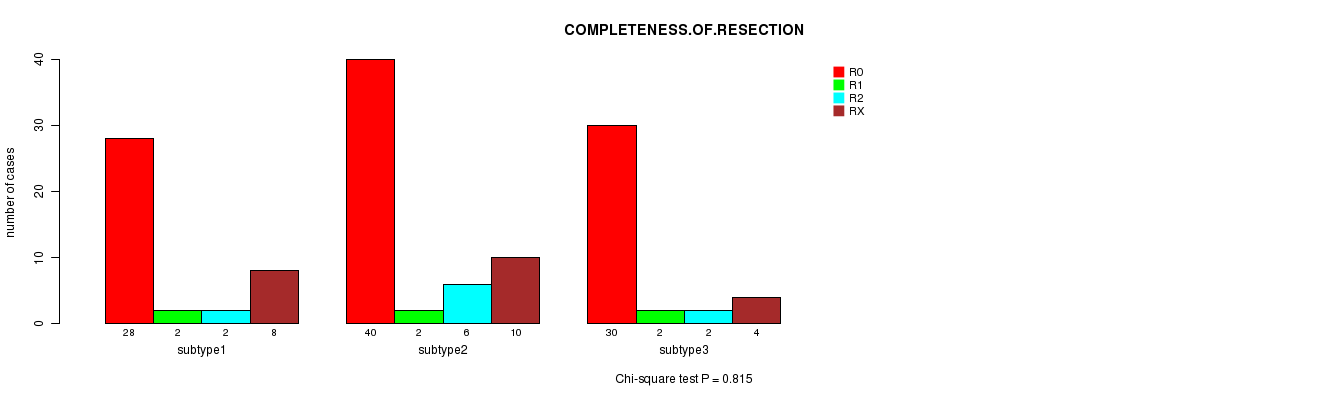
P value = 0.815 (Chi-square test), Q value = 1
Table S47. Clustering Approach #4: 'RNAseq cHierClus subtypes' versus Clinical Feature #10: 'COMPLETENESS.OF.RESECTION'
| nPatients | R0 | R1 | R2 | RX |
|---|---|---|---|---|
| ALL | 98 | 6 | 10 | 22 |
| subtype1 | 28 | 2 | 2 | 8 |
| subtype2 | 40 | 2 | 6 | 10 |
| subtype3 | 30 | 2 | 2 | 4 |
Figure S43. Get High-res Image Clustering Approach #4: 'RNAseq cHierClus subtypes' versus Clinical Feature #10: 'COMPLETENESS.OF.RESECTION'
P value = 0.103 (ANOVA), Q value = 1
Table S48. Clustering Approach #4: 'RNAseq cHierClus subtypes' versus Clinical Feature #11: 'NUMBER.OF.LYMPH.NODES'
| nPatients | Mean (Std.Dev) | |
|---|---|---|
| ALL | 105 | 4.3 (6.1) |
| subtype1 | 36 | 5.5 (5.6) |
| subtype2 | 37 | 2.6 (4.9) |
| subtype3 | 32 | 4.8 (7.4) |
Figure S44. Get High-res Image Clustering Approach #4: 'RNAseq cHierClus subtypes' versus Clinical Feature #11: 'NUMBER.OF.LYMPH.NODES'
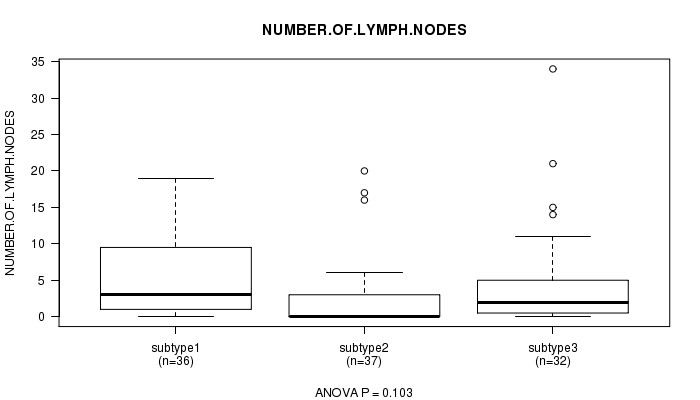
Table S49. Get Full Table Description of clustering approach #5: 'MIRSEQ CNMF'
| Cluster Labels | 1 | 2 | 3 |
|---|---|---|---|
| Number of samples | 81 | 39 | 47 |
P value = 0.75 (logrank test), Q value = 1
Table S50. Clustering Approach #5: 'MIRSEQ CNMF' versus Clinical Feature #1: 'Time to Death'
| nPatients | nDeath | Duration Range (Median), Month | |
|---|---|---|---|
| ALL | 130 | 18 | 0.1 - 72.2 (1.5) |
| subtype1 | 60 | 11 | 0.1 - 70.1 (2.5) |
| subtype2 | 32 | 3 | 0.1 - 59.0 (1.3) |
| subtype3 | 38 | 4 | 0.1 - 72.2 (1.3) |
Figure S45. Get High-res Image Clustering Approach #5: 'MIRSEQ CNMF' versus Clinical Feature #1: 'Time to Death'
P value = 0.00956 (ANOVA), Q value = 0.55
Table S51. Clustering Approach #5: 'MIRSEQ CNMF' versus Clinical Feature #2: 'AGE'
| nPatients | Mean (Std.Dev) | |
|---|---|---|
| ALL | 160 | 67.5 (10.7) |
| subtype1 | 80 | 68.7 (10.5) |
| subtype2 | 39 | 63.0 (11.2) |
| subtype3 | 41 | 69.3 (9.5) |
Figure S46. Get High-res Image Clustering Approach #5: 'MIRSEQ CNMF' versus Clinical Feature #2: 'AGE'
P value = 0.316 (Fisher's exact test), Q value = 1
Table S52. Clustering Approach #5: 'MIRSEQ CNMF' versus Clinical Feature #3: 'GENDER'
| nPatients | FEMALE | MALE |
|---|---|---|
| ALL | 66 | 101 |
| subtype1 | 37 | 44 |
| subtype2 | 13 | 26 |
| subtype3 | 16 | 31 |
Figure S47. Get High-res Image Clustering Approach #5: 'MIRSEQ CNMF' versus Clinical Feature #3: 'GENDER'
P value = 1.14e-06 (Chi-square test), Q value = 7.6e-05
Table S53. Clustering Approach #5: 'MIRSEQ CNMF' versus Clinical Feature #4: 'HISTOLOGICAL.TYPE'
| nPatients | STOMACH ADENOCARCINOMA DIFFUSE TYPE | STOMACH ADENOCARCINOMA NOT OTHERWISE SPECIFIED (NOS) | STOMACH INTESTINAL ADENOCARCINOMA NOT OTHERWISE SPECIFIED (NOS) | STOMACH INTESTINAL ADENOCARCINOMA MUCINOUS TYPE | STOMACH ADENOCARCINOMA SIGNET RING TYPE | STOMACH ADENOCARCINOMA - DIFFUSE TYPE | STOMACH ADENOCARCINOMA - NOT OTHERWISE SPECIFIED (NOS) | STOMACH INTESTINAL ADENOCARCINOMA - MUCINOUS TYPE | STOMACH INTESTINAL ADENOCARCINOMA - PAPILLARY TYPE | STOMACH INTESTINAL ADENOCARCINOMA - TUBULAR TYPE | STOMACH INTESTINAL ADENOCARCINOMA - TYPE NOT OTHERWISE SPECIFIED (NOS) |
|---|---|---|---|---|---|---|---|---|---|---|---|
| ALL | 6 | 7 | 8 | 2 | 1 | 16 | 73 | 8 | 3 | 10 | 28 |
| subtype1 | 1 | 0 | 2 | 0 | 0 | 8 | 39 | 2 | 0 | 5 | 20 |
| subtype2 | 5 | 0 | 2 | 2 | 0 | 7 | 17 | 2 | 0 | 1 | 2 |
| subtype3 | 0 | 7 | 4 | 0 | 1 | 1 | 17 | 4 | 3 | 4 | 6 |
Figure S48. Get High-res Image Clustering Approach #5: 'MIRSEQ CNMF' versus Clinical Feature #4: 'HISTOLOGICAL.TYPE'
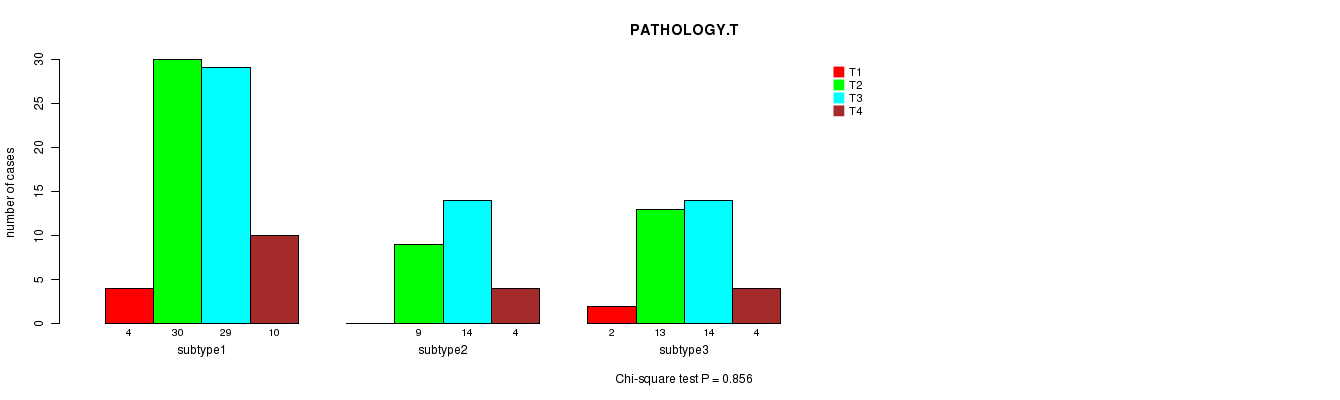
P value = 0.856 (Chi-square test), Q value = 1
Table S54. Clustering Approach #5: 'MIRSEQ CNMF' versus Clinical Feature #5: 'PATHOLOGY.T'
| nPatients | T1 | T2 | T3 | T4 |
|---|---|---|---|---|
| ALL | 6 | 52 | 57 | 18 |
| subtype1 | 4 | 30 | 29 | 10 |
| subtype2 | 0 | 9 | 14 | 4 |
| subtype3 | 2 | 13 | 14 | 4 |
Figure S49. Get High-res Image Clustering Approach #5: 'MIRSEQ CNMF' versus Clinical Feature #5: 'PATHOLOGY.T'
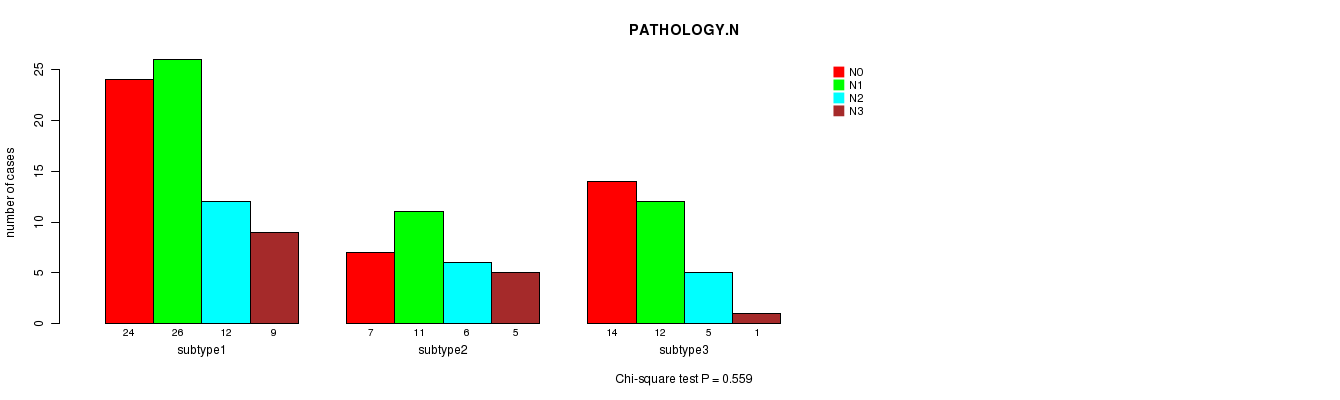
P value = 0.559 (Chi-square test), Q value = 1
Table S55. Clustering Approach #5: 'MIRSEQ CNMF' versus Clinical Feature #6: 'PATHOLOGY.N'
| nPatients | N0 | N1 | N2 | N3 |
|---|---|---|---|---|
| ALL | 45 | 49 | 23 | 15 |
| subtype1 | 24 | 26 | 12 | 9 |
| subtype2 | 7 | 11 | 6 | 5 |
| subtype3 | 14 | 12 | 5 | 1 |
Figure S50. Get High-res Image Clustering Approach #5: 'MIRSEQ CNMF' versus Clinical Feature #6: 'PATHOLOGY.N'
P value = 0.0929 (Chi-square test), Q value = 1
Table S56. Clustering Approach #5: 'MIRSEQ CNMF' versus Clinical Feature #7: 'PATHOLOGICSPREAD(M)'
| nPatients | M0 | M1 | MX |
|---|---|---|---|
| ALL | 119 | 16 | 8 |
| subtype1 | 62 | 13 | 3 |
| subtype2 | 27 | 2 | 1 |
| subtype3 | 30 | 1 | 4 |
Figure S51. Get High-res Image Clustering Approach #5: 'MIRSEQ CNMF' versus Clinical Feature #7: 'PATHOLOGICSPREAD(M)'

P value = 0.443 (Chi-square test), Q value = 1
Table S57. Clustering Approach #5: 'MIRSEQ CNMF' versus Clinical Feature #8: 'TUMOR.STAGE'
| nPatients | I | II | III | IV |
|---|---|---|---|---|
| ALL | 24 | 38 | 39 | 26 |
| subtype1 | 13 | 19 | 21 | 15 |
| subtype2 | 2 | 8 | 11 | 6 |
| subtype3 | 9 | 11 | 7 | 5 |
Figure S52. Get High-res Image Clustering Approach #5: 'MIRSEQ CNMF' versus Clinical Feature #8: 'TUMOR.STAGE'

P value = 0.0192 (Fisher's exact test), Q value = 1
Table S58. Clustering Approach #5: 'MIRSEQ CNMF' versus Clinical Feature #9: 'RADIATIONS.RADIATION.REGIMENINDICATION'
| nPatients | NO | YES |
|---|---|---|
| ALL | 5 | 162 |
| subtype1 | 0 | 81 |
| subtype2 | 1 | 38 |
| subtype3 | 4 | 43 |
Figure S53. Get High-res Image Clustering Approach #5: 'MIRSEQ CNMF' versus Clinical Feature #9: 'RADIATIONS.RADIATION.REGIMENINDICATION'
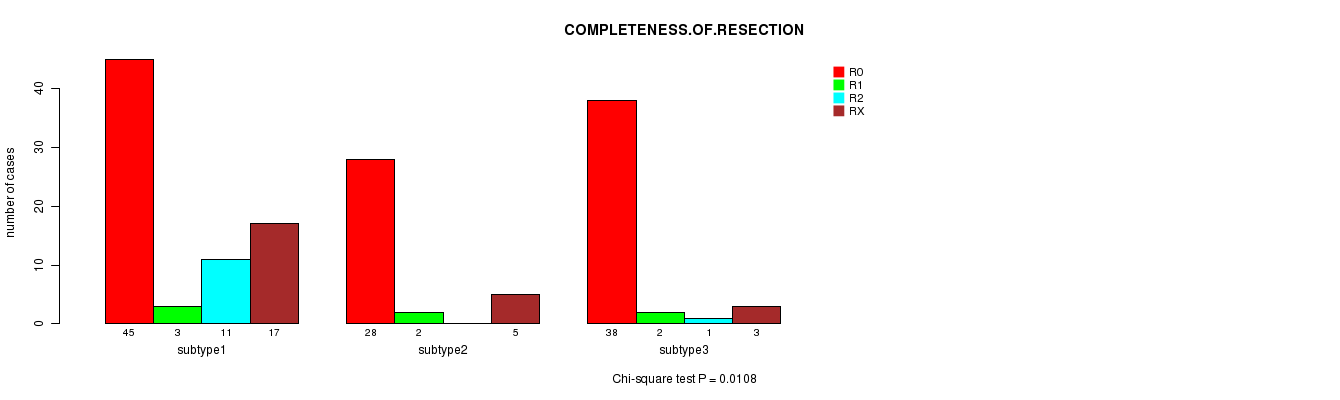
P value = 0.0108 (Chi-square test), Q value = 0.62
Table S59. Clustering Approach #5: 'MIRSEQ CNMF' versus Clinical Feature #10: 'COMPLETENESS.OF.RESECTION'
| nPatients | R0 | R1 | R2 | RX |
|---|---|---|---|---|
| ALL | 111 | 7 | 12 | 25 |
| subtype1 | 45 | 3 | 11 | 17 |
| subtype2 | 28 | 2 | 0 | 5 |
| subtype3 | 38 | 2 | 1 | 3 |
Figure S54. Get High-res Image Clustering Approach #5: 'MIRSEQ CNMF' versus Clinical Feature #10: 'COMPLETENESS.OF.RESECTION'
P value = 0.0156 (ANOVA), Q value = 0.84
Table S60. Clustering Approach #5: 'MIRSEQ CNMF' versus Clinical Feature #11: 'NUMBER.OF.LYMPH.NODES'
| nPatients | Mean (Std.Dev) | |
|---|---|---|
| ALL | 122 | 4.2 (5.8) |
| subtype1 | 49 | 4.5 (7.0) |
| subtype2 | 34 | 6.0 (5.5) |
| subtype3 | 39 | 2.2 (3.4) |
Figure S55. Get High-res Image Clustering Approach #5: 'MIRSEQ CNMF' versus Clinical Feature #11: 'NUMBER.OF.LYMPH.NODES'
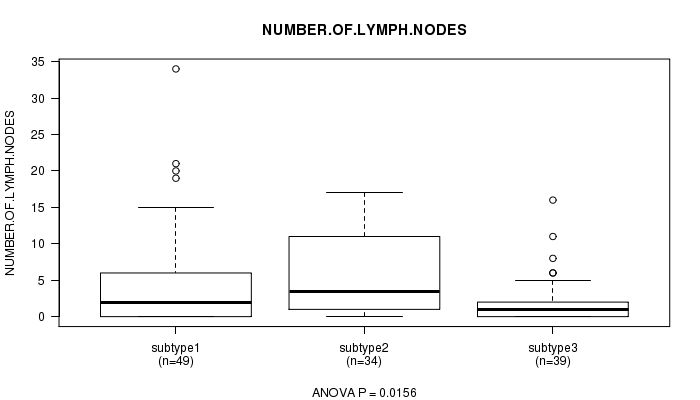
Table S61. Get Full Table Description of clustering approach #6: 'MIRSEQ CHIERARCHICAL'
| Cluster Labels | 1 | 2 | 3 |
|---|---|---|---|
| Number of samples | 38 | 42 | 87 |
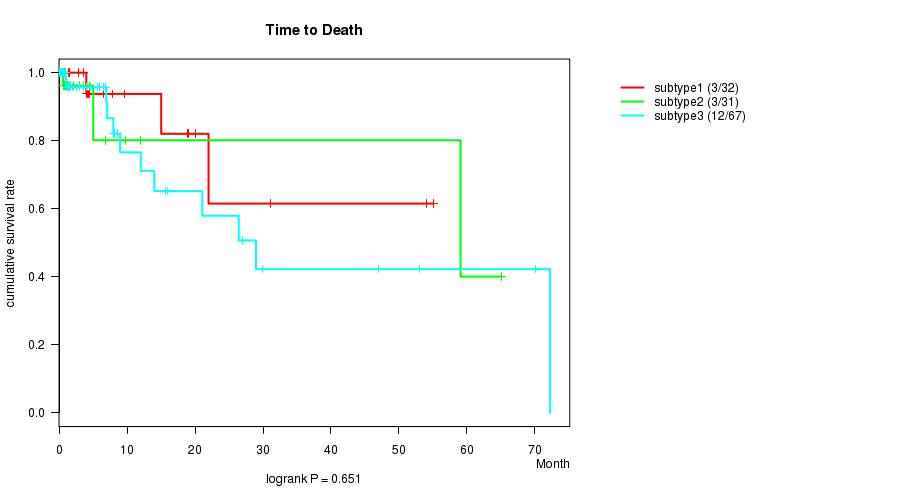
P value = 0.651 (logrank test), Q value = 1
Table S62. Clustering Approach #6: 'MIRSEQ CHIERARCHICAL' versus Clinical Feature #1: 'Time to Death'
| nPatients | nDeath | Duration Range (Median), Month | |
|---|---|---|---|
| ALL | 130 | 18 | 0.1 - 72.2 (1.5) |
| subtype1 | 32 | 3 | 0.3 - 55.0 (3.8) |
| subtype2 | 31 | 3 | 0.1 - 65.1 (1.1) |
| subtype3 | 67 | 12 | 0.1 - 72.2 (1.5) |
Figure S56. Get High-res Image Clustering Approach #6: 'MIRSEQ CHIERARCHICAL' versus Clinical Feature #1: 'Time to Death'
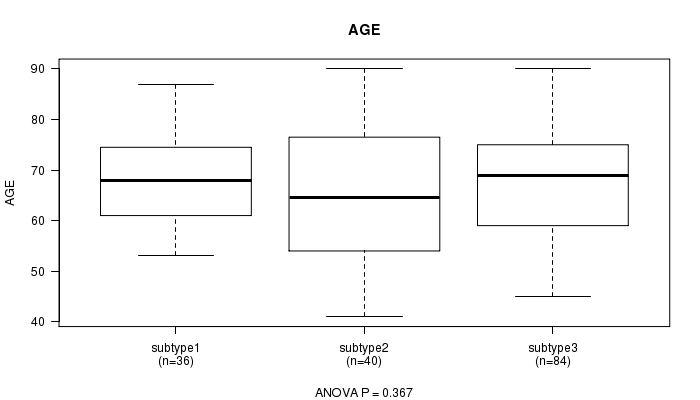
P value = 0.367 (ANOVA), Q value = 1
Table S63. Clustering Approach #6: 'MIRSEQ CHIERARCHICAL' versus Clinical Feature #2: 'AGE'
| nPatients | Mean (Std.Dev) | |
|---|---|---|
| ALL | 160 | 67.5 (10.7) |
| subtype1 | 36 | 68.1 (8.7) |
| subtype2 | 40 | 65.4 (13.2) |
| subtype3 | 84 | 68.2 (10.1) |
Figure S57. Get High-res Image Clustering Approach #6: 'MIRSEQ CHIERARCHICAL' versus Clinical Feature #2: 'AGE'
P value = 0.955 (Fisher's exact test), Q value = 1
Table S64. Clustering Approach #6: 'MIRSEQ CHIERARCHICAL' versus Clinical Feature #3: 'GENDER'
| nPatients | FEMALE | MALE |
|---|---|---|
| ALL | 66 | 101 |
| subtype1 | 14 | 24 |
| subtype2 | 17 | 25 |
| subtype3 | 35 | 52 |
Figure S58. Get High-res Image Clustering Approach #6: 'MIRSEQ CHIERARCHICAL' versus Clinical Feature #3: 'GENDER'

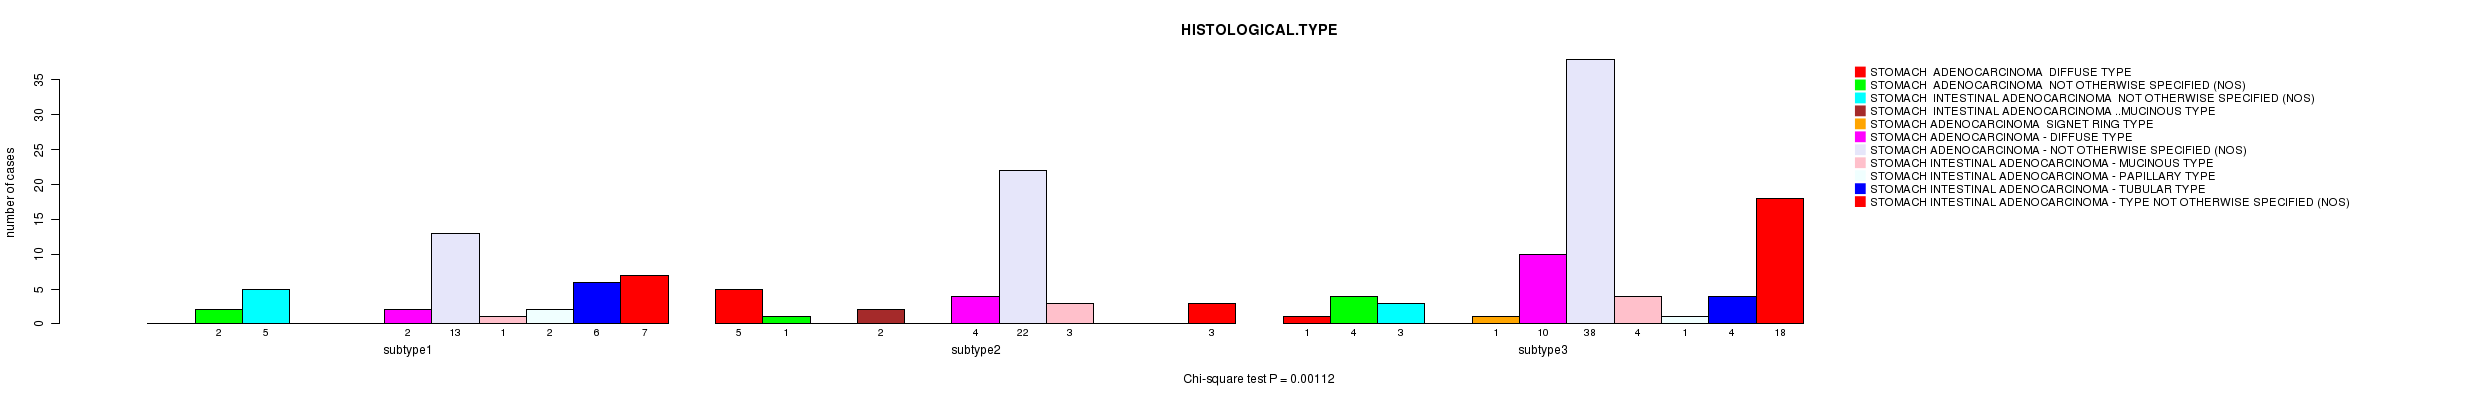
P value = 0.00112 (Chi-square test), Q value = 0.071
Table S65. Clustering Approach #6: 'MIRSEQ CHIERARCHICAL' versus Clinical Feature #4: 'HISTOLOGICAL.TYPE'
| nPatients | STOMACH ADENOCARCINOMA DIFFUSE TYPE | STOMACH ADENOCARCINOMA NOT OTHERWISE SPECIFIED (NOS) | STOMACH INTESTINAL ADENOCARCINOMA NOT OTHERWISE SPECIFIED (NOS) | STOMACH INTESTINAL ADENOCARCINOMA MUCINOUS TYPE | STOMACH ADENOCARCINOMA SIGNET RING TYPE | STOMACH ADENOCARCINOMA - DIFFUSE TYPE | STOMACH ADENOCARCINOMA - NOT OTHERWISE SPECIFIED (NOS) | STOMACH INTESTINAL ADENOCARCINOMA - MUCINOUS TYPE | STOMACH INTESTINAL ADENOCARCINOMA - PAPILLARY TYPE | STOMACH INTESTINAL ADENOCARCINOMA - TUBULAR TYPE | STOMACH INTESTINAL ADENOCARCINOMA - TYPE NOT OTHERWISE SPECIFIED (NOS) |
|---|---|---|---|---|---|---|---|---|---|---|---|
| ALL | 6 | 7 | 8 | 2 | 1 | 16 | 73 | 8 | 3 | 10 | 28 |
| subtype1 | 0 | 2 | 5 | 0 | 0 | 2 | 13 | 1 | 2 | 6 | 7 |
| subtype2 | 5 | 1 | 0 | 2 | 0 | 4 | 22 | 3 | 0 | 0 | 3 |
| subtype3 | 1 | 4 | 3 | 0 | 1 | 10 | 38 | 4 | 1 | 4 | 18 |
Figure S59. Get High-res Image Clustering Approach #6: 'MIRSEQ CHIERARCHICAL' versus Clinical Feature #4: 'HISTOLOGICAL.TYPE'
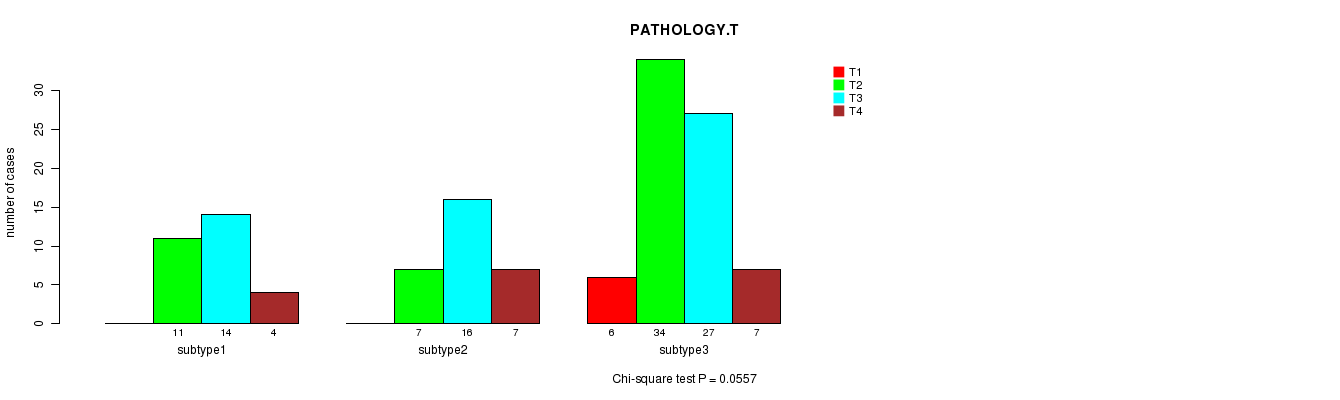
P value = 0.0557 (Chi-square test), Q value = 1
Table S66. Clustering Approach #6: 'MIRSEQ CHIERARCHICAL' versus Clinical Feature #5: 'PATHOLOGY.T'
| nPatients | T1 | T2 | T3 | T4 |
|---|---|---|---|---|
| ALL | 6 | 52 | 57 | 18 |
| subtype1 | 0 | 11 | 14 | 4 |
| subtype2 | 0 | 7 | 16 | 7 |
| subtype3 | 6 | 34 | 27 | 7 |
Figure S60. Get High-res Image Clustering Approach #6: 'MIRSEQ CHIERARCHICAL' versus Clinical Feature #5: 'PATHOLOGY.T'
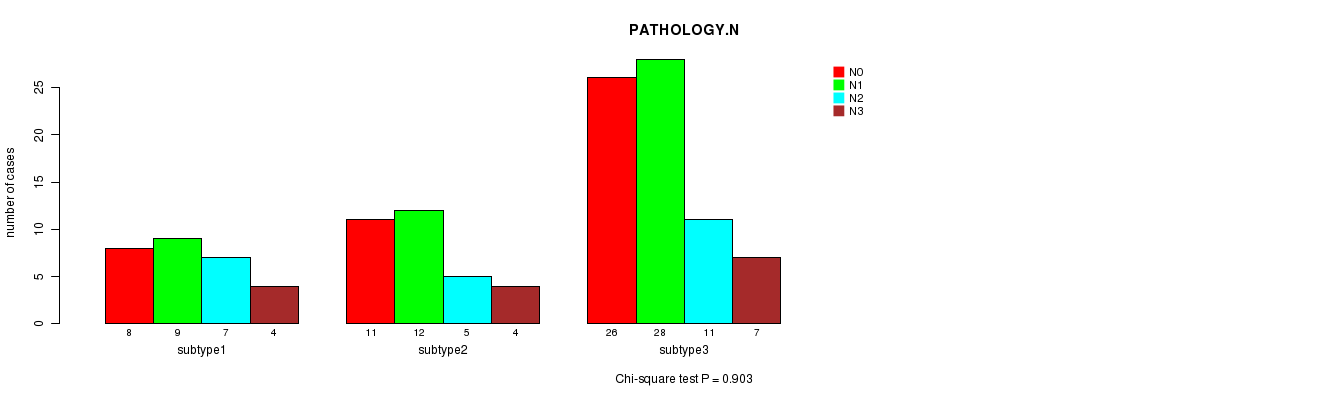
P value = 0.903 (Chi-square test), Q value = 1
Table S67. Clustering Approach #6: 'MIRSEQ CHIERARCHICAL' versus Clinical Feature #6: 'PATHOLOGY.N'
| nPatients | N0 | N1 | N2 | N3 |
|---|---|---|---|---|
| ALL | 45 | 49 | 23 | 15 |
| subtype1 | 8 | 9 | 7 | 4 |
| subtype2 | 11 | 12 | 5 | 4 |
| subtype3 | 26 | 28 | 11 | 7 |
Figure S61. Get High-res Image Clustering Approach #6: 'MIRSEQ CHIERARCHICAL' versus Clinical Feature #6: 'PATHOLOGY.N'
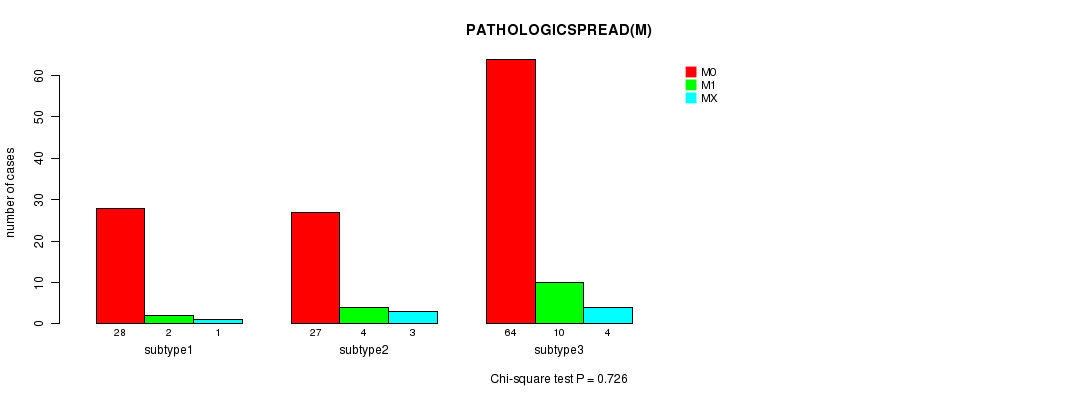
P value = 0.726 (Chi-square test), Q value = 1
Table S68. Clustering Approach #6: 'MIRSEQ CHIERARCHICAL' versus Clinical Feature #7: 'PATHOLOGICSPREAD(M)'
| nPatients | M0 | M1 | MX |
|---|---|---|---|
| ALL | 119 | 16 | 8 |
| subtype1 | 28 | 2 | 1 |
| subtype2 | 27 | 4 | 3 |
| subtype3 | 64 | 10 | 4 |
Figure S62. Get High-res Image Clustering Approach #6: 'MIRSEQ CHIERARCHICAL' versus Clinical Feature #7: 'PATHOLOGICSPREAD(M)'
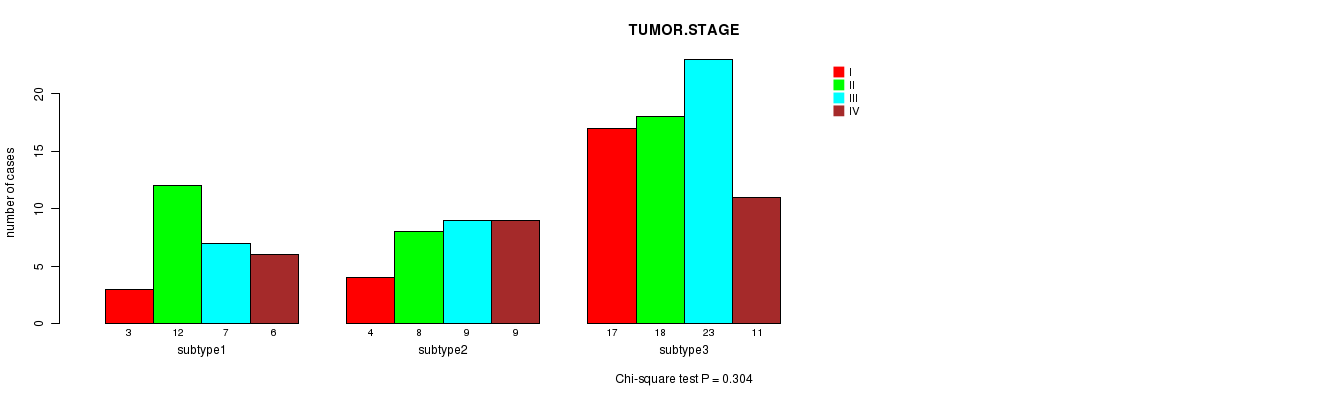
P value = 0.304 (Chi-square test), Q value = 1
Table S69. Clustering Approach #6: 'MIRSEQ CHIERARCHICAL' versus Clinical Feature #8: 'TUMOR.STAGE'
| nPatients | I | II | III | IV |
|---|---|---|---|---|
| ALL | 24 | 38 | 39 | 26 |
| subtype1 | 3 | 12 | 7 | 6 |
| subtype2 | 4 | 8 | 9 | 9 |
| subtype3 | 17 | 18 | 23 | 11 |
Figure S63. Get High-res Image Clustering Approach #6: 'MIRSEQ CHIERARCHICAL' versus Clinical Feature #8: 'TUMOR.STAGE'
P value = 0.268 (Fisher's exact test), Q value = 1
Table S70. Clustering Approach #6: 'MIRSEQ CHIERARCHICAL' versus Clinical Feature #9: 'RADIATIONS.RADIATION.REGIMENINDICATION'
| nPatients | NO | YES |
|---|---|---|
| ALL | 5 | 162 |
| subtype1 | 2 | 36 |
| subtype2 | 2 | 40 |
| subtype3 | 1 | 86 |
Figure S64. Get High-res Image Clustering Approach #6: 'MIRSEQ CHIERARCHICAL' versus Clinical Feature #9: 'RADIATIONS.RADIATION.REGIMENINDICATION'
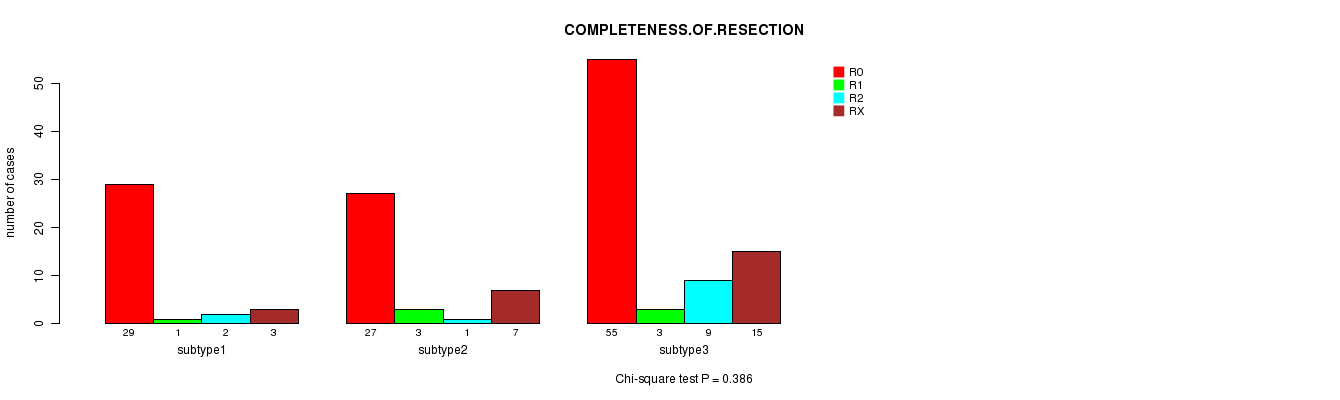
P value = 0.386 (Chi-square test), Q value = 1
Table S71. Clustering Approach #6: 'MIRSEQ CHIERARCHICAL' versus Clinical Feature #10: 'COMPLETENESS.OF.RESECTION'
| nPatients | R0 | R1 | R2 | RX |
|---|---|---|---|---|
| ALL | 111 | 7 | 12 | 25 |
| subtype1 | 29 | 1 | 2 | 3 |
| subtype2 | 27 | 3 | 1 | 7 |
| subtype3 | 55 | 3 | 9 | 15 |
Figure S65. Get High-res Image Clustering Approach #6: 'MIRSEQ CHIERARCHICAL' versus Clinical Feature #10: 'COMPLETENESS.OF.RESECTION'
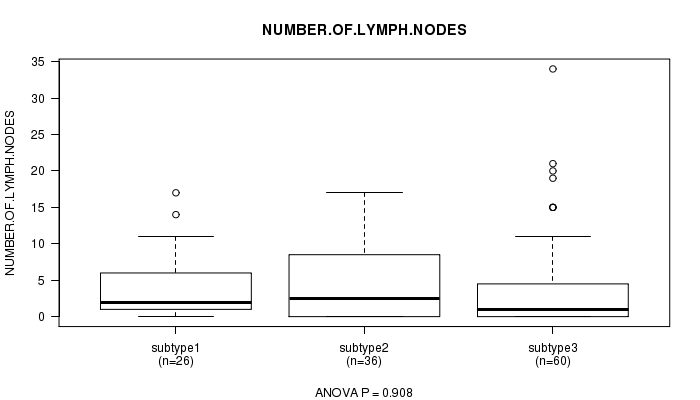
P value = 0.908 (ANOVA), Q value = 1
Table S72. Clustering Approach #6: 'MIRSEQ CHIERARCHICAL' versus Clinical Feature #11: 'NUMBER.OF.LYMPH.NODES'
| nPatients | Mean (Std.Dev) | |
|---|---|---|
| ALL | 122 | 4.2 (5.8) |
| subtype1 | 26 | 4.1 (4.6) |
| subtype2 | 36 | 4.5 (5.1) |
| subtype3 | 60 | 4.0 (6.7) |
Figure S66. Get High-res Image Clustering Approach #6: 'MIRSEQ CHIERARCHICAL' versus Clinical Feature #11: 'NUMBER.OF.LYMPH.NODES'
-
Cluster data file = STAD-TP.mergedcluster.txt
-
Clinical data file = STAD-TP.clin.merged.picked.txt
-
Number of patients = 181
-
Number of clustering approaches = 6
-
Number of selected clinical features = 11
-
Exclude small clusters that include fewer than K patients, K = 3
consensus non-negative matrix factorization clustering approach (Brunet et al. 2004)
Resampling-based clustering method (Monti et al. 2003)
For survival clinical features, the Kaplan-Meier survival curves of tumors with and without gene mutations were plotted and the statistical significance P values were estimated by logrank test (Bland and Altman 2004) using the 'survdiff' function in R
For continuous numerical clinical features, one-way analysis of variance (Howell 2002) was applied to compare the clinical values between tumor subtypes using 'anova' function in R
For binary clinical features, two-tailed Fisher's exact tests (Fisher 1922) were used to estimate the P values using the 'fisher.test' function in R
For multi-class clinical features (nominal or ordinal), Chi-square tests (Greenwood and Nikulin 1996) were used to estimate the P values using the 'chisq.test' function in R
For multiple hypothesis correction, Q value is the False Discovery Rate (FDR) analogue of the P value (Benjamini and Hochberg 1995), defined as the minimum FDR at which the test may be called significant. We used the 'Benjamini and Hochberg' method of 'p.adjust' function in R to convert P values into Q values.
This is an experimental feature. The full results of the analysis summarized in this report can be downloaded from the TCGA Data Coordination Center.