This pipeline computes the correlation between significantly recurrent gene mutations and selected clinical features.
Testing the association between mutation status of 47 genes and 10 clinical features across 116 patients, 6 significant findings detected with Q value < 0.25.
-
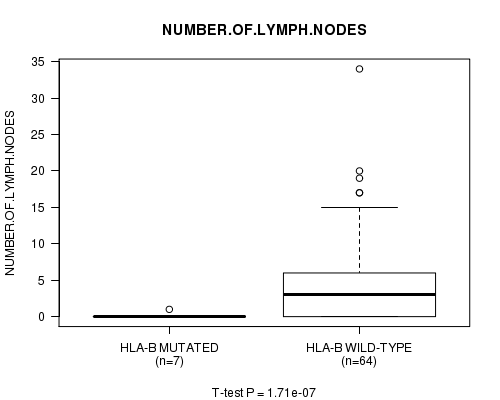
HLA-B mutation correlated to 'NUMBER.OF.LYMPH.NODES'.
-
POTEG mutation correlated to 'NUMBER.OF.LYMPH.NODES'.
-
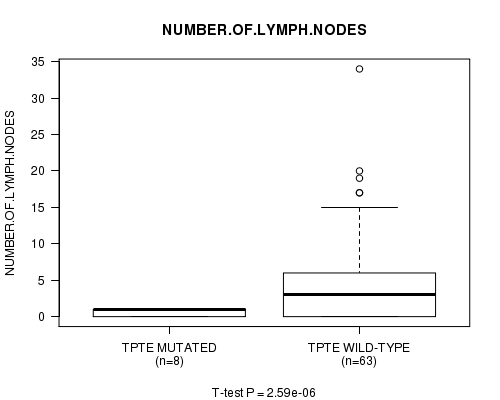
TPTE mutation correlated to 'NUMBER.OF.LYMPH.NODES'.
-
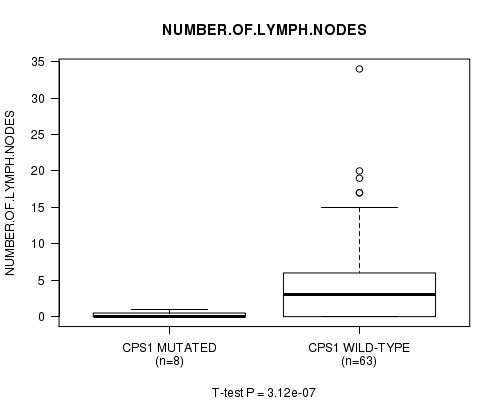
CPS1 mutation correlated to 'NUMBER.OF.LYMPH.NODES'.
-
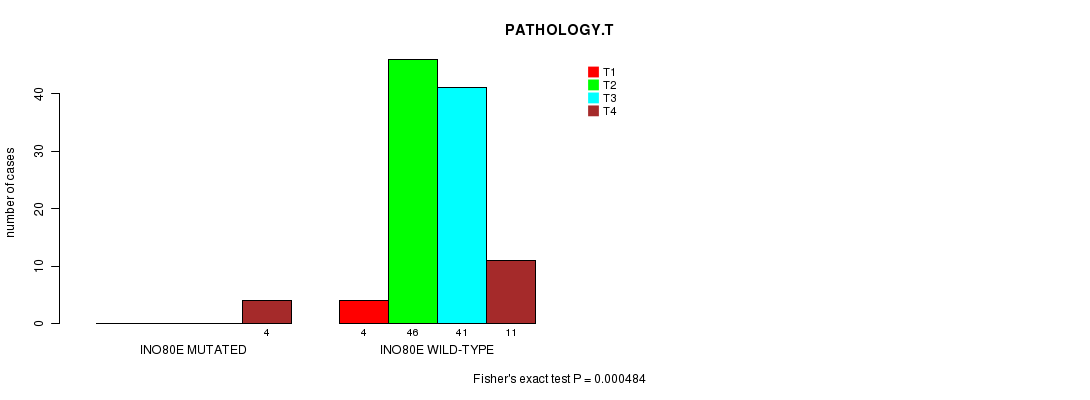
INO80E mutation correlated to 'PATHOLOGY.T'.
-
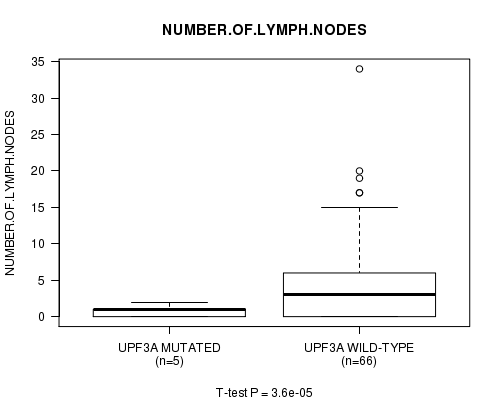
UPF3A mutation correlated to 'NUMBER.OF.LYMPH.NODES'.
Table 1. Get Full Table Overview of the association between mutation status of 47 genes and 10 clinical features. Shown in the table are P values (Q values). Thresholded by Q value < 0.25, 6 significant findings detected.
|
Clinical Features |
Time to Death |
AGE | GENDER |
HISTOLOGICAL TYPE |
PATHOLOGY T |
PATHOLOGY N |
PATHOLOGICSPREAD(M) |
TUMOR STAGE |
COMPLETENESS OF RESECTION |
NUMBER OF LYMPH NODES |
||
| nMutated (%) | nWild-Type | logrank test | t-test | Fisher's exact test | Chi-square test | Fisher's exact test | Fisher's exact test | Fisher's exact test | Fisher's exact test | Fisher's exact test | t-test | |
| HLA-B | 9 (8%) | 107 |
0.963 (1.00) |
0.717 (1.00) |
0.028 (1.00) |
0.556 (1.00) |
0.126 (1.00) |
0.111 (1.00) |
0.329 (1.00) |
0.303 (1.00) |
0.916 (1.00) |
1.71e-07 (7.78e-05) |
| POTEG | 6 (5%) | 110 |
0.221 (1.00) |
0.0101 (1.00) |
0.68 (1.00) |
0.568 (1.00) |
0.643 (1.00) |
0.683 (1.00) |
1 (1.00) |
0.806 (1.00) |
0.309 (1.00) |
3.6e-05 (0.0163) |
| TPTE | 14 (12%) | 102 |
0.382 (1.00) |
0.92 (1.00) |
0.401 (1.00) |
0.00396 (1.00) |
0.283 (1.00) |
0.263 (1.00) |
0.505 (1.00) |
0.974 (1.00) |
0.58 (1.00) |
2.59e-06 (0.00118) |
| CPS1 | 13 (11%) | 103 |
0.862 (1.00) |
0.922 (1.00) |
0.24 (1.00) |
0.471 (1.00) |
0.608 (1.00) |
0.526 (1.00) |
0.202 (1.00) |
0.943 (1.00) |
0.233 (1.00) |
3.12e-07 (0.000142) |
| INO80E | 5 (4%) | 111 |
0.936 (1.00) |
0.0798 (1.00) |
0.805 (1.00) |
0.000484 (0.218) |
0.913 (1.00) |
0.554 (1.00) |
0.0587 (1.00) |
0.0932 (1.00) |
0.537 (1.00) |
|
| UPF3A | 6 (5%) | 110 |
0.647 (1.00) |
0.253 (1.00) |
0.68 (1.00) |
0.86 (1.00) |
0.00203 (0.906) |
0.789 (1.00) |
0.21 (1.00) |
0.244 (1.00) |
0.511 (1.00) |
3.6e-05 (0.0163) |
| CBWD1 | 14 (12%) | 102 |
0.303 (1.00) |
0.0229 (1.00) |
0.243 (1.00) |
0.312 (1.00) |
0.000583 (0.262) |
0.692 (1.00) |
0.505 (1.00) |
0.264 (1.00) |
0.541 (1.00) |
0.036 (1.00) |
| KRAS | 14 (12%) | 102 |
0.353 (1.00) |
0.496 (1.00) |
0.243 (1.00) |
0.701 (1.00) |
0.8 (1.00) |
0.348 (1.00) |
0.623 (1.00) |
0.41 (1.00) |
0.0502 (1.00) |
0.147 (1.00) |
| PGM5 | 16 (14%) | 100 |
0.962 (1.00) |
0.00184 (0.821) |
0.0138 (1.00) |
0.495 (1.00) |
0.00445 (1.00) |
0.898 (1.00) |
0.555 (1.00) |
0.381 (1.00) |
0.45 (1.00) |
0.773 (1.00) |
| RPL22 | 9 (8%) | 107 |
0.478 (1.00) |
0.0449 (1.00) |
0.48 (1.00) |
0.591 (1.00) |
0.0528 (1.00) |
0.303 (1.00) |
0.000925 (0.415) |
0.099 (1.00) |
0.107 (1.00) |
0.00755 (1.00) |
| TP53 | 52 (45%) | 64 |
0.0826 (1.00) |
0.519 (1.00) |
0.345 (1.00) |
0.0205 (1.00) |
0.754 (1.00) |
0.975 (1.00) |
0.123 (1.00) |
0.747 (1.00) |
0.376 (1.00) |
0.888 (1.00) |
| TRIM48 | 10 (9%) | 106 |
0.322 (1.00) |
0.157 (1.00) |
0.191 (1.00) |
0.448 (1.00) |
0.0924 (1.00) |
0.698 (1.00) |
0.0506 (1.00) |
0.241 (1.00) |
0.0335 (1.00) |
0.022 (1.00) |
| XPOT | 6 (5%) | 110 |
0.238 (1.00) |
0.68 (1.00) |
0.812 (1.00) |
1 (1.00) |
0.646 (1.00) |
0.114 (1.00) |
0.489 (1.00) |
0.25 (1.00) |
||
| PIK3CA | 24 (21%) | 92 |
0.407 (1.00) |
0.457 (1.00) |
0.253 (1.00) |
0.789 (1.00) |
0.669 (1.00) |
0.655 (1.00) |
1 (1.00) |
0.375 (1.00) |
0.324 (1.00) |
0.544 (1.00) |
| ACVR2A | 13 (11%) | 103 |
0.00155 (0.693) |
0.218 (1.00) |
0.131 (1.00) |
0.263 (1.00) |
0.128 (1.00) |
0.881 (1.00) |
0.371 (1.00) |
0.414 (1.00) |
0.342 (1.00) |
0.012 (1.00) |
| RHOA | 7 (6%) | 109 |
0.0968 (1.00) |
0.0615 (1.00) |
0.701 (1.00) |
0.451 (1.00) |
0.559 (1.00) |
0.765 (1.00) |
0.681 (1.00) |
0.157 (1.00) |
1 (1.00) |
0.679 (1.00) |
| ARID1A | 22 (19%) | 94 |
0.225 (1.00) |
0.814 (1.00) |
0.0525 (1.00) |
0.298 (1.00) |
0.114 (1.00) |
0.422 (1.00) |
0.0193 (1.00) |
0.168 (1.00) |
0.0325 (1.00) |
0.77 (1.00) |
| OR8H3 | 10 (9%) | 106 |
0.626 (1.00) |
0.424 (1.00) |
0.738 (1.00) |
0.0783 (1.00) |
0.774 (1.00) |
0.113 (1.00) |
0.724 (1.00) |
0.688 (1.00) |
0.0919 (1.00) |
0.444 (1.00) |
| EDNRB | 12 (10%) | 104 |
0.877 (1.00) |
0.831 (1.00) |
0.537 (1.00) |
0.365 (1.00) |
0.233 (1.00) |
0.339 (1.00) |
0.451 (1.00) |
0.885 (1.00) |
0.283 (1.00) |
0.786 (1.00) |
| ZNF804B | 18 (16%) | 98 |
0.909 (1.00) |
0.267 (1.00) |
0.61 (1.00) |
0.416 (1.00) |
1 (1.00) |
0.13 (1.00) |
0.382 (1.00) |
0.0243 (1.00) |
0.694 (1.00) |
0.985 (1.00) |
| IRF2 | 8 (7%) | 108 |
0.74 (1.00) |
0.234 (1.00) |
0.0568 (1.00) |
0.762 (1.00) |
0.0166 (1.00) |
0.873 (1.00) |
0.288 (1.00) |
0.928 (1.00) |
0.0937 (1.00) |
0.135 (1.00) |
| IAPP | 4 (3%) | 112 |
0.485 (1.00) |
1 (1.00) |
0.937 (1.00) |
1 (1.00) |
0.897 (1.00) |
0.189 (1.00) |
0.107 (1.00) |
0.647 (1.00) |
0.0298 (1.00) |
|
| PCDH15 | 22 (19%) | 94 |
0.855 (1.00) |
0.534 (1.00) |
0.63 (1.00) |
0.878 (1.00) |
0.407 (1.00) |
0.757 (1.00) |
0.649 (1.00) |
0.222 (1.00) |
0.921 (1.00) |
0.39 (1.00) |
| SPRYD5 | 8 (7%) | 108 |
0.143 (1.00) |
0.135 (1.00) |
1 (1.00) |
0.904 (1.00) |
0.0528 (1.00) |
0.765 (1.00) |
0.103 (1.00) |
0.0411 (1.00) |
0.538 (1.00) |
0.492 (1.00) |
| TUSC3 | 9 (8%) | 107 |
0.76 (1.00) |
0.28 (1.00) |
1 (1.00) |
0.783 (1.00) |
0.46 (1.00) |
0.488 (1.00) |
0.329 (1.00) |
0.551 (1.00) |
0.632 (1.00) |
0.222 (1.00) |
| FGF22 | 3 (3%) | 113 |
0.0539 (1.00) |
0.562 (1.00) |
0.712 (1.00) |
0.381 (1.00) |
0.382 (1.00) |
|||||
| PTH2 | 3 (3%) | 113 |
0.782 (1.00) |
0.562 (1.00) |
0.775 (1.00) |
0.78 (1.00) |
0.377 (1.00) |
1 (1.00) |
0.687 (1.00) |
0.737 (1.00) |
0.273 (1.00) |
|
| C17ORF63 | 3 (3%) | 113 |
0.524 (1.00) |
0.562 (1.00) |
0.836 (1.00) |
0.121 (1.00) |
0.437 (1.00) |
1 (1.00) |
0.532 (1.00) |
1 (1.00) |
||
| SMAD4 | 7 (6%) | 109 |
0.103 (1.00) |
0.051 (1.00) |
0.701 (1.00) |
0.663 (1.00) |
0.9 (1.00) |
1 (1.00) |
0.153 (1.00) |
1 (1.00) |
0.0935 (1.00) |
0.0418 (1.00) |
| RNF43 | 13 (11%) | 103 |
0.0257 (1.00) |
0.0612 (1.00) |
0.368 (1.00) |
0.151 (1.00) |
0.062 (1.00) |
0.881 (1.00) |
0.484 (1.00) |
0.185 (1.00) |
0.233 (1.00) |
0.14 (1.00) |
| WBSCR17 | 12 (10%) | 104 |
0.116 (1.00) |
0.185 (1.00) |
0.537 (1.00) |
0.281 (1.00) |
0.419 (1.00) |
0.965 (1.00) |
0.333 (1.00) |
0.835 (1.00) |
0.893 (1.00) |
0.00345 (1.00) |
| PHF2 | 12 (10%) | 104 |
0.905 (1.00) |
0.017 (1.00) |
0.537 (1.00) |
0.403 (1.00) |
0.0106 (1.00) |
0.6 (1.00) |
0.00397 (1.00) |
0.118 (1.00) |
0.308 (1.00) |
0.00906 (1.00) |
| CDH1 | 11 (9%) | 105 |
0.516 (1.00) |
0.137 (1.00) |
0.751 (1.00) |
0.116 (1.00) |
0.565 (1.00) |
0.79 (1.00) |
1 (1.00) |
0.134 (1.00) |
0.309 (1.00) |
0.565 (1.00) |
| ELF3 | 5 (4%) | 111 |
0.541 (1.00) |
0.701 (1.00) |
0.384 (1.00) |
0.402 (1.00) |
0.366 (1.00) |
0.623 (1.00) |
1 (1.00) |
0.928 (1.00) |
1 (1.00) |
0.0887 (1.00) |
| PARK2 | 9 (8%) | 107 |
0.73 (1.00) |
0.00874 (1.00) |
1 (1.00) |
0.109 (1.00) |
0.292 (1.00) |
0.351 (1.00) |
0.329 (1.00) |
0.199 (1.00) |
0.916 (1.00) |
0.00642 (1.00) |
| LARP4B | 5 (4%) | 111 |
0.541 (1.00) |
0.445 (1.00) |
0.384 (1.00) |
0.402 (1.00) |
0.0286 (1.00) |
0.897 (1.00) |
1 (1.00) |
0.489 (1.00) |
0.836 (1.00) |
0.221 (1.00) |
| OR6K3 | 6 (5%) | 110 |
0.63 (1.00) |
0.436 (1.00) |
0.212 (1.00) |
0.153 (1.00) |
0.322 (1.00) |
1 (1.00) |
0.309 (1.00) |
0.147 (1.00) |
0.36 (1.00) |
0.874 (1.00) |
| TM7SF4 | 7 (6%) | 109 |
0.915 (1.00) |
0.553 (1.00) |
0.701 (1.00) |
0.855 (1.00) |
0.619 (1.00) |
0.847 (1.00) |
1 (1.00) |
0.676 (1.00) |
1 (1.00) |
0.281 (1.00) |
| C7ORF63 | 5 (4%) | 111 |
0.471 (1.00) |
0.42 (1.00) |
0.0798 (1.00) |
0.322 (1.00) |
0.0223 (1.00) |
0.646 (1.00) |
0.155 (1.00) |
0.587 (1.00) |
0.0773 (1.00) |
|
| KDM4B | 10 (9%) | 106 |
0.81 (1.00) |
0.0778 (1.00) |
0.0136 (1.00) |
0.435 (1.00) |
0.126 (1.00) |
0.847 (1.00) |
0.369 (1.00) |
0.512 (1.00) |
0.189 (1.00) |
0.316 (1.00) |
| KIAA0748 | 7 (6%) | 109 |
0.337 (1.00) |
0.375 (1.00) |
1 (1.00) |
0.735 (1.00) |
0.699 (1.00) |
0.568 (1.00) |
1 (1.00) |
0.199 (1.00) |
1 (1.00) |
0.807 (1.00) |
| OR8B4 | 3 (3%) | 113 |
0.541 (1.00) |
0.782 (1.00) |
0.562 (1.00) |
0.389 (1.00) |
0.357 (1.00) |
0.082 (1.00) |
1 (1.00) |
0.292 (1.00) |
0.737 (1.00) |
0.948 (1.00) |
| POM121L12 | 7 (6%) | 109 |
0.943 (1.00) |
0.449 (1.00) |
1 (1.00) |
0.568 (1.00) |
0.106 (1.00) |
0.769 (1.00) |
0.153 (1.00) |
0.38 (1.00) |
0.429 (1.00) |
0.663 (1.00) |
| RASA1 | 9 (8%) | 107 |
0.307 (1.00) |
0.0831 (1.00) |
0.739 (1.00) |
0.216 (1.00) |
0.0242 (1.00) |
0.698 (1.00) |
0.0915 (1.00) |
0.547 (1.00) |
0.216 (1.00) |
0.222 (1.00) |
| SLITRK6 | 10 (9%) | 106 |
0.231 (1.00) |
0.693 (1.00) |
0.738 (1.00) |
0.742 (1.00) |
0.925 (1.00) |
0.619 (1.00) |
0.26 (1.00) |
0.327 (1.00) |
0.41 (1.00) |
0.143 (1.00) |
| TP53TG5 | 4 (3%) | 112 |
0.739 (1.00) |
0.758 (1.00) |
1 (1.00) |
0.048 (1.00) |
0.0655 (1.00) |
0.404 (1.00) |
1 (1.00) |
0.489 (1.00) |
0.785 (1.00) |
|
| LHCGR | 7 (6%) | 109 |
0.863 (1.00) |
0.369 (1.00) |
1 (1.00) |
0.808 (1.00) |
0.0805 (1.00) |
0.442 (1.00) |
0.249 (1.00) |
0.928 (1.00) |
0.174 (1.00) |
0.47 (1.00) |
P value = 1.71e-07 (t-test), Q value = 7.8e-05
Table S1. Gene #21: 'HLA-B MUTATION STATUS' versus Clinical Feature #10: 'NUMBER.OF.LYMPH.NODES'
| nPatients | Mean (Std.Dev) | |
|---|---|---|
| ALL | 71 | 4.5 (6.3) |
| HLA-B MUTATED | 7 | 0.1 (0.4) |
| HLA-B WILD-TYPE | 64 | 5.0 (6.5) |
Figure S1. Get High-res Image Gene #21: 'HLA-B MUTATION STATUS' versus Clinical Feature #10: 'NUMBER.OF.LYMPH.NODES'
P value = 3.6e-05 (t-test), Q value = 0.016
Table S2. Gene #25: 'POTEG MUTATION STATUS' versus Clinical Feature #10: 'NUMBER.OF.LYMPH.NODES'
| nPatients | Mean (Std.Dev) | |
|---|---|---|
| ALL | 71 | 4.5 (6.3) |
| POTEG MUTATED | 5 | 0.8 (0.8) |
| POTEG WILD-TYPE | 66 | 4.8 (6.5) |
Figure S2. Get High-res Image Gene #25: 'POTEG MUTATION STATUS' versus Clinical Feature #10: 'NUMBER.OF.LYMPH.NODES'

P value = 2.59e-06 (t-test), Q value = 0.0012
Table S3. Gene #29: 'TPTE MUTATION STATUS' versus Clinical Feature #10: 'NUMBER.OF.LYMPH.NODES'
| nPatients | Mean (Std.Dev) | |
|---|---|---|
| ALL | 71 | 4.5 (6.3) |
| TPTE MUTATED | 8 | 0.6 (0.5) |
| TPTE WILD-TYPE | 63 | 5.0 (6.6) |
Figure S3. Get High-res Image Gene #29: 'TPTE MUTATION STATUS' versus Clinical Feature #10: 'NUMBER.OF.LYMPH.NODES'
P value = 3.12e-07 (t-test), Q value = 0.00014
Table S4. Gene #31: 'CPS1 MUTATION STATUS' versus Clinical Feature #10: 'NUMBER.OF.LYMPH.NODES'
| nPatients | Mean (Std.Dev) | |
|---|---|---|
| ALL | 71 | 4.5 (6.3) |
| CPS1 MUTATED | 8 | 0.2 (0.5) |
| CPS1 WILD-TYPE | 63 | 5.0 (6.5) |
Figure S4. Get High-res Image Gene #31: 'CPS1 MUTATION STATUS' versus Clinical Feature #10: 'NUMBER.OF.LYMPH.NODES'
P value = 0.000484 (Fisher's exact test), Q value = 0.22
Table S5. Gene #32: 'INO80E MUTATION STATUS' versus Clinical Feature #5: 'PATHOLOGY.T'
| nPatients | T1 | T2 | T3 | T4 |
|---|---|---|---|---|
| ALL | 4 | 46 | 41 | 15 |
| INO80E MUTATED | 0 | 0 | 0 | 4 |
| INO80E WILD-TYPE | 4 | 46 | 41 | 11 |
Figure S5. Get High-res Image Gene #32: 'INO80E MUTATION STATUS' versus Clinical Feature #5: 'PATHOLOGY.T'
P value = 3.6e-05 (t-test), Q value = 0.016
Table S6. Gene #38: 'UPF3A MUTATION STATUS' versus Clinical Feature #10: 'NUMBER.OF.LYMPH.NODES'
| nPatients | Mean (Std.Dev) | |
|---|---|---|
| ALL | 71 | 4.5 (6.3) |
| UPF3A MUTATED | 5 | 0.8 (0.8) |
| UPF3A WILD-TYPE | 66 | 4.8 (6.5) |
Figure S6. Get High-res Image Gene #38: 'UPF3A MUTATION STATUS' versus Clinical Feature #10: 'NUMBER.OF.LYMPH.NODES'
-
Mutation data file = STAD-TP.mutsig.cluster.txt
-
Clinical data file = STAD-TP.clin.merged.picked.txt
-
Number of patients = 116
-
Number of significantly mutated genes = 47
-
Number of selected clinical features = 10
-
Exclude genes that fewer than K tumors have mutations, K = 3
For survival clinical features, the Kaplan-Meier survival curves of tumors with and without gene mutations were plotted and the statistical significance P values were estimated by logrank test (Bland and Altman 2004) using the 'survdiff' function in R
For continuous numerical clinical features, two-tailed Student's t test with unequal variance (Lehmann and Romano 2005) was applied to compare the clinical values between tumors with and without gene mutations using 't.test' function in R
For binary or multi-class clinical features (nominal or ordinal), two-tailed Fisher's exact tests (Fisher 1922) were used to estimate the P values using the 'fisher.test' function in R
For multi-class clinical features (nominal or ordinal), Chi-square tests (Greenwood and Nikulin 1996) were used to estimate the P values using the 'chisq.test' function in R
For multiple hypothesis correction, Q value is the False Discovery Rate (FDR) analogue of the P value (Benjamini and Hochberg 1995), defined as the minimum FDR at which the test may be called significant. We used the 'Benjamini and Hochberg' method of 'p.adjust' function in R to convert P values into Q values.
This is an experimental feature. The full results of the analysis summarized in this report can be downloaded from the TCGA Data Coordination Center.