This pipeline computes the correlation between significantly recurrent gene mutations and molecular subtypes.
Testing the association between mutation status of 47 genes and 6 molecular subtypes across 116 patients, 7 significant findings detected with P value < 0.05 and Q value < 0.25.
-
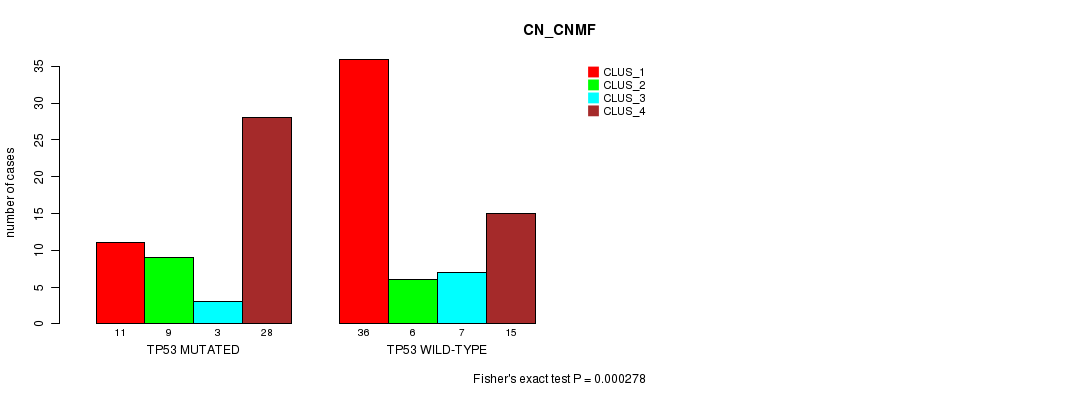
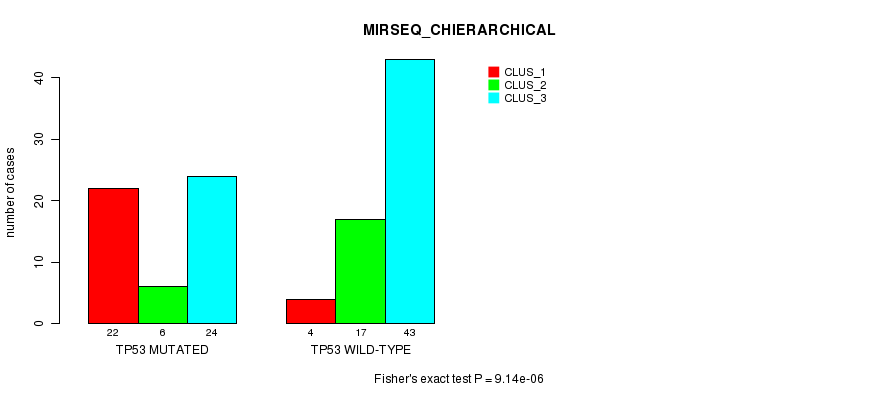
TP53 mutation correlated to 'CN_CNMF' and 'MIRSEQ_CHIERARCHICAL'.
-
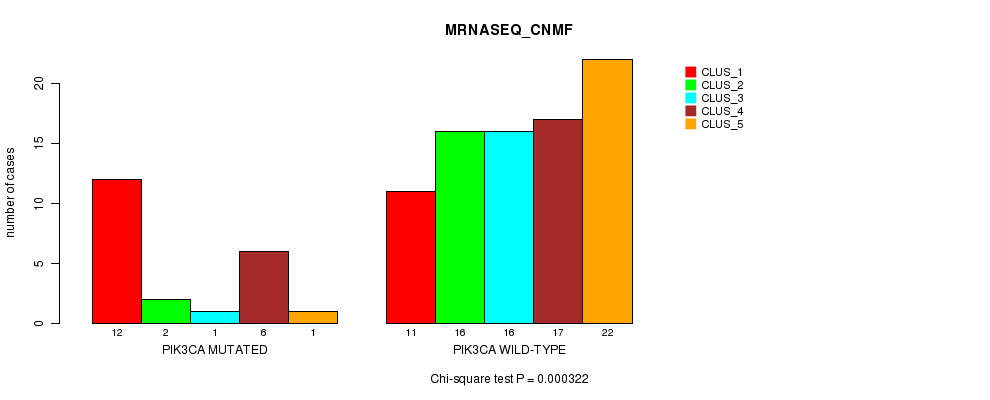
PIK3CA mutation correlated to 'METHLYATION_CNMF' and 'MRNASEQ_CNMF'.
-
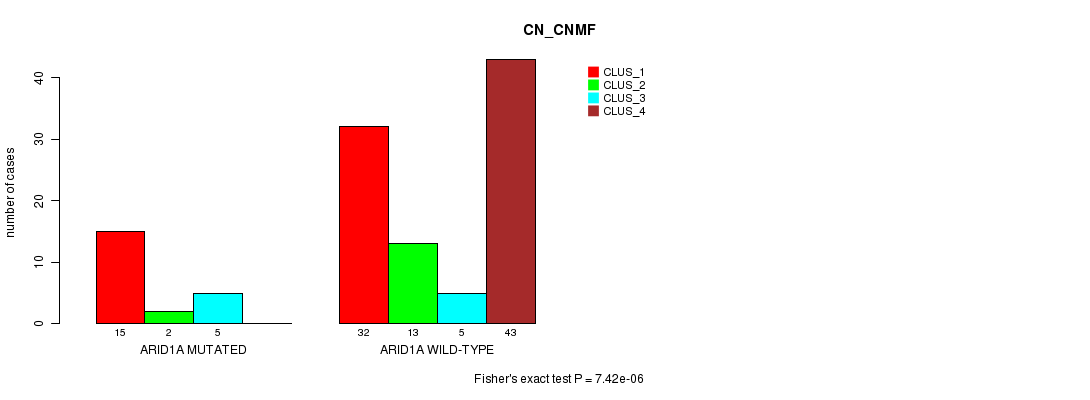
ARID1A mutation correlated to 'CN_CNMF', 'MRNASEQ_CNMF', and 'MIRSEQ_CHIERARCHICAL'.
Table 1. Get Full Table Overview of the association between mutation status of 47 genes and 6 molecular subtypes. Shown in the table are P values (Q values). Thresholded by P value < 0.05 and Q value < 0.25, 7 significant findings detected.
|
Clinical Features |
CN CNMF |
METHLYATION CNMF |
MRNASEQ CNMF |
MRNASEQ CHIERARCHICAL |
MIRSEQ CNMF |
MIRSEQ CHIERARCHICAL |
||
| nMutated (%) | nWild-Type | Fisher's exact test | Fisher's exact test | Chi-square test | Fisher's exact test | Fisher's exact test | Fisher's exact test | |
| ARID1A | 22 (19%) | 94 |
7.42e-06 (0.00201) |
0.00783 (1.00) |
0.000768 (0.204) |
0.154 (1.00) |
0.0203 (1.00) |
0.000551 (0.147) |
| TP53 | 52 (45%) | 64 |
0.000278 (0.0748) |
0.011 (1.00) |
0.0949 (1.00) |
0.0923 (1.00) |
0.00228 (0.599) |
9.14e-06 (0.00247) |
| PIK3CA | 24 (21%) | 92 |
0.00256 (0.669) |
1.26e-06 (0.000344) |
0.000322 (0.0862) |
0.192 (1.00) |
0.0282 (1.00) |
0.0194 (1.00) |
| CBWD1 | 14 (12%) | 102 |
0.0342 (1.00) |
0.0585 (1.00) |
0.00578 (1.00) |
0.132 (1.00) |
0.0482 (1.00) |
0.216 (1.00) |
| KRAS | 14 (12%) | 102 |
0.0906 (1.00) |
0.292 (1.00) |
0.368 (1.00) |
0.0849 (1.00) |
0.685 (1.00) |
0.578 (1.00) |
| PGM5 | 16 (14%) | 100 |
0.0118 (1.00) |
0.00266 (0.694) |
0.192 (1.00) |
0.306 (1.00) |
0.158 (1.00) |
0.222 (1.00) |
| RPL22 | 9 (8%) | 107 |
0.254 (1.00) |
0.123 (1.00) |
0.091 (1.00) |
0.299 (1.00) |
0.152 (1.00) |
|
| TRIM48 | 10 (9%) | 106 |
0.00622 (1.00) |
0.174 (1.00) |
0.0438 (1.00) |
0.16 (1.00) |
0.0839 (1.00) |
0.0155 (1.00) |
| XPOT | 6 (5%) | 110 |
0.0703 (1.00) |
0.0277 (1.00) |
0.373 (1.00) |
0.34 (1.00) |
0.128 (1.00) |
|
| ACVR2A | 13 (11%) | 103 |
0.00214 (0.564) |
0.0128 (1.00) |
0.00158 (0.418) |
0.0808 (1.00) |
0.0253 (1.00) |
0.0203 (1.00) |
| RHOA | 7 (6%) | 109 |
0.354 (1.00) |
0.639 (1.00) |
0.476 (1.00) |
1 (1.00) |
0.0881 (1.00) |
1 (1.00) |
| OR8H3 | 10 (9%) | 106 |
0.0238 (1.00) |
0.0884 (1.00) |
0.0274 (1.00) |
0.572 (1.00) |
0.221 (1.00) |
0.474 (1.00) |
| EDNRB | 12 (10%) | 104 |
0.112 (1.00) |
0.543 (1.00) |
0.868 (1.00) |
0.324 (1.00) |
0.475 (1.00) |
0.588 (1.00) |
| ZNF804B | 18 (16%) | 98 |
0.236 (1.00) |
0.047 (1.00) |
0.0795 (1.00) |
0.00277 (0.719) |
0.0127 (1.00) |
0.274 (1.00) |
| IRF2 | 8 (7%) | 108 |
0.0405 (1.00) |
0.0511 (1.00) |
0.0225 (1.00) |
0.886 (1.00) |
0.176 (1.00) |
0.321 (1.00) |
| IAPP | 4 (3%) | 112 |
0.859 (1.00) |
0.736 (1.00) |
0.455 (1.00) |
0.147 (1.00) |
1 (1.00) |
|
| PCDH15 | 22 (19%) | 94 |
0.634 (1.00) |
0.863 (1.00) |
0.928 (1.00) |
0.439 (1.00) |
0.594 (1.00) |
0.947 (1.00) |
| SPRYD5 | 8 (7%) | 108 |
0.843 (1.00) |
0.0343 (1.00) |
0.441 (1.00) |
0.717 (1.00) |
0.263 (1.00) |
0.687 (1.00) |
| TUSC3 | 9 (8%) | 107 |
0.666 (1.00) |
0.88 (1.00) |
0.968 (1.00) |
1 (1.00) |
1 (1.00) |
0.712 (1.00) |
| FGF22 | 3 (3%) | 113 |
0.0257 (1.00) |
0.028 (1.00) |
0.327 (1.00) |
1 (1.00) |
0.573 (1.00) |
|
| HLA-B | 9 (8%) | 107 |
0.13 (1.00) |
0.00377 (0.977) |
0.123 (1.00) |
0.117 (1.00) |
0.299 (1.00) |
0.636 (1.00) |
| PTH2 | 3 (3%) | 113 |
0.812 (1.00) |
0.302 (1.00) |
0.171 (1.00) |
0.161 (1.00) |
0.155 (1.00) |
0.384 (1.00) |
| C17ORF63 | 3 (3%) | 113 |
0.435 (1.00) |
0.736 (1.00) |
1 (1.00) |
1 (1.00) |
0.773 (1.00) |
|
| SMAD4 | 7 (6%) | 109 |
1 (1.00) |
0.859 (1.00) |
0.186 (1.00) |
0.477 (1.00) |
1 (1.00) |
0.753 (1.00) |
| POTEG | 6 (5%) | 110 |
0.294 (1.00) |
0.48 (1.00) |
0.469 (1.00) |
0.854 (1.00) |
1 (1.00) |
0.375 (1.00) |
| RNF43 | 13 (11%) | 103 |
0.00576 (1.00) |
0.0168 (1.00) |
0.0478 (1.00) |
0.0789 (1.00) |
0.0253 (1.00) |
0.0592 (1.00) |
| WBSCR17 | 12 (10%) | 104 |
0.288 (1.00) |
0.00419 (1.00) |
0.0813 (1.00) |
0.903 (1.00) |
0.0289 (1.00) |
0.412 (1.00) |
| PHF2 | 12 (10%) | 104 |
0.006 (1.00) |
0.0128 (1.00) |
0.00746 (1.00) |
0.0311 (1.00) |
0.0289 (1.00) |
0.00602 (1.00) |
| TPTE | 14 (12%) | 102 |
0.563 (1.00) |
1 (1.00) |
0.464 (1.00) |
0.698 (1.00) |
0.0419 (1.00) |
0.856 (1.00) |
| CDH1 | 11 (9%) | 105 |
0.14 (1.00) |
0.769 (1.00) |
0.0161 (1.00) |
0.121 (1.00) |
0.0919 (1.00) |
0.0862 (1.00) |
| CPS1 | 13 (11%) | 103 |
0.731 (1.00) |
0.223 (1.00) |
0.518 (1.00) |
0.856 (1.00) |
0.906 (1.00) |
0.335 (1.00) |
| INO80E | 5 (4%) | 111 |
0.534 (1.00) |
0.798 (1.00) |
0.713 (1.00) |
0.369 (1.00) |
1 (1.00) |
|
| ELF3 | 5 (4%) | 111 |
0.118 (1.00) |
0.163 (1.00) |
0.263 (1.00) |
0.358 (1.00) |
0.493 (1.00) |
0.221 (1.00) |
| PARK2 | 9 (8%) | 107 |
0.235 (1.00) |
0.0548 (1.00) |
0.306 (1.00) |
0.0219 (1.00) |
0.869 (1.00) |
0.636 (1.00) |
| LARP4B | 5 (4%) | 111 |
0.0339 (1.00) |
0.174 (1.00) |
0.108 (1.00) |
0.358 (1.00) |
0.493 (1.00) |
0.221 (1.00) |
| OR6K3 | 6 (5%) | 110 |
0.347 (1.00) |
0.358 (1.00) |
0.0808 (1.00) |
0.867 (1.00) |
0.434 (1.00) |
1 (1.00) |
| TM7SF4 | 7 (6%) | 109 |
0.931 (1.00) |
0.223 (1.00) |
0.642 (1.00) |
0.782 (1.00) |
0.852 (1.00) |
0.376 (1.00) |
| UPF3A | 6 (5%) | 110 |
0.347 (1.00) |
0.174 (1.00) |
0.0905 (1.00) |
0.231 (1.00) |
0.434 (1.00) |
0.619 (1.00) |
| C7ORF63 | 5 (4%) | 111 |
0.118 (1.00) |
0.108 (1.00) |
0.569 (1.00) |
0.493 (1.00) |
0.697 (1.00) |
|
| KDM4B | 10 (9%) | 106 |
0.0222 (1.00) |
0.0343 (1.00) |
0.211 (1.00) |
0.607 (1.00) |
0.221 (1.00) |
0.53 (1.00) |
| KIAA0748 | 7 (6%) | 109 |
0.776 (1.00) |
0.545 (1.00) |
0.279 (1.00) |
0.473 (1.00) |
0.852 (1.00) |
0.432 (1.00) |
| OR8B4 | 3 (3%) | 113 |
0.155 (1.00) |
0.00894 (1.00) |
1 (1.00) |
0.573 (1.00) |
||
| POM121L12 | 7 (6%) | 109 |
0.0617 (1.00) |
0.122 (1.00) |
0.0988 (1.00) |
0.209 (1.00) |
0.852 (1.00) |
0.376 (1.00) |
| RASA1 | 9 (8%) | 107 |
0.448 (1.00) |
0.551 (1.00) |
0.467 (1.00) |
0.0148 (1.00) |
0.066 (1.00) |
0.314 (1.00) |
| SLITRK6 | 10 (9%) | 106 |
0.258 (1.00) |
0.88 (1.00) |
0.522 (1.00) |
0.717 (1.00) |
0.14 (1.00) |
0.307 (1.00) |
| TP53TG5 | 4 (3%) | 112 |
0.024 (1.00) |
0.736 (1.00) |
1 (1.00) |
1 (1.00) |
0.641 (1.00) |
|
| LHCGR | 7 (6%) | 109 |
1 (1.00) |
0.813 (1.00) |
0.999 (1.00) |
0.713 (1.00) |
0.597 (1.00) |
0.275 (1.00) |
P value = 0.000278 (Fisher's exact test), Q value = 0.075
Table S1. Gene #5: 'TP53 MUTATION STATUS' versus Clinical Feature #1: 'CN_CNMF'
| nPatients | CLUS_1 | CLUS_2 | CLUS_3 | CLUS_4 |
|---|---|---|---|---|
| ALL | 47 | 15 | 10 | 43 |
| TP53 MUTATED | 11 | 9 | 3 | 28 |
| TP53 WILD-TYPE | 36 | 6 | 7 | 15 |
Figure S1. Get High-res Image Gene #5: 'TP53 MUTATION STATUS' versus Clinical Feature #1: 'CN_CNMF'
P value = 9.14e-06 (Fisher's exact test), Q value = 0.0025
Table S2. Gene #5: 'TP53 MUTATION STATUS' versus Clinical Feature #6: 'MIRSEQ_CHIERARCHICAL'
| nPatients | CLUS_1 | CLUS_2 | CLUS_3 |
|---|---|---|---|
| ALL | 26 | 23 | 67 |
| TP53 MUTATED | 22 | 6 | 24 |
| TP53 WILD-TYPE | 4 | 17 | 43 |
Figure S2. Get High-res Image Gene #5: 'TP53 MUTATION STATUS' versus Clinical Feature #6: 'MIRSEQ_CHIERARCHICAL'
P value = 1.26e-06 (Fisher's exact test), Q value = 0.00034
Table S3. Gene #8: 'PIK3CA MUTATION STATUS' versus Clinical Feature #2: 'METHLYATION_CNMF'
| nPatients | CLUS_1 | CLUS_2 | CLUS_3 | CLUS_4 |
|---|---|---|---|---|
| ALL | 9 | 14 | 22 | 23 |
| PIK3CA MUTATED | 9 | 4 | 3 | 2 |
| PIK3CA WILD-TYPE | 0 | 10 | 19 | 21 |
Figure S3. Get High-res Image Gene #8: 'PIK3CA MUTATION STATUS' versus Clinical Feature #2: 'METHLYATION_CNMF'

P value = 0.000322 (Chi-square test), Q value = 0.086
Table S4. Gene #8: 'PIK3CA MUTATION STATUS' versus Clinical Feature #3: 'MRNASEQ_CNMF'
| nPatients | CLUS_1 | CLUS_2 | CLUS_3 | CLUS_4 | CLUS_5 |
|---|---|---|---|---|---|
| ALL | 23 | 18 | 17 | 23 | 23 |
| PIK3CA MUTATED | 12 | 2 | 1 | 6 | 1 |
| PIK3CA WILD-TYPE | 11 | 16 | 16 | 17 | 22 |
Figure S4. Get High-res Image Gene #8: 'PIK3CA MUTATION STATUS' versus Clinical Feature #3: 'MRNASEQ_CNMF'
P value = 7.42e-06 (Fisher's exact test), Q value = 0.002
Table S5. Gene #11: 'ARID1A MUTATION STATUS' versus Clinical Feature #1: 'CN_CNMF'
| nPatients | CLUS_1 | CLUS_2 | CLUS_3 | CLUS_4 |
|---|---|---|---|---|
| ALL | 47 | 15 | 10 | 43 |
| ARID1A MUTATED | 15 | 2 | 5 | 0 |
| ARID1A WILD-TYPE | 32 | 13 | 5 | 43 |
Figure S5. Get High-res Image Gene #11: 'ARID1A MUTATION STATUS' versus Clinical Feature #1: 'CN_CNMF'
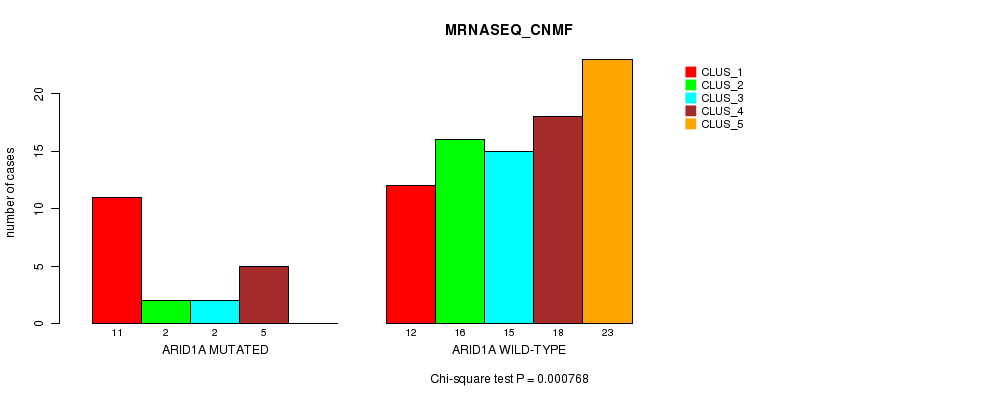
P value = 0.000768 (Chi-square test), Q value = 0.2
Table S6. Gene #11: 'ARID1A MUTATION STATUS' versus Clinical Feature #3: 'MRNASEQ_CNMF'
| nPatients | CLUS_1 | CLUS_2 | CLUS_3 | CLUS_4 | CLUS_5 |
|---|---|---|---|---|---|
| ALL | 23 | 18 | 17 | 23 | 23 |
| ARID1A MUTATED | 11 | 2 | 2 | 5 | 0 |
| ARID1A WILD-TYPE | 12 | 16 | 15 | 18 | 23 |
Figure S6. Get High-res Image Gene #11: 'ARID1A MUTATION STATUS' versus Clinical Feature #3: 'MRNASEQ_CNMF'
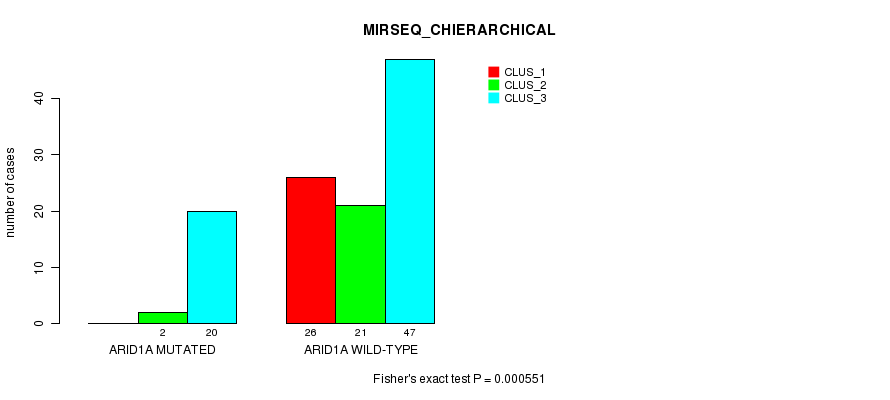
P value = 0.000551 (Fisher's exact test), Q value = 0.15
Table S7. Gene #11: 'ARID1A MUTATION STATUS' versus Clinical Feature #6: 'MIRSEQ_CHIERARCHICAL'
| nPatients | CLUS_1 | CLUS_2 | CLUS_3 |
|---|---|---|---|
| ALL | 26 | 23 | 67 |
| ARID1A MUTATED | 0 | 2 | 20 |
| ARID1A WILD-TYPE | 26 | 21 | 47 |
Figure S7. Get High-res Image Gene #11: 'ARID1A MUTATION STATUS' versus Clinical Feature #6: 'MIRSEQ_CHIERARCHICAL'
-
Mutation data file = STAD-TP.mutsig.cluster.txt
-
Molecular subtypes file = STAD-TP.transferedmergedcluster.txt
-
Number of patients = 116
-
Number of significantly mutated genes = 47
-
Number of Molecular subtypes = 6
-
Exclude genes that fewer than K tumors have mutations, K = 3
For binary or multi-class clinical features (nominal or ordinal), two-tailed Fisher's exact tests (Fisher 1922) were used to estimate the P values using the 'fisher.test' function in R
For multi-class clinical features (nominal or ordinal), Chi-square tests (Greenwood and Nikulin 1996) were used to estimate the P values using the 'chisq.test' function in R
For multiple hypothesis correction, Q value is the False Discovery Rate (FDR) analogue of the P value (Benjamini and Hochberg 1995), defined as the minimum FDR at which the test may be called significant. We used the 'Benjamini and Hochberg' method of 'p.adjust' function in R to convert P values into Q values.
This is an experimental feature. The full results of the analysis summarized in this report can be downloaded from the TCGA Data Coordination Center.