This pipeline computes the correlation between significant copy number variation (cnv focal) genes and selected clinical features.
Testing the association between copy number variation 26 arm-level results and 15 clinical features across 421 patients, 13 significant findings detected with Q value < 0.25.
-
Amp Peak 1(Xq22.3) cnv correlated to 'NUMBER.OF.LYMPH.NODES'.
-
Del Peak 2(2p23.1) cnv correlated to 'NUMBER.OF.LYMPH.NODES'.
-
Del Peak 3(2q35) cnv correlated to 'NUMBER.OF.LYMPH.NODES' and 'NEOPLASM.DISEASESTAGE'.
-
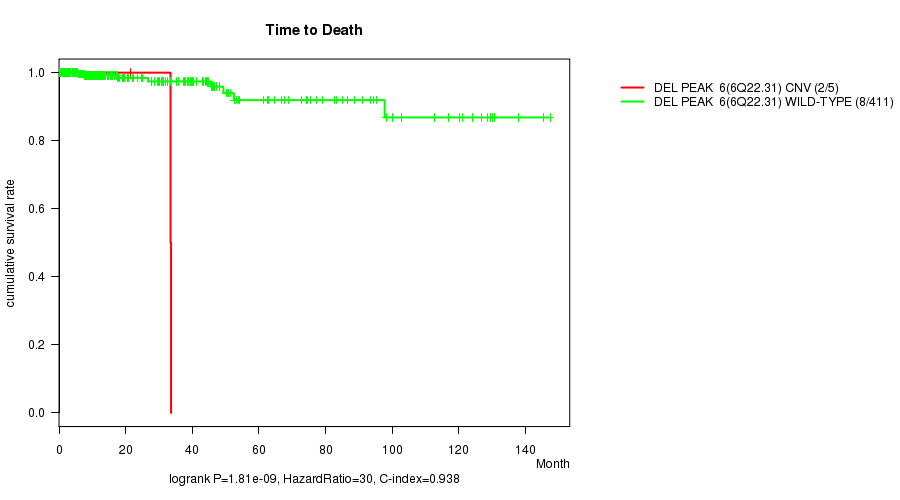
Del Peak 6(6q22.31) cnv correlated to 'Time to Death'.
-
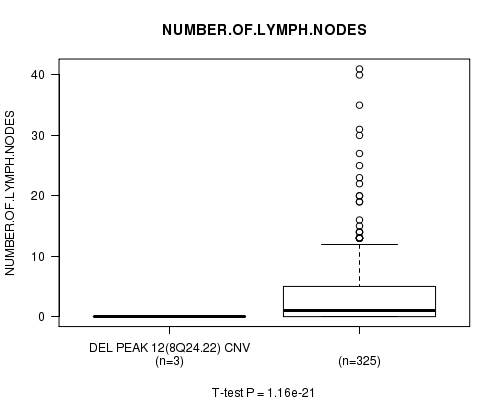
Del Peak 12(8q24.22) cnv correlated to 'NUMBER.OF.LYMPH.NODES'.
-
Del Peak 13(9q21.13) cnv correlated to 'NEOPLASM.DISEASESTAGE'.
-
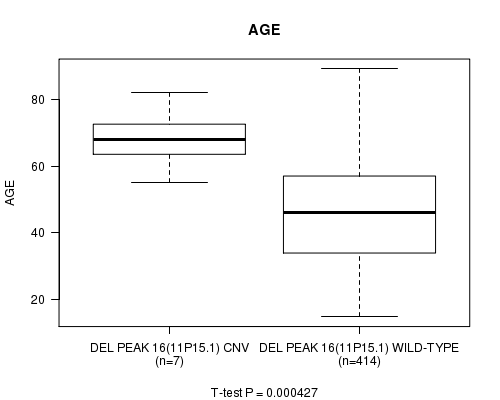
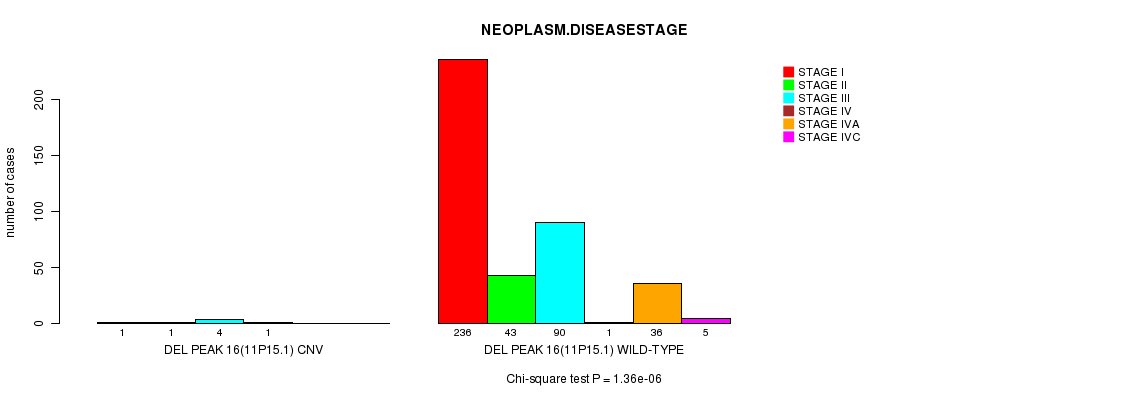
Del Peak 16(11p15.1) cnv correlated to 'AGE' and 'NEOPLASM.DISEASESTAGE'.
-
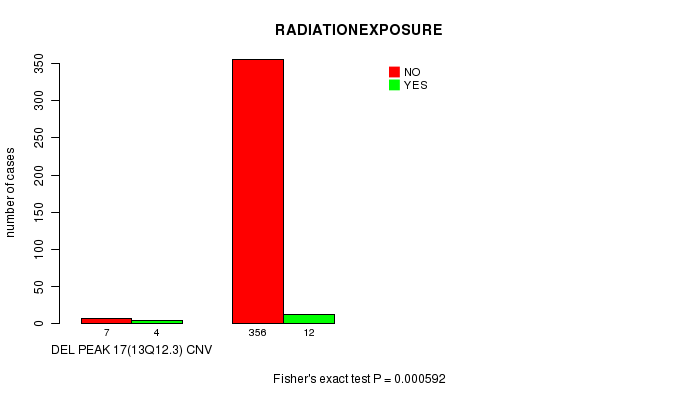
Del Peak 17(13q12.3) cnv correlated to 'RADIATIONEXPOSURE'.
-
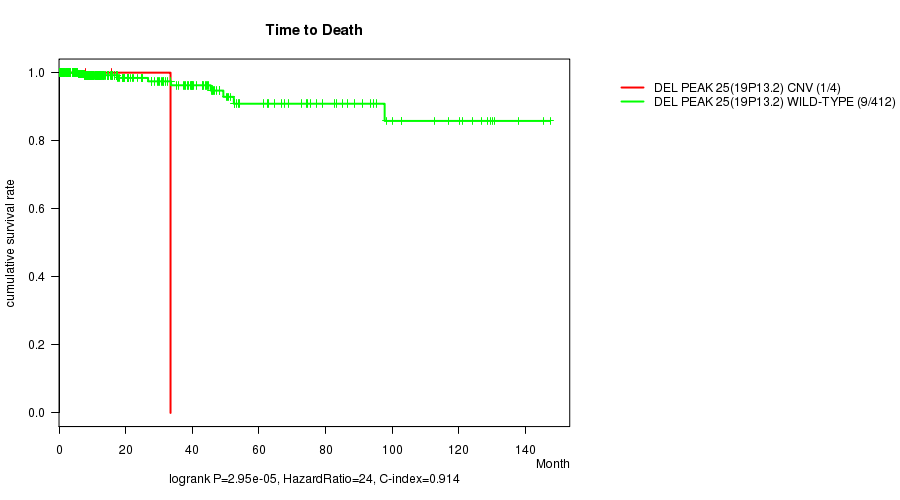
Del Peak 25(19p13.2) cnv correlated to 'Time to Death'.
-
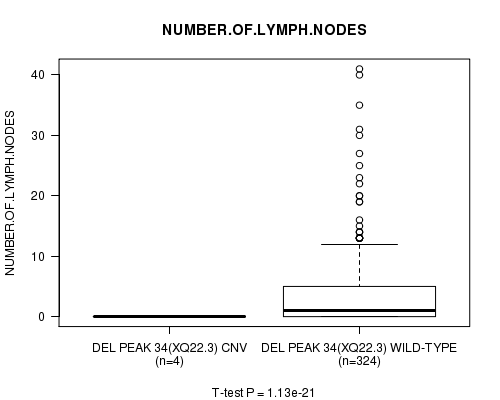
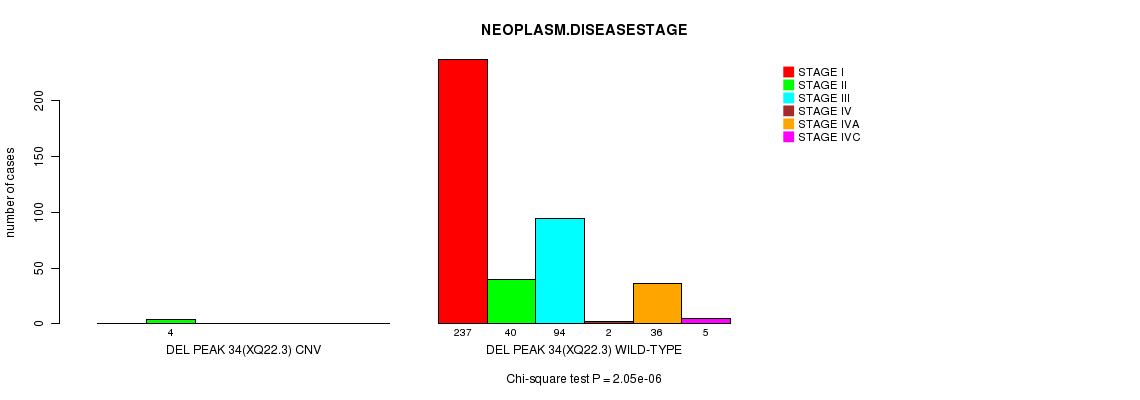
Del Peak 34(Xq22.3) cnv correlated to 'NUMBER.OF.LYMPH.NODES' and 'NEOPLASM.DISEASESTAGE'.
Table 1. Get Full Table Overview of the association between significant copy number variation of 26 arm-level results and 15 clinical features. Shown in the table are P values (Q values). Thresholded by Q value < 0.25, 13 significant findings detected.
|
Clinical Features |
Time to Death |
AGE | GENDER |
HISTOLOGICAL TYPE |
RADIATIONS RADIATION REGIMENINDICATION |
RADIATIONEXPOSURE |
DISTANT METASTASIS |
EXTRATHYROIDAL EXTENSION |
LYMPH NODE METASTASIS |
COMPLETENESS OF RESECTION |
NUMBER OF LYMPH NODES |
TUMOR STAGECODE |
NEOPLASM DISEASESTAGE |
MULTIFOCALITY |
TUMOR SIZE |
||
| nCNV (%) | nWild-Type | logrank test | t-test | Fisher's exact test | Fisher's exact test | Fisher's exact test | Fisher's exact test | Fisher's exact test | Fisher's exact test | Chi-square test | Fisher's exact test | t-test | t-test | Chi-square test | Fisher's exact test | t-test | |
| Del Peak 3(2q35) | 0 (0%) | 412 |
0.00119 (0.413) |
0.00609 (1.00) |
1 (1.00) |
0.0899 (1.00) |
1 (1.00) |
0.294 (1.00) |
0.0909 (1.00) |
0.607 (1.00) |
0.0951 (1.00) |
0.192 (1.00) |
1.08e-21 (3.91e-19) |
6.34e-06 (0.00224) |
1 (1.00) |
0.154 (1.00) |
|
| Del Peak 16(11p15 1) | 0 (0%) | 414 |
0.00162 (0.557) |
0.000427 (0.15) |
0.0132 (1.00) |
0.831 (1.00) |
0.212 (1.00) |
1 (1.00) |
0.0955 (1.00) |
0.548 (1.00) |
0.584 (1.00) |
0.493 (1.00) |
0.0855 (1.00) |
1.36e-06 (0.000484) |
0.704 (1.00) |
0.0337 (1.00) |
|
| Del Peak 34(Xq22 3) | 0 (0%) | 417 |
0.879 (1.00) |
0.0702 (1.00) |
0.0523 (1.00) |
1 (1.00) |
1 (1.00) |
0.122 (1.00) |
0.105 (1.00) |
0.416 (1.00) |
0.307 (1.00) |
0.294 (1.00) |
1.13e-21 (4.07e-19) |
2.05e-06 (0.000727) |
1 (1.00) |
0.835 (1.00) |
|
| Amp Peak 1(Xq22 3) | 0 (0%) | 408 |
0.147 (1.00) |
0.162 (1.00) |
0.0453 (1.00) |
0.649 (1.00) |
1 (1.00) |
1 (1.00) |
0.539 (1.00) |
0.0205 (1.00) |
0.35 (1.00) |
0.859 (1.00) |
2.88e-05 (0.0102) |
0.00903 (1.00) |
0.573 (1.00) |
0.996 (1.00) |
|
| Del Peak 2(2p23 1) | 0 (0%) | 412 |
0.817 (1.00) |
0.169 (1.00) |
0.459 (1.00) |
0.0899 (1.00) |
1 (1.00) |
1 (1.00) |
0.0909 (1.00) |
0.152 (1.00) |
0.093 (1.00) |
0.603 (1.00) |
1.06e-21 (3.84e-19) |
0.00121 (0.418) |
1 (1.00) |
0.419 (1.00) |
|
| Del Peak 6(6q22 31) | 0 (0%) | 416 |
1.81e-09 (6.46e-07) |
0.112 (1.00) |
0.605 (1.00) |
0.585 (1.00) |
0.156 (1.00) |
0.159 (1.00) |
0.0282 (1.00) |
0.437 (1.00) |
0.542 (1.00) |
1 (1.00) |
0.00185 (0.637) |
0.0569 (1.00) |
0.39 (1.00) |
0.0482 (1.00) |
|
| Del Peak 12(8q24 22) | 0 (0%) | 416 |
0.882 (1.00) |
0.0612 (1.00) |
0.107 (1.00) |
0.585 (1.00) |
1 (1.00) |
1 (1.00) |
1 (1.00) |
1 (1.00) |
0.376 (1.00) |
0.364 (1.00) |
1.16e-21 (4.15e-19) |
0.00729 (1.00) |
1 (1.00) |
0.253 (1.00) |
|
| Del Peak 13(9q21 13) | 0 (0%) | 406 |
0.0079 (1.00) |
0.0124 (1.00) |
0.546 (1.00) |
0.796 (1.00) |
0.403 (1.00) |
0.459 (1.00) |
0.139 (1.00) |
0.0681 (1.00) |
0.391 (1.00) |
0.758 (1.00) |
0.731 (1.00) |
2.4e-13 (8.58e-11) |
0.798 (1.00) |
0.151 (1.00) |
|
| Del Peak 17(13q12 3) | 0 (0%) | 409 |
0.316 (1.00) |
0.00765 (1.00) |
0.0839 (1.00) |
0.345 (1.00) |
0.337 (1.00) |
0.000592 (0.207) |
0.285 (1.00) |
1 (1.00) |
0.272 (1.00) |
0.828 (1.00) |
0.0727 (1.00) |
0.0667 (1.00) |
0.381 (1.00) |
0.503 (1.00) |
|
| Del Peak 25(19p13 2) | 0 (0%) | 417 |
2.95e-05 (0.0104) |
0.0286 (1.00) |
0.268 (1.00) |
1 (1.00) |
1 (1.00) |
0.159 (1.00) |
1 (1.00) |
1 (1.00) |
0.0593 (1.00) |
0.294 (1.00) |
0.212 (1.00) |
0.134 (1.00) |
|||
| Del Peak 4(5p15 2) | 0 (0%) | 418 |
0.917 (1.00) |
0.306 (1.00) |
0.574 (1.00) |
0.356 (1.00) |
1 (1.00) |
1 (1.00) |
0.304 (1.00) |
0.285 (1.00) |
0.177 (1.00) |
0.0509 (1.00) |
0.439 (1.00) |
0.706 (1.00) |
0.084 (1.00) |
0.411 (1.00) |
|
| Del Peak 8(7q34) | 0 (0%) | 417 |
0.73 (1.00) |
0.774 (1.00) |
1 (1.00) |
0.145 (1.00) |
1 (1.00) |
1 (1.00) |
1 (1.00) |
0.416 (1.00) |
0.689 (1.00) |
1 (1.00) |
0.235 (1.00) |
0.797 (1.00) |
0.634 (1.00) |
0.193 (1.00) |
|
| Del Peak 14(10q21 2) | 0 (0%) | 411 |
0.727 (1.00) |
0.814 (1.00) |
0.719 (1.00) |
0.617 (1.00) |
0.29 (1.00) |
1 (1.00) |
0.795 (1.00) |
1 (1.00) |
0.898 (1.00) |
1 (1.00) |
0.676 (1.00) |
0.872 (1.00) |
0.514 (1.00) |
0.211 (1.00) |
|
| Del Peak 15(10q23 31) | 0 (0%) | 412 |
0.762 (1.00) |
0.0097 (1.00) |
0.241 (1.00) |
0.566 (1.00) |
1 (1.00) |
1 (1.00) |
0.313 (1.00) |
1 (1.00) |
0.11 (1.00) |
0.798 (1.00) |
0.00551 (1.00) |
0.0321 (1.00) |
0.735 (1.00) |
0.0709 (1.00) |
|
| Del Peak 18(13q21 31) | 0 (0%) | 407 |
0.327 (1.00) |
0.0995 (1.00) |
0.207 (1.00) |
0.199 (1.00) |
0.0744 (1.00) |
0.000865 (0.302) |
0.251 (1.00) |
0.6 (1.00) |
0.233 (1.00) |
0.844 (1.00) |
0.00276 (0.944) |
0.526 (1.00) |
0.0869 (1.00) |
0.842 (1.00) |
|
| Del Peak 19(15q25 3) | 0 (0%) | 415 |
0.777 (1.00) |
0.909 (1.00) |
0.345 (1.00) |
0.0614 (1.00) |
1 (1.00) |
1 (1.00) |
0.0277 (1.00) |
1 (1.00) |
0.358 (1.00) |
0.662 (1.00) |
0.397 (1.00) |
0.0395 (1.00) |
1 (1.00) |
0.73 (1.00) |
|
| Del Peak 21(16q23 3) | 0 (0%) | 416 |
0.717 (1.00) |
0.0711 (1.00) |
1 (1.00) |
0.116 (1.00) |
1 (1.00) |
0.195 (1.00) |
1 (1.00) |
0.034 (1.00) |
0.921 (1.00) |
0.203 (1.00) |
0.745 (1.00) |
0.0292 (1.00) |
0.658 (1.00) |
0.893 (1.00) |
|
| Del Peak 22(17p13 1) | 0 (0%) | 416 |
0.696 (1.00) |
0.969 (1.00) |
0.336 (1.00) |
0.178 (1.00) |
0.00971 (1.00) |
1 (1.00) |
0.246 (1.00) |
0.186 (1.00) |
0.437 (1.00) |
1 (1.00) |
0.162 (1.00) |
0.268 (1.00) |
0.39 (1.00) |
0.371 (1.00) |
|
| Del Peak 23(18p11 21) | 0 (0%) | 418 |
0.879 (1.00) |
0.939 (1.00) |
0.574 (1.00) |
0.653 (1.00) |
1 (1.00) |
1 (1.00) |
0.603 (1.00) |
0.604 (1.00) |
0.797 (1.00) |
1 (1.00) |
0.0277 (1.00) |
0.0664 (1.00) |
1 (1.00) |
0.389 (1.00) |
|
| Del Peak 24(18q22 2) | 0 (0%) | 417 |
0.787 (1.00) |
0.522 (1.00) |
0.576 (1.00) |
1 (1.00) |
1 (1.00) |
1 (1.00) |
1 (1.00) |
0.416 (1.00) |
0.689 (1.00) |
1 (1.00) |
0.00185 (0.637) |
0.197 (1.00) |
0.634 (1.00) |
0.757 (1.00) |
|
| Del Peak 28(21q21 1) | 0 (0%) | 412 |
0.872 (1.00) |
0.0536 (1.00) |
0.699 (1.00) |
0.772 (1.00) |
1 (1.00) |
1 (1.00) |
0.586 (1.00) |
0.607 (1.00) |
0.391 (1.00) |
0.332 (1.00) |
0.912 (1.00) |
0.00823 (1.00) |
0.19 (1.00) |
0.621 (1.00) |
|
| Del Peak 29(22q13 1) | 0 (0%) | 351 |
0.248 (1.00) |
0.628 (1.00) |
0.881 (1.00) |
0.228 (1.00) |
0.482 (1.00) |
0.325 (1.00) |
0.485 (1.00) |
0.204 (1.00) |
0.514 (1.00) |
0.371 (1.00) |
0.0841 (1.00) |
0.689 (1.00) |
0.183 (1.00) |
1 (1.00) |
|
| Del Peak 30(22q13 2) | 0 (0%) | 351 |
0.248 (1.00) |
0.628 (1.00) |
0.881 (1.00) |
0.228 (1.00) |
0.482 (1.00) |
0.325 (1.00) |
0.485 (1.00) |
0.204 (1.00) |
0.514 (1.00) |
0.371 (1.00) |
0.0841 (1.00) |
0.689 (1.00) |
0.183 (1.00) |
1 (1.00) |
|
| Del Peak 31(22q13 31) | 0 (0%) | 351 |
0.248 (1.00) |
0.628 (1.00) |
0.881 (1.00) |
0.228 (1.00) |
0.482 (1.00) |
0.325 (1.00) |
0.485 (1.00) |
0.204 (1.00) |
0.514 (1.00) |
0.371 (1.00) |
0.0841 (1.00) |
0.689 (1.00) |
0.183 (1.00) |
1 (1.00) |
|
| Del Peak 32(22q13 32) | 0 (0%) | 350 |
0.248 (1.00) |
0.668 (1.00) |
0.881 (1.00) |
0.147 (1.00) |
0.481 (1.00) |
0.324 (1.00) |
0.574 (1.00) |
0.204 (1.00) |
0.448 (1.00) |
0.371 (1.00) |
0.0674 (1.00) |
0.708 (1.00) |
0.145 (1.00) |
1 (1.00) |
|
| Del Peak 33(Xq22 1) | 0 (0%) | 415 |
0.829 (1.00) |
0.186 (1.00) |
0.0387 (1.00) |
1 (1.00) |
1 (1.00) |
0.195 (1.00) |
0.188 (1.00) |
0.344 (1.00) |
0.647 (1.00) |
0.269 (1.00) |
0.804 (1.00) |
0.000937 (0.326) |
0.412 (1.00) |
0.495 (1.00) |
P value = 2.88e-05 (t-test), Q value = 0.01
Table S1. Gene #1: 'Amp Peak 1(Xq22.3)' versus Clinical Feature #11: 'NUMBER.OF.LYMPH.NODES'
| nPatients | Mean (Std.Dev) | |
|---|---|---|
| ALL | 328 | 3.5 (6.2) |
| AMP PEAK 1(XQ22.3) CNV | 7 | 0.4 (1.1) |
| AMP PEAK 1(XQ22.3) WILD-TYPE | 321 | 3.6 (6.3) |
Figure S1. Get High-res Image Gene #1: 'Amp Peak 1(Xq22.3)' versus Clinical Feature #11: 'NUMBER.OF.LYMPH.NODES'

P value = 1.06e-21 (t-test), Q value = 3.8e-19
Table S2. Gene #2: 'Del Peak 2(2p23.1)' versus Clinical Feature #11: 'NUMBER.OF.LYMPH.NODES'
| nPatients | Mean (Std.Dev) | |
|---|---|---|
| ALL | 328 | 3.5 (6.2) |
| DEL PEAK 2(2P23.1) CNV | 7 | 0.0 (0.0) |
| DEL PEAK 2(2P23.1) WILD-TYPE | 321 | 3.6 (6.2) |
Figure S2. Get High-res Image Gene #2: 'Del Peak 2(2p23.1)' versus Clinical Feature #11: 'NUMBER.OF.LYMPH.NODES'

P value = 1.08e-21 (t-test), Q value = 3.9e-19
Table S3. Gene #3: 'Del Peak 3(2q35)' versus Clinical Feature #11: 'NUMBER.OF.LYMPH.NODES'
| nPatients | Mean (Std.Dev) | |
|---|---|---|
| ALL | 328 | 3.5 (6.2) |
| DEL PEAK 3(2Q35) CNV | 6 | 0.0 (0.0) |
| DEL PEAK 3(2Q35) WILD-TYPE | 322 | 3.6 (6.2) |
Figure S3. Get High-res Image Gene #3: 'Del Peak 3(2q35)' versus Clinical Feature #11: 'NUMBER.OF.LYMPH.NODES'

P value = 6.34e-06 (Chi-square test), Q value = 0.0022
Table S4. Gene #3: 'Del Peak 3(2q35)' versus Clinical Feature #13: 'NEOPLASM.DISEASESTAGE'
| nPatients | STAGE I | STAGE II | STAGE III | STAGE IV | STAGE IVA | STAGE IVC |
|---|---|---|---|---|---|---|
| ALL | 237 | 44 | 94 | 2 | 36 | 5 |
| DEL PEAK 3(2Q35) CNV | 1 | 6 | 2 | 0 | 0 | 0 |
| DEL PEAK 3(2Q35) WILD-TYPE | 236 | 38 | 92 | 2 | 36 | 5 |
Figure S4. Get High-res Image Gene #3: 'Del Peak 3(2q35)' versus Clinical Feature #13: 'NEOPLASM.DISEASESTAGE'

P value = 1.81e-09 (logrank test), Q value = 6.5e-07
Table S5. Gene #5: 'Del Peak 6(6q22.31)' versus Clinical Feature #1: 'Time to Death'
| nPatients | nDeath | Duration Range (Median), Month | |
|---|---|---|---|
| ALL | 416 | 10 | 0.0 - 147.4 (9.3) |
| DEL PEAK 6(6Q22.31) CNV | 5 | 2 | 1.6 - 33.6 (21.4) |
| DEL PEAK 6(6Q22.31) WILD-TYPE | 411 | 8 | 0.0 - 147.4 (9.3) |
Figure S5. Get High-res Image Gene #5: 'Del Peak 6(6q22.31)' versus Clinical Feature #1: 'Time to Death'
P value = 1.16e-21 (t-test), Q value = 4.2e-19
Table S6. Gene #7: 'Del Peak 12(8q24.22)' versus Clinical Feature #11: 'NUMBER.OF.LYMPH.NODES'
| nPatients | Mean (Std.Dev) | |
|---|---|---|
| ALL | 328 | 3.5 (6.2) |
| DEL PEAK 12(8Q24.22) CNV | 3 | 0.0 (0.0) |
| DEL PEAK 12(8Q24.22) WILD-TYPE | 325 | 3.6 (6.2) |
Figure S6. Get High-res Image Gene #7: 'Del Peak 12(8q24.22)' versus Clinical Feature #11: 'NUMBER.OF.LYMPH.NODES'
P value = 2.4e-13 (Chi-square test), Q value = 8.6e-11
Table S7. Gene #8: 'Del Peak 13(9q21.13)' versus Clinical Feature #13: 'NEOPLASM.DISEASESTAGE'
| nPatients | STAGE I | STAGE II | STAGE III | STAGE IV | STAGE IVA | STAGE IVC |
|---|---|---|---|---|---|---|
| ALL | 237 | 44 | 94 | 2 | 36 | 5 |
| DEL PEAK 13(9Q21.13) CNV | 3 | 5 | 2 | 2 | 3 | 0 |
| DEL PEAK 13(9Q21.13) WILD-TYPE | 234 | 39 | 92 | 0 | 33 | 5 |
Figure S7. Get High-res Image Gene #8: 'Del Peak 13(9q21.13)' versus Clinical Feature #13: 'NEOPLASM.DISEASESTAGE'

P value = 0.000427 (t-test), Q value = 0.15
Table S8. Gene #11: 'Del Peak 16(11p15.1)' versus Clinical Feature #2: 'AGE'
| nPatients | Mean (Std.Dev) | |
|---|---|---|
| ALL | 421 | 46.6 (15.6) |
| DEL PEAK 16(11P15.1) CNV | 7 | 68.1 (8.7) |
| DEL PEAK 16(11P15.1) WILD-TYPE | 414 | 46.2 (15.4) |
Figure S8. Get High-res Image Gene #11: 'Del Peak 16(11p15.1)' versus Clinical Feature #2: 'AGE'
P value = 1.36e-06 (Chi-square test), Q value = 0.00048
Table S9. Gene #11: 'Del Peak 16(11p15.1)' versus Clinical Feature #13: 'NEOPLASM.DISEASESTAGE'
| nPatients | STAGE I | STAGE II | STAGE III | STAGE IV | STAGE IVA | STAGE IVC |
|---|---|---|---|---|---|---|
| ALL | 237 | 44 | 94 | 2 | 36 | 5 |
| DEL PEAK 16(11P15.1) CNV | 1 | 1 | 4 | 1 | 0 | 0 |
| DEL PEAK 16(11P15.1) WILD-TYPE | 236 | 43 | 90 | 1 | 36 | 5 |
Figure S9. Get High-res Image Gene #11: 'Del Peak 16(11p15.1)' versus Clinical Feature #13: 'NEOPLASM.DISEASESTAGE'
P value = 0.000592 (Fisher's exact test), Q value = 0.21
Table S10. Gene #12: 'Del Peak 17(13q12.3)' versus Clinical Feature #6: 'RADIATIONEXPOSURE'
| nPatients | NO | YES |
|---|---|---|
| ALL | 363 | 16 |
| DEL PEAK 17(13Q12.3) CNV | 7 | 4 |
| DEL PEAK 17(13Q12.3) WILD-TYPE | 356 | 12 |
Figure S10. Get High-res Image Gene #12: 'Del Peak 17(13q12.3)' versus Clinical Feature #6: 'RADIATIONEXPOSURE'
P value = 2.95e-05 (logrank test), Q value = 0.01
Table S11. Gene #19: 'Del Peak 25(19p13.2)' versus Clinical Feature #1: 'Time to Death'
| nPatients | nDeath | Duration Range (Median), Month | |
|---|---|---|---|
| ALL | 416 | 10 | 0.0 - 147.4 (9.3) |
| DEL PEAK 25(19P13.2) CNV | 4 | 1 | 0.9 - 33.5 (11.9) |
| DEL PEAK 25(19P13.2) WILD-TYPE | 412 | 9 | 0.0 - 147.4 (9.3) |
Figure S11. Get High-res Image Gene #19: 'Del Peak 25(19p13.2)' versus Clinical Feature #1: 'Time to Death'
P value = 1.13e-21 (t-test), Q value = 4.1e-19
Table S12. Gene #26: 'Del Peak 34(Xq22.3)' versus Clinical Feature #11: 'NUMBER.OF.LYMPH.NODES'
| nPatients | Mean (Std.Dev) | |
|---|---|---|
| ALL | 328 | 3.5 (6.2) |
| DEL PEAK 34(XQ22.3) CNV | 4 | 0.0 (0.0) |
| DEL PEAK 34(XQ22.3) WILD-TYPE | 324 | 3.6 (6.2) |
Figure S12. Get High-res Image Gene #26: 'Del Peak 34(Xq22.3)' versus Clinical Feature #11: 'NUMBER.OF.LYMPH.NODES'
P value = 2.05e-06 (Chi-square test), Q value = 0.00073
Table S13. Gene #26: 'Del Peak 34(Xq22.3)' versus Clinical Feature #13: 'NEOPLASM.DISEASESTAGE'
| nPatients | STAGE I | STAGE II | STAGE III | STAGE IV | STAGE IVA | STAGE IVC |
|---|---|---|---|---|---|---|
| ALL | 237 | 44 | 94 | 2 | 36 | 5 |
| DEL PEAK 34(XQ22.3) CNV | 0 | 4 | 0 | 0 | 0 | 0 |
| DEL PEAK 34(XQ22.3) WILD-TYPE | 237 | 40 | 94 | 2 | 36 | 5 |
Figure S13. Get High-res Image Gene #26: 'Del Peak 34(Xq22.3)' versus Clinical Feature #13: 'NEOPLASM.DISEASESTAGE'
-
Mutation data file = all_lesions.conf_99.cnv.cluster.txt
-
Clinical data file = THCA-TP.clin.merged.picked.txt
-
Number of patients = 421
-
Number of significantly arm-level cnvs = 26
-
Number of selected clinical features = 15
-
Exclude genes that fewer than K tumors have mutations, K = 3
For survival clinical features, the Kaplan-Meier survival curves of tumors with and without gene mutations were plotted and the statistical significance P values were estimated by logrank test (Bland and Altman 2004) using the 'survdiff' function in R
For continuous numerical clinical features, two-tailed Student's t test with unequal variance (Lehmann and Romano 2005) was applied to compare the clinical values between tumors with and without gene mutations using 't.test' function in R
For binary or multi-class clinical features (nominal or ordinal), two-tailed Fisher's exact tests (Fisher 1922) were used to estimate the P values using the 'fisher.test' function in R
For multi-class clinical features (nominal or ordinal), Chi-square tests (Greenwood and Nikulin 1996) were used to estimate the P values using the 'chisq.test' function in R
For multiple hypothesis correction, Q value is the False Discovery Rate (FDR) analogue of the P value (Benjamini and Hochberg 1995), defined as the minimum FDR at which the test may be called significant. We used the 'Benjamini and Hochberg' method of 'p.adjust' function in R to convert P values into Q values.
This is an experimental feature. The full results of the analysis summarized in this report can be downloaded from the TCGA Data Coordination Center.