This pipeline computes the correlation between significantly recurrent gene mutations and selected clinical features.
Testing the association between mutation status of 33 genes and 15 clinical features across 289 patients, 5 significant findings detected with Q value < 0.25.
-
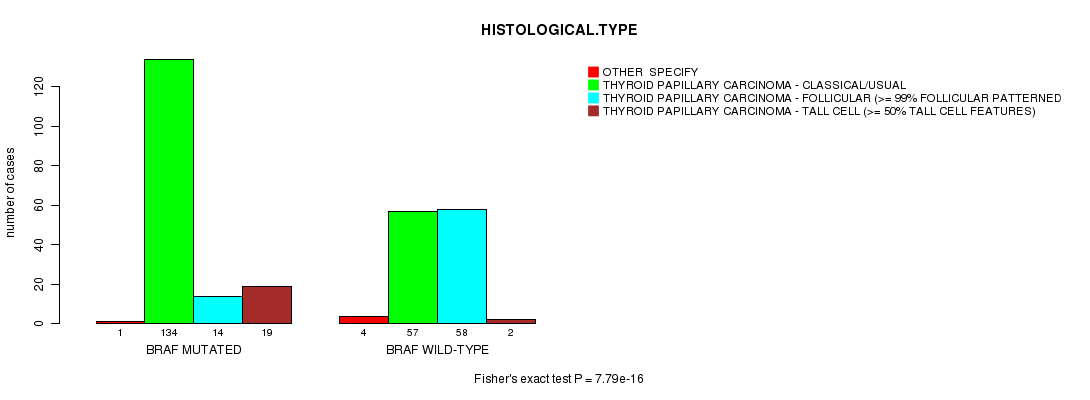
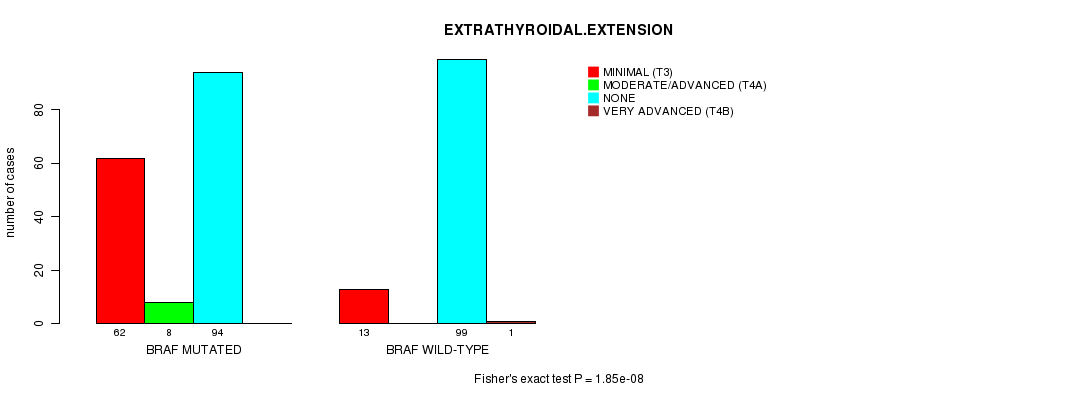
BRAF mutation correlated to 'HISTOLOGICAL.TYPE' and 'EXTRATHYROIDAL.EXTENSION'.
-
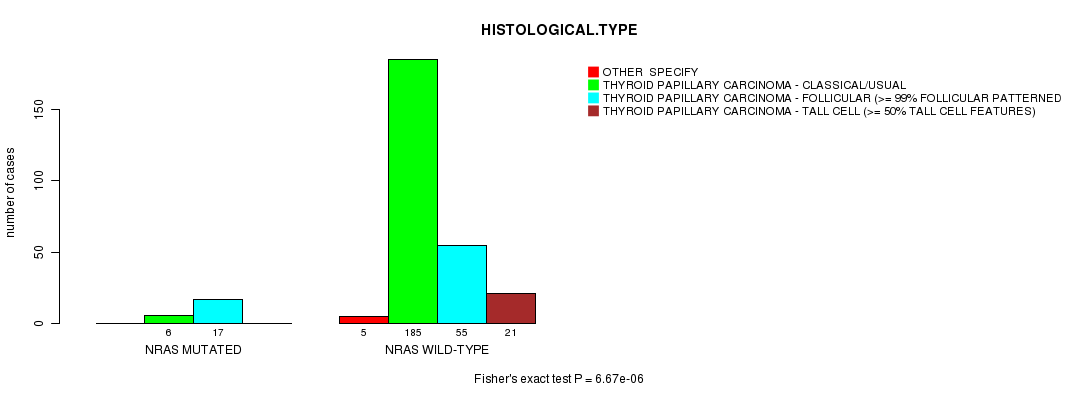
NRAS mutation correlated to 'HISTOLOGICAL.TYPE'.
-
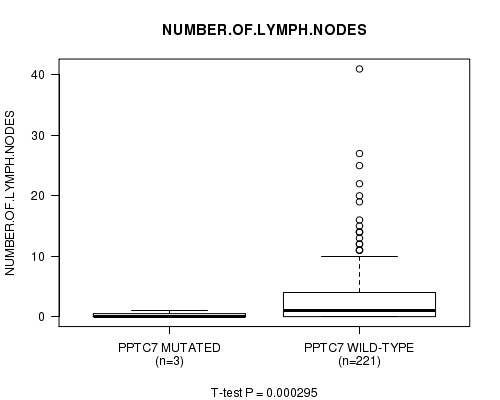
PPTC7 mutation correlated to 'NUMBER.OF.LYMPH.NODES'.
-
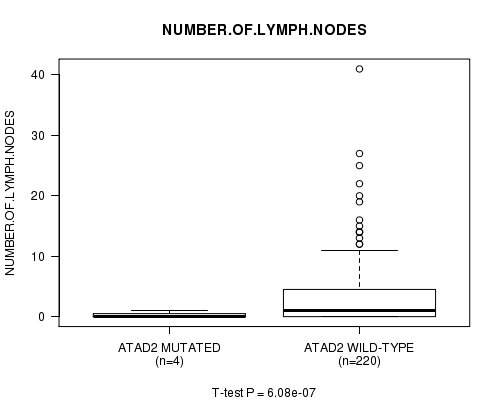
ATAD2 mutation correlated to 'NUMBER.OF.LYMPH.NODES'.
Table 1. Get Full Table Overview of the association between mutation status of 33 genes and 15 clinical features. Shown in the table are P values (Q values). Thresholded by Q value < 0.25, 5 significant findings detected.
|
Clinical Features |
Time to Death |
AGE | GENDER |
HISTOLOGICAL TYPE |
RADIATIONS RADIATION REGIMENINDICATION |
RADIATIONEXPOSURE |
DISTANT METASTASIS |
EXTRATHYROIDAL EXTENSION |
LYMPH NODE METASTASIS |
COMPLETENESS OF RESECTION |
NUMBER OF LYMPH NODES |
TUMOR STAGECODE |
NEOPLASM DISEASESTAGE |
MULTIFOCALITY |
TUMOR SIZE |
||
| nMutated (%) | nWild-Type | logrank test | t-test | Fisher's exact test | Fisher's exact test | Fisher's exact test | Fisher's exact test | Fisher's exact test | Fisher's exact test | Chi-square test | Fisher's exact test | t-test | t-test | Chi-square test | Fisher's exact test | t-test | |
| BRAF | 168 (58%) | 121 |
0.271 (1.00) |
0.791 (1.00) |
0.341 (1.00) |
7.79e-16 (3.43e-13) |
0.0164 (1.00) |
1 (1.00) |
0.2 (1.00) |
1.85e-08 (8.12e-06) |
0.00179 (0.779) |
0.981 (1.00) |
0.378 (1.00) |
0.0598 (1.00) |
0.715 (1.00) |
0.309 (1.00) |
|
| NRAS | 23 (8%) | 266 |
0.666 (1.00) |
0.514 (1.00) |
0.617 (1.00) |
6.67e-06 (0.00291) |
0.608 (1.00) |
1 (1.00) |
0.47 (1.00) |
0.00644 (1.00) |
0.00241 (1.00) |
0.899 (1.00) |
0.00277 (1.00) |
0.153 (1.00) |
0.514 (1.00) |
0.503 (1.00) |
|
| PPTC7 | 3 (1%) | 286 |
0.871 (1.00) |
0.683 (1.00) |
0.158 (1.00) |
1 (1.00) |
1 (1.00) |
1 (1.00) |
0.634 (1.00) |
0.603 (1.00) |
0.825 (1.00) |
1 (1.00) |
0.000295 (0.129) |
0.973 (1.00) |
0.608 (1.00) |
0.963 (1.00) |
|
| ATAD2 | 4 (1%) | 285 |
0.0505 (1.00) |
0.376 (1.00) |
1 (1.00) |
1 (1.00) |
1 (1.00) |
1 (1.00) |
0.648 (1.00) |
0.0832 (1.00) |
0.427 (1.00) |
0.283 (1.00) |
6.08e-07 (0.000266) |
0.946 (1.00) |
0.352 (1.00) |
0.152 (1.00) |
|
| EMG1 | 6 (2%) | 283 |
0.775 (1.00) |
0.66 (1.00) |
0.343 (1.00) |
0.357 (1.00) |
1 (1.00) |
1 (1.00) |
0.716 (1.00) |
0.733 (1.00) |
0.832 (1.00) |
0.263 (1.00) |
0.233 (1.00) |
0.511 (1.00) |
0.686 (1.00) |
0.534 (1.00) |
|
| HRAS | 11 (4%) | 278 |
0.624 (1.00) |
0.922 (1.00) |
1 (1.00) |
0.00549 (1.00) |
1 (1.00) |
1 (1.00) |
0.187 (1.00) |
0.816 (1.00) |
0.418 (1.00) |
0.126 (1.00) |
0.832 (1.00) |
0.136 (1.00) |
0.362 (1.00) |
0.404 (1.00) |
|
| PTTG1IP | 4 (1%) | 285 |
0.658 (1.00) |
0.534 (1.00) |
0.575 (1.00) |
0.711 (1.00) |
1 (1.00) |
1 (1.00) |
0.404 (1.00) |
0.184 (1.00) |
0.0412 (1.00) |
1 (1.00) |
0.615 (1.00) |
0.946 (1.00) |
0.124 (1.00) |
0.0206 (1.00) |
|
| RPTN | 8 (3%) | 281 |
0.643 (1.00) |
0.76 (1.00) |
1 (1.00) |
0.0645 (1.00) |
1 (1.00) |
1 (1.00) |
0.559 (1.00) |
0.763 (1.00) |
0.0409 (1.00) |
1 (1.00) |
0.957 (1.00) |
0.522 (1.00) |
1 (1.00) |
0.302 (1.00) |
|
| EIF1AX | 4 (1%) | 285 |
0.0623 (1.00) |
0.191 (1.00) |
0.051 (1.00) |
0.178 (1.00) |
1 (1.00) |
1 (1.00) |
1 (1.00) |
1 (1.00) |
0.132 (1.00) |
0.134 (1.00) |
0.971 (1.00) |
0.608 (1.00) |
0.249 (1.00) |
||
| CCDC15 | 5 (2%) | 284 |
0.684 (1.00) |
0.127 (1.00) |
1 (1.00) |
0.582 (1.00) |
1 (1.00) |
1 (1.00) |
0.271 (1.00) |
1 (1.00) |
0.0214 (1.00) |
1 (1.00) |
0.229 (1.00) |
0.752 (1.00) |
0.373 (1.00) |
0.478 (1.00) |
|
| ZNF845 | 5 (2%) | 284 |
0.816 (1.00) |
0.82 (1.00) |
1 (1.00) |
0.582 (1.00) |
1 (1.00) |
0.176 (1.00) |
0.705 (1.00) |
1 (1.00) |
0.49 (1.00) |
1 (1.00) |
0.84 (1.00) |
0.371 (1.00) |
0.673 (1.00) |
0.69 (1.00) |
|
| ZNF878 | 3 (1%) | 286 |
0.667 (1.00) |
0.365 (1.00) |
1 (1.00) |
1 (1.00) |
1 (1.00) |
1 (1.00) |
0.16 (1.00) |
1 (1.00) |
0.421 (1.00) |
1 (1.00) |
0.892 (1.00) |
0.249 (1.00) |
|||
| TG | 14 (5%) | 275 |
0.0601 (1.00) |
0.953 (1.00) |
1 (1.00) |
0.0047 (1.00) |
1 (1.00) |
1 (1.00) |
0.302 (1.00) |
0.603 (1.00) |
0.852 (1.00) |
1 (1.00) |
0.416 (1.00) |
0.883 (1.00) |
1 (1.00) |
0.944 (1.00) |
|
| PRB2 | 5 (2%) | 284 |
0.0272 (1.00) |
0.888 (1.00) |
0.603 (1.00) |
0.762 (1.00) |
1 (1.00) |
1 (1.00) |
0.109 (1.00) |
0.172 (1.00) |
0.198 (1.00) |
0.353 (1.00) |
0.013 (1.00) |
1 (1.00) |
0.997 (1.00) |
||
| R3HDM2 | 4 (1%) | 285 |
0.884 (1.00) |
0.963 (1.00) |
1 (1.00) |
0.522 (1.00) |
1 (1.00) |
1 (1.00) |
0.648 (1.00) |
0.631 (1.00) |
0.567 (1.00) |
1 (1.00) |
0.971 (1.00) |
1 (1.00) |
0.633 (1.00) |
||
| TMCO2 | 3 (1%) | 286 |
0.19 (1.00) |
0.945 (1.00) |
0.158 (1.00) |
0.672 (1.00) |
1 (1.00) |
0.135 (1.00) |
1 (1.00) |
0.0193 (1.00) |
0.234 (1.00) |
0.211 (1.00) |
0.973 (1.00) |
1 (1.00) |
0.279 (1.00) |
||
| MUC7 | 5 (2%) | 284 |
0.525 (1.00) |
0.795 (1.00) |
0.603 (1.00) |
0.582 (1.00) |
1 (1.00) |
1 (1.00) |
1 (1.00) |
0.679 (1.00) |
0.316 (1.00) |
0.00905 (1.00) |
0.818 (1.00) |
0.371 (1.00) |
0.373 (1.00) |
0.768 (1.00) |
|
| LYPD3 | 3 (1%) | 286 |
0.883 (1.00) |
0.312 (1.00) |
1 (1.00) |
0.0253 (1.00) |
1 (1.00) |
1 (1.00) |
0.634 (1.00) |
1 (1.00) |
0.825 (1.00) |
0.211 (1.00) |
0.492 (1.00) |
0.973 (1.00) |
0.108 (1.00) |
0.00308 (1.00) |
|
| TMEM90B | 3 (1%) | 286 |
0.883 (1.00) |
0.369 (1.00) |
0.574 (1.00) |
0.262 (1.00) |
1 (1.00) |
1 (1.00) |
0.634 (1.00) |
0.267 (1.00) |
0.825 (1.00) |
1 (1.00) |
0.492 (1.00) |
0.661 (1.00) |
0.108 (1.00) |
||
| ZNF799 | 4 (1%) | 285 |
0.739 (1.00) |
0.589 (1.00) |
1 (1.00) |
1 (1.00) |
1 (1.00) |
1 (1.00) |
1 (1.00) |
0.631 (1.00) |
0.0861 (1.00) |
1 (1.00) |
0.829 (1.00) |
0.624 (1.00) |
|||
| PPM1D | 5 (2%) | 284 |
0.658 (1.00) |
0.578 (1.00) |
1 (1.00) |
1 (1.00) |
1 (1.00) |
1 (1.00) |
1 (1.00) |
0.679 (1.00) |
0.185 (1.00) |
1 (1.00) |
0.0187 (1.00) |
0.11 (1.00) |
0.673 (1.00) |
0.875 (1.00) |
|
| SYNPO2L | 3 (1%) | 286 |
0.126 (1.00) |
0.19 (1.00) |
1 (1.00) |
0.672 (1.00) |
1 (1.00) |
0.0917 (1.00) |
1 (1.00) |
1 (1.00) |
0.492 (1.00) |
0.0149 (1.00) |
0.141 (1.00) |
1 (1.00) |
0.934 (1.00) |
||
| KRAS | 3 (1%) | 286 |
0.901 (1.00) |
0.919 (1.00) |
0.574 (1.00) |
0.385 (1.00) |
1 (1.00) |
1 (1.00) |
0.634 (1.00) |
0.825 (1.00) |
0.973 (1.00) |
0.608 (1.00) |
|||||
| SLC5A11 | 3 (1%) | 286 |
0.775 (1.00) |
0.261 (1.00) |
0.574 (1.00) |
0.385 (1.00) |
1 (1.00) |
1 (1.00) |
1 (1.00) |
0.603 (1.00) |
0.694 (1.00) |
1 (1.00) |
0.973 (1.00) |
1 (1.00) |
|||
| PRG4 | 3 (1%) | 286 |
0.756 (1.00) |
0.703 (1.00) |
1 (1.00) |
0.0939 (1.00) |
1 (1.00) |
1 (1.00) |
0.16 (1.00) |
0.603 (1.00) |
0.355 (1.00) |
1 (1.00) |
0.979 (1.00) |
0.973 (1.00) |
0.108 (1.00) |
0.0151 (1.00) |
|
| SCUBE2 | 3 (1%) | 286 |
0.75 (1.00) |
0.48 (1.00) |
1 (1.00) |
0.672 (1.00) |
1 (1.00) |
1 (1.00) |
0.634 (1.00) |
1 (1.00) |
0.421 (1.00) |
1 (1.00) |
0.833 (1.00) |
0.608 (1.00) |
0.0981 (1.00) |
||
| SLC26A11 | 3 (1%) | 286 |
0.812 (1.00) |
0.368 (1.00) |
0.158 (1.00) |
0.0939 (1.00) |
1 (1.00) |
1 (1.00) |
0.16 (1.00) |
0.603 (1.00) |
0.825 (1.00) |
1 (1.00) |
0.322 (1.00) |
0.772 (1.00) |
0.608 (1.00) |
0.16 (1.00) |
|
| ANKRD30A | 4 (1%) | 285 |
0.627 (1.00) |
0.116 (1.00) |
1 (1.00) |
1 (1.00) |
1 (1.00) |
1 (1.00) |
0.404 (1.00) |
1 (1.00) |
0.536 (1.00) |
1 (1.00) |
0.614 (1.00) |
0.803 (1.00) |
1 (1.00) |
||
| FAM155A | 3 (1%) | 286 |
0.858 (1.00) |
0.201 (1.00) |
1 (1.00) |
0.672 (1.00) |
1 (1.00) |
1 (1.00) |
0.286 (1.00) |
0.603 (1.00) |
0.825 (1.00) |
1 (1.00) |
0.651 (1.00) |
0.973 (1.00) |
0.108 (1.00) |
||
| ZFHX3 | 6 (2%) | 283 |
0.871 (1.00) |
0.559 (1.00) |
1 (1.00) |
0.277 (1.00) |
0.226 (1.00) |
1 (1.00) |
0.716 (1.00) |
0.124 (1.00) |
0.126 (1.00) |
0.66 (1.00) |
0.581 (1.00) |
0.681 (1.00) |
0.107 (1.00) |
0.367 (1.00) |
|
| ARMCX3 | 3 (1%) | 286 |
0.836 (1.00) |
0.5 (1.00) |
0.574 (1.00) |
1 (1.00) |
1 (1.00) |
1 (1.00) |
1 (1.00) |
0.603 (1.00) |
0.492 (1.00) |
1 (1.00) |
0.772 (1.00) |
1 (1.00) |
0.0278 (1.00) |
||
| COL5A3 | 5 (2%) | 284 |
0.755 (1.00) |
0.377 (1.00) |
0.335 (1.00) |
0.458 (1.00) |
1 (1.00) |
1 (1.00) |
0.424 (1.00) |
1 (1.00) |
0.843 (1.00) |
0.592 (1.00) |
0.166 (1.00) |
0.752 (1.00) |
0.197 (1.00) |
0.096 (1.00) |
|
| CDC27 | 3 (1%) | 286 |
0.667 (1.00) |
0.824 (1.00) |
0.574 (1.00) |
1 (1.00) |
1 (1.00) |
0.135 (1.00) |
0.634 (1.00) |
1 (1.00) |
0.492 (1.00) |
1 (1.00) |
0.892 (1.00) |
0.608 (1.00) |
P value = 7.79e-16 (Fisher's exact test), Q value = 3.4e-13
Table S1. Gene #1: 'BRAF MUTATION STATUS' versus Clinical Feature #4: 'HISTOLOGICAL.TYPE'
| nPatients | OTHER SPECIFY | THYROID PAPILLARY CARCINOMA - CLASSICAL/USUAL | THYROID PAPILLARY CARCINOMA - FOLLICULAR (>= 99% FOLLICULAR PATTERNED) | THYROID PAPILLARY CARCINOMA - TALL CELL (>= 50% TALL CELL FEATURES) |
|---|---|---|---|---|
| ALL | 5 | 191 | 72 | 21 |
| BRAF MUTATED | 1 | 134 | 14 | 19 |
| BRAF WILD-TYPE | 4 | 57 | 58 | 2 |
Figure S1. Get High-res Image Gene #1: 'BRAF MUTATION STATUS' versus Clinical Feature #4: 'HISTOLOGICAL.TYPE'
P value = 1.85e-08 (Fisher's exact test), Q value = 8.1e-06
Table S2. Gene #1: 'BRAF MUTATION STATUS' versus Clinical Feature #8: 'EXTRATHYROIDAL.EXTENSION'
| nPatients | MINIMAL (T3) | MODERATE/ADVANCED (T4A) | NONE | VERY ADVANCED (T4B) |
|---|---|---|---|---|
| ALL | 75 | 8 | 193 | 1 |
| BRAF MUTATED | 62 | 8 | 94 | 0 |
| BRAF WILD-TYPE | 13 | 0 | 99 | 1 |
Figure S2. Get High-res Image Gene #1: 'BRAF MUTATION STATUS' versus Clinical Feature #8: 'EXTRATHYROIDAL.EXTENSION'
P value = 6.67e-06 (Fisher's exact test), Q value = 0.0029
Table S3. Gene #4: 'NRAS MUTATION STATUS' versus Clinical Feature #4: 'HISTOLOGICAL.TYPE'
| nPatients | OTHER SPECIFY | THYROID PAPILLARY CARCINOMA - CLASSICAL/USUAL | THYROID PAPILLARY CARCINOMA - FOLLICULAR (>= 99% FOLLICULAR PATTERNED) | THYROID PAPILLARY CARCINOMA - TALL CELL (>= 50% TALL CELL FEATURES) |
|---|---|---|---|---|
| ALL | 5 | 191 | 72 | 21 |
| NRAS MUTATED | 0 | 6 | 17 | 0 |
| NRAS WILD-TYPE | 5 | 185 | 55 | 21 |
Figure S3. Get High-res Image Gene #4: 'NRAS MUTATION STATUS' versus Clinical Feature #4: 'HISTOLOGICAL.TYPE'
P value = 0.000295 (t-test), Q value = 0.13
Table S4. Gene #15: 'PPTC7 MUTATION STATUS' versus Clinical Feature #11: 'NUMBER.OF.LYMPH.NODES'
| nPatients | Mean (Std.Dev) | |
|---|---|---|
| ALL | 224 | 3.0 (5.3) |
| PPTC7 MUTATED | 3 | 0.3 (0.6) |
| PPTC7 WILD-TYPE | 221 | 3.1 (5.4) |
Figure S4. Get High-res Image Gene #15: 'PPTC7 MUTATION STATUS' versus Clinical Feature #11: 'NUMBER.OF.LYMPH.NODES'
P value = 6.08e-07 (t-test), Q value = 0.00027
Table S5. Gene #22: 'ATAD2 MUTATION STATUS' versus Clinical Feature #11: 'NUMBER.OF.LYMPH.NODES'
| nPatients | Mean (Std.Dev) | |
|---|---|---|
| ALL | 224 | 3.0 (5.3) |
| ATAD2 MUTATED | 4 | 0.2 (0.5) |
| ATAD2 WILD-TYPE | 220 | 3.1 (5.4) |
Figure S5. Get High-res Image Gene #22: 'ATAD2 MUTATION STATUS' versus Clinical Feature #11: 'NUMBER.OF.LYMPH.NODES'
-
Mutation data file = THCA-TP.mutsig.cluster.txt
-
Clinical data file = THCA-TP.clin.merged.picked.txt
-
Number of patients = 289
-
Number of significantly mutated genes = 33
-
Number of selected clinical features = 15
-
Exclude genes that fewer than K tumors have mutations, K = 3
For survival clinical features, the Kaplan-Meier survival curves of tumors with and without gene mutations were plotted and the statistical significance P values were estimated by logrank test (Bland and Altman 2004) using the 'survdiff' function in R
For continuous numerical clinical features, two-tailed Student's t test with unequal variance (Lehmann and Romano 2005) was applied to compare the clinical values between tumors with and without gene mutations using 't.test' function in R
For binary or multi-class clinical features (nominal or ordinal), two-tailed Fisher's exact tests (Fisher 1922) were used to estimate the P values using the 'fisher.test' function in R
For multi-class clinical features (nominal or ordinal), Chi-square tests (Greenwood and Nikulin 1996) were used to estimate the P values using the 'chisq.test' function in R
For multiple hypothesis correction, Q value is the False Discovery Rate (FDR) analogue of the P value (Benjamini and Hochberg 1995), defined as the minimum FDR at which the test may be called significant. We used the 'Benjamini and Hochberg' method of 'p.adjust' function in R to convert P values into Q values.
This is an experimental feature. The full results of the analysis summarized in this report can be downloaded from the TCGA Data Coordination Center.