This pipeline uses various statistical tests to identify miRs whose expression levels correlated to selected clinical features.
Testing the association between 556 genes and 5 clinical features across 453 samples, statistically thresholded by Q value < 0.05, 4 clinical features related to at least one genes.
-
4 genes correlated to 'Time to Death'.
-
HSA-LET-7G , HSA-MIR-576 , HSA-MIR-628 , HSA-MIR-30E
-
52 genes correlated to 'AGE'.
-
HSA-MIR-424 , HSA-MIR-1247 , HSA-MIR-337 , HSA-MIR-214 , HSA-MIR-199A-1 , ...
-
92 genes correlated to 'HISTOLOGICAL.TYPE'.
-
HSA-MIR-9-3 , HSA-MIR-9-2 , HSA-MIR-9-1 , HSA-MIR-934 , HSA-MIR-34A , ...
-
7 genes correlated to 'RADIATIONS.RADIATION.REGIMENINDICATION'.
-
HSA-MIR-3613 , HSA-MIR-128-1 , HSA-MIR-628 , HSA-MIR-128-2 , HSA-MIR-107 , ...
-
No genes correlated to 'COMPLETENESS.OF.RESECTION'
Complete statistical result table is provided in Supplement Table 1
Table 1. Get Full Table This table shows the clinical features, statistical methods used, and the number of genes that are significantly associated with each clinical feature at Q value < 0.05.
| Clinical feature | Statistical test | Significant genes | Associated with | Associated with | ||
|---|---|---|---|---|---|---|
| Time to Death | Cox regression test | N=4 | shorter survival | N=0 | longer survival | N=4 |
| AGE | Spearman correlation test | N=52 | older | N=5 | younger | N=47 |
| HISTOLOGICAL TYPE | ANOVA test | N=92 | ||||
| RADIATIONS RADIATION REGIMENINDICATION | t test | N=7 | yes | N=5 | no | N=2 |
| COMPLETENESS OF RESECTION | ANOVA test | N=0 |
Table S1. Basic characteristics of clinical feature: 'Time to Death'
| Time to Death | Duration (Months) | 0-187.1 (median=15.3) |
| censored | N = 408 | |
| death | N = 41 | |
| Significant markers | N = 4 | |
| associated with shorter survival | 0 | |
| associated with longer survival | 4 |
Table S2. Get Full Table List of 4 genes significantly associated with 'Time to Death' by Cox regression test
| HazardRatio | Wald_P | Q | C_index | |
|---|---|---|---|---|
| HSA-LET-7G | 0.46 | 1.176e-05 | 0.0065 | 0.298 |
| HSA-MIR-576 | 0.53 | 1.264e-05 | 0.007 | 0.317 |
| HSA-MIR-628 | 0.64 | 2.025e-05 | 0.011 | 0.296 |
| HSA-MIR-30E | 0.34 | 4.345e-05 | 0.024 | 0.314 |
Figure S1. Get High-res Image As an example, this figure shows the association of HSA-LET-7G to 'Time to Death'. four curves present the cumulative survival rates of 4 quartile subsets of patients. P value = 1.18e-05 with univariate Cox regression analysis using continuous log-2 expression values.

Table S3. Basic characteristics of clinical feature: 'AGE'
| AGE | Mean (SD) | 63.53 (11) |
| Significant markers | N = 52 | |
| pos. correlated | 5 | |
| neg. correlated | 47 |
Table S4. Get Full Table List of top 10 genes significantly correlated to 'AGE' by Spearman correlation test
| SpearmanCorr | corrP | Q | |
|---|---|---|---|
| HSA-MIR-424 | -0.3183 | 4.202e-12 | 2.34e-09 |
| HSA-MIR-1247 | -0.2805 | 1.523e-09 | 8.45e-07 |
| HSA-MIR-337 | -0.2665 | 8.642e-09 | 4.79e-06 |
| HSA-MIR-214 | -0.2618 | 1.676e-08 | 9.27e-06 |
| HSA-MIR-199A-1 | -0.2608 | 1.837e-08 | 1.01e-05 |
| HSA-MIR-199A-2 | -0.254 | 4.351e-08 | 2.4e-05 |
| HSA-MIR-409 | -0.2525 | 5.25e-08 | 2.89e-05 |
| HSA-MIR-34A | -0.2523 | 5.389e-08 | 2.96e-05 |
| HSA-MIR-134 | -0.2491 | 8.018e-08 | 4.39e-05 |
| HSA-MIR-199B | -0.2475 | 9.736e-08 | 5.33e-05 |
Figure S2. Get High-res Image As an example, this figure shows the association of HSA-MIR-424 to 'AGE'. P value = 4.2e-12 with Spearman correlation analysis. The straight line presents the best linear regression.
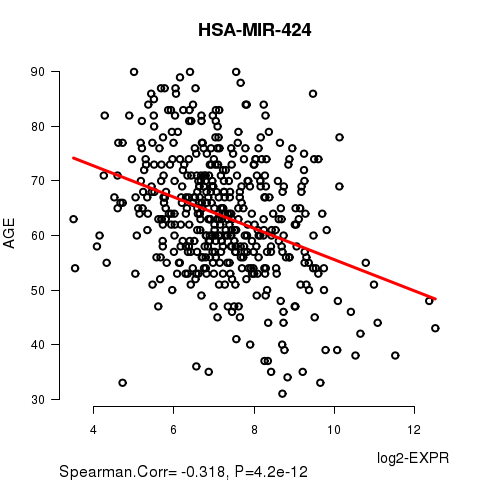
Table S5. Basic characteristics of clinical feature: 'HISTOLOGICAL.TYPE'
| HISTOLOGICAL.TYPE | Labels | N |
| ENDOMETRIOID ENDOMETRIAL ADENOCARCINOMA | 354 | |
| MIXED SEROUS AND ENDOMETRIOID | 18 | |
| SEROUS ENDOMETRIAL ADENOCARCINOMA | 81 | |
| Significant markers | N = 92 |
Table S6. Get Full Table List of top 10 genes differentially expressed by 'HISTOLOGICAL.TYPE'
| ANOVA_P | Q | |
|---|---|---|
| HSA-MIR-9-3 | 7.413e-32 | 4.12e-29 |
| HSA-MIR-9-2 | 2.39e-28 | 1.33e-25 |
| HSA-MIR-9-1 | 2.754e-28 | 1.53e-25 |
| HSA-MIR-934 | 1.226e-23 | 6.78e-21 |
| HSA-MIR-34A | 2.866e-23 | 1.58e-20 |
| HSA-MIR-375 | 5.156e-20 | 2.84e-17 |
| HSA-MIR-195 | 2.24e-18 | 1.23e-15 |
| HSA-MIR-190B | 3.621e-18 | 1.99e-15 |
| HSA-MIR-497 | 1.715e-17 | 9.4e-15 |
| HSA-MIR-548V | 1.186e-16 | 6.49e-14 |
Figure S3. Get High-res Image As an example, this figure shows the association of HSA-MIR-9-3 to 'HISTOLOGICAL.TYPE'. P value = 7.41e-32 with ANOVA analysis.

7 genes related to 'RADIATIONS.RADIATION.REGIMENINDICATION'.
Table S7. Basic characteristics of clinical feature: 'RADIATIONS.RADIATION.REGIMENINDICATION'
| RADIATIONS.RADIATION.REGIMENINDICATION | Labels | N |
| NO | 130 | |
| YES | 323 | |
| Significant markers | N = 7 | |
| Higher in YES | 5 | |
| Higher in NO | 2 |
Table S8. Get Full Table List of 7 genes differentially expressed by 'RADIATIONS.RADIATION.REGIMENINDICATION'
| T(pos if higher in 'YES') | ttestP | Q | AUC | |
|---|---|---|---|---|
| HSA-MIR-3613 | -5.31 | 2.194e-07 | 0.000122 | 0.6571 |
| HSA-MIR-128-1 | 4.7 | 3.906e-06 | 0.00217 | 0.6376 |
| HSA-MIR-628 | -4.64 | 5.384e-06 | 0.00298 | 0.6252 |
| HSA-MIR-128-2 | 4.57 | 7.231e-06 | 0.004 | 0.6312 |
| HSA-MIR-107 | 4.17 | 4.079e-05 | 0.0225 | 0.61 |
| HSA-MIR-361 | 4.16 | 4.363e-05 | 0.024 | 0.6125 |
| HSA-MIR-181D | 4.08 | 5.882e-05 | 0.0323 | 0.6199 |
Figure S4. Get High-res Image As an example, this figure shows the association of HSA-MIR-3613 to 'RADIATIONS.RADIATION.REGIMENINDICATION'. P value = 2.19e-07 with T-test analysis.

-
Expresson data file = UCEC-TP.miRseq_RPKM_log2.txt
-
Clinical data file = UCEC-TP.clin.merged.picked.txt
-
Number of patients = 453
-
Number of genes = 556
-
Number of clinical features = 5
For survival clinical features, Wald's test in univariate Cox regression analysis with proportional hazards model (Andersen and Gill 1982) was used to estimate the P values using the 'coxph' function in R. Kaplan-Meier survival curves were plot using the four quartile subgroups of patients based on expression levels
For continuous numerical clinical features, Spearman's rank correlation coefficients (Spearman 1904) and two-tailed P values were estimated using 'cor.test' function in R
For multi-class clinical features (ordinal or nominal), one-way analysis of variance (Howell 2002) was applied to compare the log2-expression levels between different clinical classes using 'anova' function in R
For two-class clinical features, two-tailed Student's t test with unequal variance (Lehmann and Romano 2005) was applied to compare the log2-expression levels between the two clinical classes using 't.test' function in R
For multiple hypothesis correction, Q value is the False Discovery Rate (FDR) analogue of the P value (Benjamini and Hochberg 1995), defined as the minimum FDR at which the test may be called significant. We used the 'Benjamini and Hochberg' method of 'p.adjust' function in R to convert P values into Q values.
This is an experimental feature. The full results of the analysis summarized in this report can be downloaded from the TCGA Data Coordination Center.