This pipeline computes the correlation between significant arm-level copy number variations (cnvs) and selected clinical features.
Testing the association between copy number variation 75 arm-level results and 10 clinical features across 134 patients, 8 significant findings detected with Q value < 0.25.
-
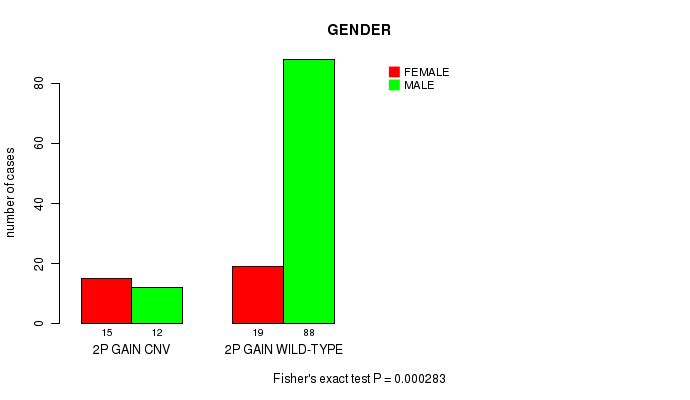
2p gain cnv correlated to 'GENDER'.
-
4p gain cnv correlated to 'NUMBER.OF.LYMPH.NODES'.
-
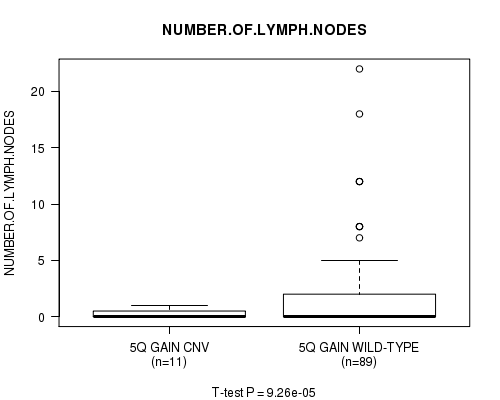
5q gain cnv correlated to 'NUMBER.OF.LYMPH.NODES'.
-
9q gain cnv correlated to 'NUMBER.OF.LYMPH.NODES'.
-
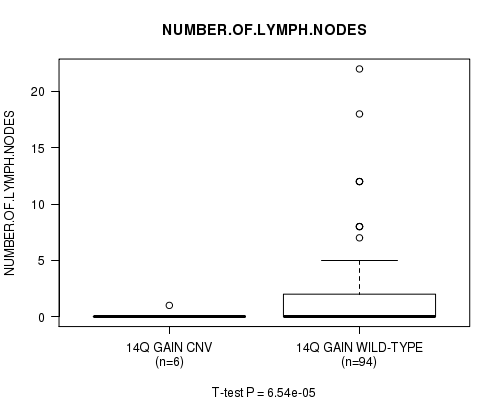
14q gain cnv correlated to 'NUMBER.OF.LYMPH.NODES'.
-
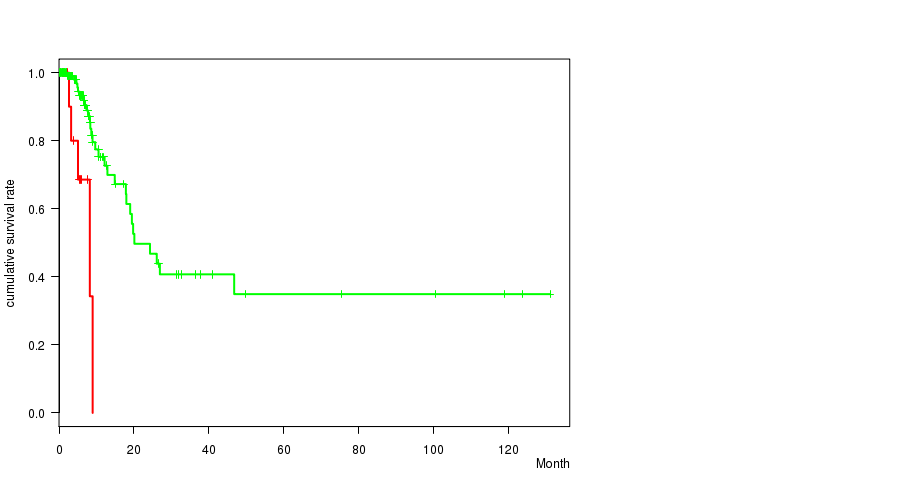
16p gain cnv correlated to 'Time to Death'.
-
16q gain cnv correlated to 'Time to Death'.
-
17p gain cnv correlated to 'NUMBER.OF.LYMPH.NODES'.
Table 1. Get Full Table Overview of the association between significant copy number variation of 75 arm-level results and 10 clinical features. Shown in the table are P values (Q values). Thresholded by Q value < 0.25, 8 significant findings detected.
|
Clinical Features |
Time to Death |
AGE | GENDER |
KARNOFSKY PERFORMANCE SCORE |
NUMBERPACKYEARSSMOKED |
DISTANT METASTASIS |
LYMPH NODE METASTASIS |
NUMBER OF LYMPH NODES |
TUMOR STAGECODE |
NEOPLASM DISEASESTAGE |
||
| nCNV (%) | nWild-Type | logrank test | t-test | Fisher's exact test | t-test | t-test | Fisher's exact test | Chi-square test | t-test | t-test | Fisher's exact test | |
| 2p gain | 0 (0%) | 107 |
0.735 (1.00) |
0.328 (1.00) |
0.000283 (0.182) |
0.936 (1.00) |
0.841 (1.00) |
0.675 (1.00) |
0.469 (1.00) |
0.556 (1.00) |
0.642 (1.00) |
|
| 4p gain | 0 (0%) | 126 |
0.0898 (1.00) |
0.784 (1.00) |
0.679 (1.00) |
0.369 (1.00) |
0.239 (1.00) |
0.39 (1.00) |
0.000194 (0.125) |
0.263 (1.00) |
||
| 5q gain | 0 (0%) | 117 |
0.355 (1.00) |
0.511 (1.00) |
0.237 (1.00) |
0.273 (1.00) |
0.886 (1.00) |
1 (1.00) |
0.0776 (1.00) |
9.26e-05 (0.0598) |
0.0512 (1.00) |
|
| 9q gain | 0 (0%) | 122 |
0.0822 (1.00) |
0.169 (1.00) |
0.499 (1.00) |
0.796 (1.00) |
0.182 (1.00) |
0.203 (1.00) |
0.117 (1.00) |
2.3e-06 (0.00149) |
0.00102 (0.651) |
|
| 14q gain | 0 (0%) | 123 |
0.946 (1.00) |
0.591 (1.00) |
0.469 (1.00) |
0.487 (1.00) |
0.32 (1.00) |
0.483 (1.00) |
0.393 (1.00) |
6.54e-05 (0.0423) |
0.437 (1.00) |
|
| 16p gain | 0 (0%) | 125 |
6.44e-07 (0.000419) |
0.454 (1.00) |
0.231 (1.00) |
0.458 (1.00) |
0.207 (1.00) |
0.0949 (1.00) |
0.816 (1.00) |
0.0707 (1.00) |
0.554 (1.00) |
|
| 16q gain | 0 (0%) | 122 |
6.18e-05 (0.04) |
0.292 (1.00) |
0.0745 (1.00) |
0.48 (1.00) |
0.424 (1.00) |
0.404 (1.00) |
0.688 (1.00) |
0.0545 (1.00) |
0.768 (1.00) |
|
| 17p gain | 0 (0%) | 127 |
0.0468 (1.00) |
0.946 (1.00) |
0.369 (1.00) |
0.992 (1.00) |
0.327 (1.00) |
0.63 (1.00) |
2.43e-06 (0.00158) |
0.0206 (1.00) |
||
| 1p gain | 0 (0%) | 118 |
0.0182 (1.00) |
0.82 (1.00) |
0.551 (1.00) |
0.731 (1.00) |
0.517 (1.00) |
0.698 (1.00) |
0.0776 (1.00) |
0.539 (1.00) |
0.29 (1.00) |
|
| 1q gain | 0 (0%) | 103 |
0.00755 (1.00) |
0.0539 (1.00) |
1 (1.00) |
0.408 (1.00) |
0.692 (1.00) |
0.149 (1.00) |
0.0693 (1.00) |
0.821 (1.00) |
0.162 (1.00) |
|
| 2q gain | 0 (0%) | 124 |
0.596 (1.00) |
0.594 (1.00) |
0.714 (1.00) |
0.238 (1.00) |
0.426 (1.00) |
0.637 (1.00) |
0.315 (1.00) |
0.314 (1.00) |
0.12 (1.00) |
|
| 3p gain | 0 (0%) | 106 |
0.994 (1.00) |
0.407 (1.00) |
0.634 (1.00) |
0.514 (1.00) |
0.907 (1.00) |
0.927 (1.00) |
0.115 (1.00) |
0.248 (1.00) |
0.0213 (1.00) |
|
| 3q gain | 0 (0%) | 95 |
0.279 (1.00) |
0.325 (1.00) |
0.194 (1.00) |
0.778 (1.00) |
0.86 (1.00) |
0.272 (1.00) |
0.107 (1.00) |
0.255 (1.00) |
0.099 (1.00) |
|
| 4q gain | 0 (0%) | 131 |
0.301 (1.00) |
0.53 (1.00) |
1 (1.00) |
0.274 (1.00) |
1 (1.00) |
0.682 (1.00) |
0.394 (1.00) |
|||
| 5p gain | 0 (0%) | 95 |
0.549 (1.00) |
0.414 (1.00) |
0.514 (1.00) |
0.161 (1.00) |
0.642 (1.00) |
1 (1.00) |
0.0036 (1.00) |
0.324 (1.00) |
0.421 (1.00) |
|
| 6p gain | 0 (0%) | 124 |
0.492 (1.00) |
0.605 (1.00) |
1 (1.00) |
0.63 (1.00) |
0.701 (1.00) |
1 (1.00) |
0.197 (1.00) |
0.127 (1.00) |
0.789 (1.00) |
|
| 6q gain | 0 (0%) | 129 |
0.104 (1.00) |
0.927 (1.00) |
0.329 (1.00) |
0.807 (1.00) |
0.71 (1.00) |
0.00808 (1.00) |
0.0065 (1.00) |
0.46 (1.00) |
||
| 7p gain | 0 (0%) | 94 |
0.436 (1.00) |
0.201 (1.00) |
0.516 (1.00) |
0.111 (1.00) |
0.45 (1.00) |
0.38 (1.00) |
0.637 (1.00) |
0.847 (1.00) |
0.217 (1.00) |
|
| 7q gain | 0 (0%) | 98 |
0.273 (1.00) |
0.508 (1.00) |
0.0428 (1.00) |
0.111 (1.00) |
0.219 (1.00) |
0.528 (1.00) |
0.427 (1.00) |
0.565 (1.00) |
0.275 (1.00) |
|
| 8p gain | 0 (0%) | 119 |
0.728 (1.00) |
0.325 (1.00) |
0.76 (1.00) |
0.7 (1.00) |
0.182 (1.00) |
0.88 (1.00) |
0.678 (1.00) |
0.00571 (1.00) |
0.756 (1.00) |
|
| 8q gain | 0 (0%) | 93 |
0.672 (1.00) |
0.832 (1.00) |
1 (1.00) |
0.818 (1.00) |
0.347 (1.00) |
0.484 (1.00) |
0.912 (1.00) |
0.148 (1.00) |
0.317 (1.00) |
|
| 9p gain | 0 (0%) | 121 |
0.0366 (1.00) |
0.0212 (1.00) |
0.183 (1.00) |
0.825 (1.00) |
0.0302 (1.00) |
0.398 (1.00) |
0.695 (1.00) |
0.0016 (1.00) |
0.0944 (1.00) |
|
| 10p gain | 0 (0%) | 109 |
0.83 (1.00) |
0.939 (1.00) |
0.615 (1.00) |
0.76 (1.00) |
0.524 (1.00) |
0.556 (1.00) |
0.358 (1.00) |
0.65 (1.00) |
0.0713 (1.00) |
|
| 10q gain | 0 (0%) | 127 |
0.423 (1.00) |
0.108 (1.00) |
1 (1.00) |
0.672 (1.00) |
0.424 (1.00) |
0.207 (1.00) |
0.532 (1.00) |
0.274 (1.00) |
||
| 11p gain | 0 (0%) | 128 |
0.0631 (1.00) |
0.102 (1.00) |
0.337 (1.00) |
0.0776 (1.00) |
0.602 (1.00) |
0.748 (1.00) |
0.384 (1.00) |
0.104 (1.00) |
0.529 (1.00) |
|
| 11q gain | 0 (0%) | 126 |
0.264 (1.00) |
0.645 (1.00) |
0.202 (1.00) |
0.663 (1.00) |
0.918 (1.00) |
1 (1.00) |
0.116 (1.00) |
0.305 (1.00) |
0.383 (1.00) |
|
| 12p gain | 0 (0%) | 109 |
0.786 (1.00) |
0.641 (1.00) |
0.8 (1.00) |
0.26 (1.00) |
0.862 (1.00) |
0.785 (1.00) |
0.861 (1.00) |
0.00736 (1.00) |
0.166 (1.00) |
|
| 12q gain | 0 (0%) | 116 |
0.198 (1.00) |
0.559 (1.00) |
0.561 (1.00) |
0.358 (1.00) |
0.415 (1.00) |
0.32 (1.00) |
0.747 (1.00) |
0.0542 (1.00) |
0.0445 (1.00) |
|
| 13q gain | 0 (0%) | 112 |
0.773 (1.00) |
0.707 (1.00) |
0.794 (1.00) |
0.602 (1.00) |
0.189 (1.00) |
0.28 (1.00) |
0.661 (1.00) |
0.975 (1.00) |
0.778 (1.00) |
|
| 15q gain | 0 (0%) | 130 |
0.0949 (1.00) |
0.846 (1.00) |
1 (1.00) |
0.272 (1.00) |
0.613 (1.00) |
0.911 (1.00) |
1 (1.00) |
|||
| 17q gain | 0 (0%) | 111 |
0.805 (1.00) |
0.853 (1.00) |
1 (1.00) |
0.217 (1.00) |
0.504 (1.00) |
0.36 (1.00) |
0.104 (1.00) |
0.908 (1.00) |
0.0503 (1.00) |
|
| 18p gain | 0 (0%) | 112 |
0.723 (1.00) |
0.879 (1.00) |
0.434 (1.00) |
0.451 (1.00) |
0.467 (1.00) |
0.449 (1.00) |
0.458 (1.00) |
0.739 (1.00) |
0.828 (1.00) |
|
| 18q gain | 0 (0%) | 127 |
0.0328 (1.00) |
0.755 (1.00) |
1 (1.00) |
0.815 (1.00) |
0.257 (1.00) |
0.884 (1.00) |
0.276 (1.00) |
0.803 (1.00) |
||
| 19p gain | 0 (0%) | 123 |
0.108 (1.00) |
0.853 (1.00) |
0.729 (1.00) |
0.238 (1.00) |
0.362 (1.00) |
1 (1.00) |
0.845 (1.00) |
0.0498 (1.00) |
0.314 (1.00) |
|
| 19q gain | 0 (0%) | 109 |
0.345 (1.00) |
0.951 (1.00) |
0.205 (1.00) |
0.319 (1.00) |
0.473 (1.00) |
0.852 (1.00) |
0.992 (1.00) |
0.635 (1.00) |
0.582 (1.00) |
|
| 20p gain | 0 (0%) | 84 |
0.157 (1.00) |
0.917 (1.00) |
0.219 (1.00) |
0.693 (1.00) |
0.428 (1.00) |
0.0958 (1.00) |
0.762 (1.00) |
0.396 (1.00) |
0.471 (1.00) |
|
| 20q gain | 0 (0%) | 79 |
0.931 (1.00) |
0.441 (1.00) |
0.84 (1.00) |
0.533 (1.00) |
0.269 (1.00) |
0.704 (1.00) |
0.925 (1.00) |
0.431 (1.00) |
0.315 (1.00) |
|
| 21q gain | 0 (0%) | 108 |
0.341 (1.00) |
0.535 (1.00) |
0.807 (1.00) |
0.981 (1.00) |
0.693 (1.00) |
0.729 (1.00) |
0.13 (1.00) |
0.834 (1.00) |
0.0409 (1.00) |
|
| 22q gain | 0 (0%) | 123 |
0.0752 (1.00) |
0.518 (1.00) |
0.729 (1.00) |
0.584 (1.00) |
0.466 (1.00) |
0.841 (1.00) |
0.293 (1.00) |
0.555 (1.00) |
0.789 (1.00) |
|
| Xq gain | 0 (0%) | 128 |
0.0344 (1.00) |
0.737 (1.00) |
0.643 (1.00) |
0.492 (1.00) |
0.379 (1.00) |
0.161 (1.00) |
0.0968 (1.00) |
0.529 (1.00) |
||
| 1p loss | 0 (0%) | 131 |
0.66 (1.00) |
0.826 (1.00) |
0.571 (1.00) |
0.184 (1.00) |
0.109 (1.00) |
0.0873 (1.00) |
0.782 (1.00) |
|||
| 2p loss | 0 (0%) | 126 |
0.622 (1.00) |
0.581 (1.00) |
0.679 (1.00) |
0.86 (1.00) |
0.302 (1.00) |
0.303 (1.00) |
0.205 (1.00) |
0.322 (1.00) |
||
| 2q loss | 0 (0%) | 118 |
0.0294 (1.00) |
0.791 (1.00) |
0.357 (1.00) |
0.912 (1.00) |
0.191 (1.00) |
0.89 (1.00) |
0.0155 (1.00) |
0.123 (1.00) |
0.2 (1.00) |
|
| 3p loss | 0 (0%) | 125 |
0.968 (1.00) |
0.603 (1.00) |
0.231 (1.00) |
0.475 (1.00) |
1 (1.00) |
0.676 (1.00) |
0.852 (1.00) |
0.92 (1.00) |
||
| 4p loss | 0 (0%) | 108 |
0.427 (1.00) |
0.835 (1.00) |
1 (1.00) |
0.205 (1.00) |
0.473 (1.00) |
0.343 (1.00) |
0.0423 (1.00) |
0.25 (1.00) |
0.273 (1.00) |
|
| 4q loss | 0 (0%) | 110 |
0.729 (1.00) |
0.828 (1.00) |
0.796 (1.00) |
0.0822 (1.00) |
0.854 (1.00) |
0.283 (1.00) |
0.891 (1.00) |
0.793 (1.00) |
0.567 (1.00) |
|
| 5p loss | 0 (0%) | 121 |
0.109 (1.00) |
0.368 (1.00) |
0.0927 (1.00) |
0.0916 (1.00) |
0.849 (1.00) |
0.517 (1.00) |
0.927 (1.00) |
0.799 (1.00) |
0.436 (1.00) |
|
| 5q loss | 0 (0%) | 102 |
0.537 (1.00) |
0.587 (1.00) |
0.816 (1.00) |
0.285 (1.00) |
0.243 (1.00) |
0.0541 (1.00) |
0.133 (1.00) |
0.325 (1.00) |
0.227 (1.00) |
|
| 6p loss | 0 (0%) | 115 |
0.859 (1.00) |
0.594 (1.00) |
1 (1.00) |
0.0916 (1.00) |
0.599 (1.00) |
0.743 (1.00) |
0.0159 (1.00) |
0.269 (1.00) |
0.00639 (1.00) |
|
| 6q loss | 0 (0%) | 106 |
0.44 (1.00) |
0.723 (1.00) |
0.634 (1.00) |
0.204 (1.00) |
0.329 (1.00) |
0.243 (1.00) |
0.146 (1.00) |
0.272 (1.00) |
0.0447 (1.00) |
|
| 8p loss | 0 (0%) | 88 |
0.317 (1.00) |
0.57 (1.00) |
0.302 (1.00) |
0.37 (1.00) |
0.13 (1.00) |
0.246 (1.00) |
0.369 (1.00) |
0.891 (1.00) |
0.352 (1.00) |
|
| 8q loss | 0 (0%) | 128 |
0.913 (1.00) |
0.0889 (1.00) |
0.643 (1.00) |
0.835 (1.00) |
0.273 (1.00) |
0.691 (1.00) |
0.908 (1.00) |
0.252 (1.00) |
||
| 9p loss | 0 (0%) | 95 |
0.673 (1.00) |
0.546 (1.00) |
0.514 (1.00) |
0.403 (1.00) |
0.36 (1.00) |
0.14 (1.00) |
0.636 (1.00) |
0.972 (1.00) |
0.787 (1.00) |
|
| 9q loss | 0 (0%) | 98 |
0.777 (1.00) |
0.974 (1.00) |
0.185 (1.00) |
0.694 (1.00) |
0.179 (1.00) |
0.601 (1.00) |
0.529 (1.00) |
0.07 (1.00) |
0.576 (1.00) |
|
| 10p loss | 0 (0%) | 115 |
0.453 (1.00) |
0.992 (1.00) |
0.78 (1.00) |
0.0143 (1.00) |
0.887 (1.00) |
0.103 (1.00) |
0.898 (1.00) |
0.0426 (1.00) |
0.78 (1.00) |
|
| 10q loss | 0 (0%) | 106 |
0.212 (1.00) |
0.0214 (1.00) |
0.634 (1.00) |
0.12 (1.00) |
0.923 (1.00) |
0.498 (1.00) |
0.944 (1.00) |
0.763 (1.00) |
0.798 (1.00) |
|
| 11p loss | 0 (0%) | 90 |
0.716 (1.00) |
0.232 (1.00) |
1 (1.00) |
0.106 (1.00) |
0.992 (1.00) |
0.0242 (1.00) |
0.583 (1.00) |
0.228 (1.00) |
0.0167 (1.00) |
|
| 11q loss | 0 (0%) | 103 |
0.911 (1.00) |
0.549 (1.00) |
0.816 (1.00) |
0.75 (1.00) |
0.301 (1.00) |
0.401 (1.00) |
0.212 (1.00) |
0.269 (1.00) |
0.387 (1.00) |
|
| 12p loss | 0 (0%) | 129 |
0.974 (1.00) |
0.279 (1.00) |
0.329 (1.00) |
0.708 (1.00) |
1 (1.00) |
0.748 (1.00) |
0.887 (1.00) |
0.86 (1.00) |
||
| 12q loss | 0 (0%) | 128 |
0.155 (1.00) |
0.283 (1.00) |
0.337 (1.00) |
0.886 (1.00) |
0.748 (1.00) |
0.0801 (1.00) |
0.461 (1.00) |
0.193 (1.00) |
||
| 13q loss | 0 (0%) | 116 |
0.852 (1.00) |
0.744 (1.00) |
0.159 (1.00) |
0.0136 (1.00) |
0.686 (1.00) |
0.815 (1.00) |
0.787 (1.00) |
0.595 (1.00) |
0.533 (1.00) |
|
| 14q loss | 0 (0%) | 111 |
0.109 (1.00) |
0.196 (1.00) |
0.435 (1.00) |
0.748 (1.00) |
0.624 (1.00) |
0.518 (1.00) |
0.609 (1.00) |
0.757 (1.00) |
0.318 (1.00) |
|
| 15q loss | 0 (0%) | 119 |
0.46 (1.00) |
0.891 (1.00) |
0.53 (1.00) |
0.738 (1.00) |
0.849 (1.00) |
0.151 (1.00) |
0.938 (1.00) |
0.958 (1.00) |
0.673 (1.00) |
|
| 16p loss | 0 (0%) | 119 |
0.643 (1.00) |
0.485 (1.00) |
0.114 (1.00) |
0.217 (1.00) |
0.509 (1.00) |
0.88 (1.00) |
0.568 (1.00) |
0.952 (1.00) |
0.673 (1.00) |
|
| 16q loss | 0 (0%) | 118 |
0.566 (1.00) |
0.657 (1.00) |
0.357 (1.00) |
0.36 (1.00) |
0.876 (1.00) |
0.89 (1.00) |
0.107 (1.00) |
0.33 (1.00) |
0.427 (1.00) |
|
| 17p loss | 0 (0%) | 96 |
0.373 (1.00) |
0.485 (1.00) |
1 (1.00) |
0.8 (1.00) |
0.366 (1.00) |
0.537 (1.00) |
0.864 (1.00) |
0.792 (1.00) |
0.687 (1.00) |
|
| 17q loss | 0 (0%) | 128 |
0.845 (1.00) |
0.323 (1.00) |
1 (1.00) |
0.745 (1.00) |
0.349 (1.00) |
0.273 (1.00) |
0.0134 (1.00) |
0.529 (1.00) |
||
| 18p loss | 0 (0%) | 115 |
0.454 (1.00) |
0.0309 (1.00) |
0.571 (1.00) |
0.228 (1.00) |
0.615 (1.00) |
0.6 (1.00) |
0.704 (1.00) |
0.873 (1.00) |
0.476 (1.00) |
|
| 18q loss | 0 (0%) | 99 |
0.046 (1.00) |
0.033 (1.00) |
0.0733 (1.00) |
0.608 (1.00) |
0.292 (1.00) |
0.639 (1.00) |
0.848 (1.00) |
0.883 (1.00) |
0.379 (1.00) |
|
| 19p loss | 0 (0%) | 125 |
0.374 (1.00) |
0.727 (1.00) |
1 (1.00) |
0.941 (1.00) |
0.000749 (0.481) |
0.00196 (1.00) |
0.263 (1.00) |
0.00884 (1.00) |
||
| 19q loss | 0 (0%) | 130 |
0.00146 (0.935) |
0.934 (1.00) |
0.572 (1.00) |
0.402 (1.00) |
0.104 (1.00) |
0.15 (1.00) |
0.688 (1.00) |
0.471 (1.00) |
||
| 20p loss | 0 (0%) | 128 |
0.607 (1.00) |
0.275 (1.00) |
0.643 (1.00) |
0.00282 (1.00) |
0.71 (1.00) |
0.882 (1.00) |
0.72 (1.00) |
0.599 (1.00) |
||
| 21q loss | 0 (0%) | 121 |
0.975 (1.00) |
0.000675 (0.434) |
1 (1.00) |
0.000926 (0.594) |
0.869 (1.00) |
0.471 (1.00) |
0.114 (1.00) |
0.609 (1.00) |
0.433 (1.00) |
|
| 22q loss | 0 (0%) | 108 |
0.101 (1.00) |
0.757 (1.00) |
0.807 (1.00) |
0.34 (1.00) |
0.726 (1.00) |
0.268 (1.00) |
0.398 (1.00) |
0.653 (1.00) |
0.499 (1.00) |
|
| Xq loss | 0 (0%) | 131 |
0.332 (1.00) |
0.886 (1.00) |
1 (1.00) |
0.344 (1.00) |
0.611 (1.00) |
0.0437 (1.00) |
P value = 0.000283 (Fisher's exact test), Q value = 0.18
Table S1. Gene #3: '2p gain' versus Clinical Feature #3: 'GENDER'
| nPatients | FEMALE | MALE |
|---|---|---|
| ALL | 34 | 100 |
| 2P GAIN CNV | 15 | 12 |
| 2P GAIN WILD-TYPE | 19 | 88 |
Figure S1. Get High-res Image Gene #3: '2p gain' versus Clinical Feature #3: 'GENDER'
P value = 0.000194 (t-test), Q value = 0.13
Table S2. Gene #7: '4p gain' versus Clinical Feature #8: 'NUMBER.OF.LYMPH.NODES'
| nPatients | Mean (Std.Dev) | |
|---|---|---|
| ALL | 100 | 1.9 (3.7) |
| 4P GAIN CNV | 5 | 0.2 (0.4) |
| 4P GAIN WILD-TYPE | 95 | 1.9 (3.8) |
Figure S2. Get High-res Image Gene #7: '4p gain' versus Clinical Feature #8: 'NUMBER.OF.LYMPH.NODES'

P value = 9.26e-05 (t-test), Q value = 0.06
Table S3. Gene #10: '5q gain' versus Clinical Feature #8: 'NUMBER.OF.LYMPH.NODES'
| nPatients | Mean (Std.Dev) | |
|---|---|---|
| ALL | 100 | 1.9 (3.7) |
| 5Q GAIN CNV | 11 | 0.3 (0.5) |
| 5Q GAIN WILD-TYPE | 89 | 2.1 (3.9) |
Figure S3. Get High-res Image Gene #10: '5q gain' versus Clinical Feature #8: 'NUMBER.OF.LYMPH.NODES'
P value = 2.3e-06 (t-test), Q value = 0.0015
Table S4. Gene #18: '9q gain' versus Clinical Feature #8: 'NUMBER.OF.LYMPH.NODES'
| nPatients | Mean (Std.Dev) | |
|---|---|---|
| ALL | 100 | 1.9 (3.7) |
| 9Q GAIN CNV | 9 | 0.0 (0.0) |
| 9Q GAIN WILD-TYPE | 91 | 2.0 (3.9) |
Figure S4. Get High-res Image Gene #18: '9q gain' versus Clinical Feature #8: 'NUMBER.OF.LYMPH.NODES'

P value = 6.54e-05 (t-test), Q value = 0.042
Table S5. Gene #26: '14q gain' versus Clinical Feature #8: 'NUMBER.OF.LYMPH.NODES'
| nPatients | Mean (Std.Dev) | |
|---|---|---|
| ALL | 100 | 1.9 (3.7) |
| 14Q GAIN CNV | 6 | 0.2 (0.4) |
| 14Q GAIN WILD-TYPE | 94 | 2.0 (3.8) |
Figure S5. Get High-res Image Gene #26: '14q gain' versus Clinical Feature #8: 'NUMBER.OF.LYMPH.NODES'
P value = 6.44e-07 (logrank test), Q value = 0.00042
Table S6. Gene #28: '16p gain' versus Clinical Feature #1: 'Time to Death'
| nPatients | nDeath | Duration Range (Median), Month | |
|---|---|---|---|
| ALL | 127 | 34 | 0.1 - 131.2 (7.0) |
| 16P GAIN CNV | 9 | 6 | 2.2 - 9.7 (5.1) |
| 16P GAIN WILD-TYPE | 118 | 28 | 0.1 - 131.2 (7.1) |
Figure S6. Get High-res Image Gene #28: '16p gain' versus Clinical Feature #1: 'Time to Death'

P value = 6.18e-05 (logrank test), Q value = 0.04
Table S7. Gene #29: '16q gain' versus Clinical Feature #1: 'Time to Death'
| nPatients | nDeath | Duration Range (Median), Month | |
|---|---|---|---|
| ALL | 127 | 34 | 0.1 - 131.2 (7.0) |
| 16Q GAIN CNV | 12 | 5 | 0.8 - 9.0 (5.3) |
| 16Q GAIN WILD-TYPE | 115 | 29 | 0.1 - 131.2 (7.2) |
Figure S7. Get High-res Image Gene #29: '16q gain' versus Clinical Feature #1: 'Time to Death'
P value = 2.43e-06 (t-test), Q value = 0.0016
Table S8. Gene #30: '17p gain' versus Clinical Feature #8: 'NUMBER.OF.LYMPH.NODES'
| nPatients | Mean (Std.Dev) | |
|---|---|---|
| ALL | 100 | 1.9 (3.7) |
| 17P GAIN CNV | 5 | 0.0 (0.0) |
| 17P GAIN WILD-TYPE | 95 | 2.0 (3.8) |
Figure S8. Get High-res Image Gene #30: '17p gain' versus Clinical Feature #8: 'NUMBER.OF.LYMPH.NODES'

-
Mutation data file = broad_values_by_arm.mutsig.cluster.txt
-
Clinical data file = BLCA-TP.clin.merged.picked.txt
-
Number of patients = 134
-
Number of significantly arm-level cnvs = 75
-
Number of selected clinical features = 10
-
Exclude genes that fewer than K tumors have mutations, K = 3
For survival clinical features, the Kaplan-Meier survival curves of tumors with and without gene mutations were plotted and the statistical significance P values were estimated by logrank test (Bland and Altman 2004) using the 'survdiff' function in R
For continuous numerical clinical features, two-tailed Student's t test with unequal variance (Lehmann and Romano 2005) was applied to compare the clinical values between tumors with and without gene mutations using 't.test' function in R
For binary or multi-class clinical features (nominal or ordinal), two-tailed Fisher's exact tests (Fisher 1922) were used to estimate the P values using the 'fisher.test' function in R
For multi-class clinical features (nominal or ordinal), Chi-square tests (Greenwood and Nikulin 1996) were used to estimate the P values using the 'chisq.test' function in R
For multiple hypothesis correction, Q value is the False Discovery Rate (FDR) analogue of the P value (Benjamini and Hochberg 1995), defined as the minimum FDR at which the test may be called significant. We used the 'Benjamini and Hochberg' method of 'p.adjust' function in R to convert P values into Q values.
This is an experimental feature. The full results of the analysis summarized in this report can be downloaded from the TCGA Data Coordination Center.