This pipeline uses various statistical tests to identify genes whose promoter methylation levels correlated to selected clinical features.
Testing the association between 20188 genes and 9 clinical features across 134 samples, statistically thresholded by Q value < 0.05, 3 clinical features related to at least one genes.
-
11 genes correlated to 'GENDER'.
-
KIF4B , B3GNT1 , MTMR12 , ALG11__2 , UTP14C , ...
-
3 genes correlated to 'DISTANT.METASTASIS'.
-
TICAM1 , NBPF3 , SLC2A12
-
1 gene correlated to 'LYMPH.NODE.METASTASIS'.
-
FCHSD2
-
No genes correlated to 'Time to Death', 'AGE', 'KARNOFSKY.PERFORMANCE.SCORE', 'NUMBERPACKYEARSSMOKED', 'NUMBER.OF.LYMPH.NODES', and 'NEOPLASM.DISEASESTAGE'.
Complete statistical result table is provided in Supplement Table 1
Table 1. Get Full Table This table shows the clinical features, statistical methods used, and the number of genes that are significantly associated with each clinical feature at Q value < 0.05.
| Clinical feature | Statistical test | Significant genes | Associated with | Associated with | ||
|---|---|---|---|---|---|---|
| Time to Death | Cox regression test | N=0 | ||||
| AGE | Spearman correlation test | N=0 | ||||
| GENDER | t test | N=11 | male | N=5 | female | N=6 |
| KARNOFSKY PERFORMANCE SCORE | Spearman correlation test | N=0 | ||||
| NUMBERPACKYEARSSMOKED | Spearman correlation test | N=0 | ||||
| DISTANT METASTASIS | ANOVA test | N=3 | ||||
| LYMPH NODE METASTASIS | ANOVA test | N=1 | ||||
| NUMBER OF LYMPH NODES | Spearman correlation test | N=0 | ||||
| NEOPLASM DISEASESTAGE | ANOVA test | N=0 |
Table S1. Basic characteristics of clinical feature: 'Time to Death'
| Time to Death | Duration (Months) | 0.1-131.2 (median=6.9) |
| censored | N = 94 | |
| death | N = 33 | |
| Significant markers | N = 0 |
Table S2. Basic characteristics of clinical feature: 'AGE'
| AGE | Mean (SD) | 67.63 (11) |
| Significant markers | N = 0 |
Table S3. Basic characteristics of clinical feature: 'GENDER'
| GENDER | Labels | N |
| FEMALE | 34 | |
| MALE | 100 | |
| Significant markers | N = 11 | |
| Higher in MALE | 5 | |
| Higher in FEMALE | 6 |
Table S4. Get Full Table List of top 10 genes differentially expressed by 'GENDER'
| T(pos if higher in 'MALE') | ttestP | Q | AUC | |
|---|---|---|---|---|
| KIF4B | -10.62 | 1.779e-15 | 3.59e-11 | 0.9282 |
| B3GNT1 | 7.52 | 2.216e-11 | 4.47e-07 | 0.85 |
| MTMR12 | -7.98 | 3.231e-10 | 6.52e-06 | 0.8953 |
| ALG11__2 | 7.61 | 7.952e-09 | 0.000161 | 0.9438 |
| UTP14C | 7.61 | 7.952e-09 | 0.000161 | 0.9438 |
| DKK4 | -5.72 | 6.797e-08 | 0.00137 | 0.7044 |
| KRT79 | -5.87 | 8.205e-08 | 0.00166 | 0.7703 |
| TCP10L | -5.39 | 3.334e-07 | 0.00673 | 0.7265 |
| CATSPER3 | -5.44 | 4.623e-07 | 0.00933 | 0.7426 |
| HIST1H2BH | 4.99 | 1.845e-06 | 0.0372 | 0.6162 |
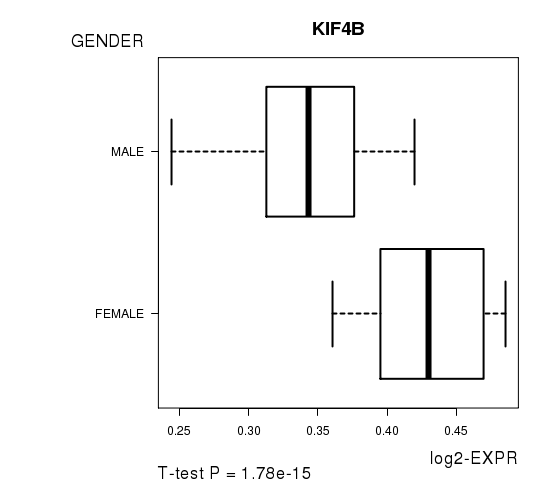
Figure S1. Get High-res Image As an example, this figure shows the association of KIF4B to 'GENDER'. P value = 1.78e-15 with T-test analysis.
No gene related to 'KARNOFSKY.PERFORMANCE.SCORE'.
Table S5. Basic characteristics of clinical feature: 'KARNOFSKY.PERFORMANCE.SCORE'
| KARNOFSKY.PERFORMANCE.SCORE | Mean (SD) | 78.21 (16) |
| Significant markers | N = 0 |
Table S6. Basic characteristics of clinical feature: 'NUMBERPACKYEARSSMOKED'
| NUMBERPACKYEARSSMOKED | Mean (SD) | 37.54 (23) |
| Significant markers | N = 0 |
Table S7. Basic characteristics of clinical feature: 'DISTANT.METASTASIS'
| DISTANT.METASTASIS | Labels | N |
| M0 | 77 | |
| M1 | 5 | |
| MX | 51 | |
| Significant markers | N = 3 |
Table S8. Get Full Table List of 3 genes differentially expressed by 'DISTANT.METASTASIS'
| ANOVA_P | Q | |
|---|---|---|
| TICAM1 | 4.827e-07 | 0.00975 |
| NBPF3 | 1.491e-06 | 0.0301 |
| SLC2A12 | 2.137e-06 | 0.0431 |
Figure S2. Get High-res Image As an example, this figure shows the association of TICAM1 to 'DISTANT.METASTASIS'. P value = 4.83e-07 with ANOVA analysis.

Table S9. Basic characteristics of clinical feature: 'LYMPH.NODE.METASTASIS'
| LYMPH.NODE.METASTASIS | Labels | N |
| N0 | 76 | |
| N1 | 14 | |
| N2 | 27 | |
| N3 | 5 | |
| NX | 9 | |
| Significant markers | N = 1 |
Table S10. Get Full Table List of one gene differentially expressed by 'LYMPH.NODE.METASTASIS'
| ANOVA_P | Q | |
|---|---|---|
| FCHSD2 | 1.915e-06 | 0.0387 |
Figure S3. Get High-res Image As an example, this figure shows the association of FCHSD2 to 'LYMPH.NODE.METASTASIS'. P value = 1.92e-06 with ANOVA analysis.

Table S11. Basic characteristics of clinical feature: 'NUMBER.OF.LYMPH.NODES'
| NUMBER.OF.LYMPH.NODES | Mean (SD) | 1.9 (3.8) |
| Significant markers | N = 0 |
-
Expresson data file = BLCA-TP.meth.by_min_expr_corr.data.txt
-
Clinical data file = BLCA-TP.clin.merged.picked.txt
-
Number of patients = 134
-
Number of genes = 20188
-
Number of clinical features = 9
For survival clinical features, Wald's test in univariate Cox regression analysis with proportional hazards model (Andersen and Gill 1982) was used to estimate the P values using the 'coxph' function in R. Kaplan-Meier survival curves were plot using the four quartile subgroups of patients based on expression levels
For continuous numerical clinical features, Spearman's rank correlation coefficients (Spearman 1904) and two-tailed P values were estimated using 'cor.test' function in R
For two-class clinical features, two-tailed Student's t test with unequal variance (Lehmann and Romano 2005) was applied to compare the log2-expression levels between the two clinical classes using 't.test' function in R
For multi-class clinical features (ordinal or nominal), one-way analysis of variance (Howell 2002) was applied to compare the log2-expression levels between different clinical classes using 'anova' function in R
For multiple hypothesis correction, Q value is the False Discovery Rate (FDR) analogue of the P value (Benjamini and Hochberg 1995), defined as the minimum FDR at which the test may be called significant. We used the 'Benjamini and Hochberg' method of 'p.adjust' function in R to convert P values into Q values.
This is an experimental feature. The full results of the analysis summarized in this report can be downloaded from the TCGA Data Coordination Center.