This pipeline uses various statistical tests to identify mRNAs whose expression levels correlated to selected clinical features.
Testing the association between 18307 genes and 9 clinical features across 134 samples, statistically thresholded by Q value < 0.05, 4 clinical features related to at least one genes.
-
11 genes correlated to 'GENDER'.
-
USP9Y|8287 , PRKY|5616 , RPS4Y1|6192 , XIST|7503 , CYORF15A|246126 , ...
-
1 gene correlated to 'LYMPH.NODE.METASTASIS'.
-
TRIM25|7706
-
7 genes correlated to 'NUMBER.OF.LYMPH.NODES'.
-
PRR15L|79170 , C6ORF141|135398 , BAT2|7916 , TTYH1|57348 , FBXO5|26271 , ...
-
7 genes correlated to 'NEOPLASM.DISEASESTAGE'.
-
SLC39A5|283375 , LIMD1|8994 , BAAT|570 , PXT1|222659 , FAM35B2|439965 , ...
-
No genes correlated to 'Time to Death', 'AGE', 'KARNOFSKY.PERFORMANCE.SCORE', 'NUMBERPACKYEARSSMOKED', and 'DISTANT.METASTASIS'.
Complete statistical result table is provided in Supplement Table 1
Table 1. Get Full Table This table shows the clinical features, statistical methods used, and the number of genes that are significantly associated with each clinical feature at Q value < 0.05.
| Clinical feature | Statistical test | Significant genes | Associated with | Associated with | ||
|---|---|---|---|---|---|---|
| Time to Death | Cox regression test | N=0 | ||||
| AGE | Spearman correlation test | N=0 | ||||
| GENDER | t test | N=11 | male | N=9 | female | N=2 |
| KARNOFSKY PERFORMANCE SCORE | Spearman correlation test | N=0 | ||||
| NUMBERPACKYEARSSMOKED | Spearman correlation test | N=0 | ||||
| DISTANT METASTASIS | ANOVA test | N=0 | ||||
| LYMPH NODE METASTASIS | ANOVA test | N=1 | ||||
| NUMBER OF LYMPH NODES | Spearman correlation test | N=7 | higher number.of.lymph.nodes | N=4 | lower number.of.lymph.nodes | N=3 |
| NEOPLASM DISEASESTAGE | ANOVA test | N=7 |
Table S1. Basic characteristics of clinical feature: 'Time to Death'
| Time to Death | Duration (Months) | 0.1-131.2 (median=7) |
| censored | N = 93 | |
| death | N = 34 | |
| Significant markers | N = 0 |
Table S2. Basic characteristics of clinical feature: 'AGE'
| AGE | Mean (SD) | 67.43 (11) |
| Significant markers | N = 0 |
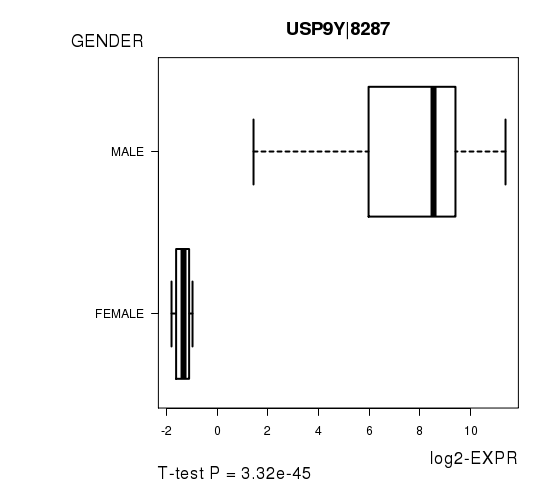
Table S3. Basic characteristics of clinical feature: 'GENDER'
| GENDER | Labels | N |
| FEMALE | 35 | |
| MALE | 99 | |
| Significant markers | N = 11 | |
| Higher in MALE | 9 | |
| Higher in FEMALE | 2 |
Table S4. Get Full Table List of top 10 genes differentially expressed by 'GENDER'
| T(pos if higher in 'MALE') | ttestP | Q | AUC | |
|---|---|---|---|---|
| USP9Y|8287 | 35.67 | 3.32e-45 | 6.07e-41 | 1 |
| PRKY|5616 | 24.81 | 1.109e-40 | 2.03e-36 | 0.9982 |
| RPS4Y1|6192 | 42.28 | 1.026e-38 | 1.88e-34 | 1 |
| XIST|7503 | -21.86 | 1.745e-37 | 3.19e-33 | 0.9924 |
| CYORF15A|246126 | 29.8 | 5.354e-32 | 9.79e-28 | 1 |
| DDX3Y|8653 | 35.53 | 5.772e-29 | 1.06e-24 | 1 |
| KDM5D|8284 | 40.02 | 8.781e-29 | 1.61e-24 | 1 |
| ZFY|7544 | 27.38 | 3.684e-27 | 6.74e-23 | 1 |
| TSIX|9383 | -15.59 | 6.296e-23 | 1.15e-18 | 0.9873 |
| NLGN4Y|22829 | 18.25 | 1.908e-22 | 3.49e-18 | 0.9885 |
Figure S1. Get High-res Image As an example, this figure shows the association of USP9Y|8287 to 'GENDER'. P value = 3.32e-45 with T-test analysis.
No gene related to 'KARNOFSKY.PERFORMANCE.SCORE'.
Table S5. Basic characteristics of clinical feature: 'KARNOFSKY.PERFORMANCE.SCORE'
| KARNOFSKY.PERFORMANCE.SCORE | Mean (SD) | 78.21 (16) |
| Significant markers | N = 0 |
Table S6. Basic characteristics of clinical feature: 'NUMBERPACKYEARSSMOKED'
| NUMBERPACKYEARSSMOKED | Mean (SD) | 36.29 (23) |
| Significant markers | N = 0 |
Table S7. Basic characteristics of clinical feature: 'DISTANT.METASTASIS'
| DISTANT.METASTASIS | Labels | N |
| M0 | 77 | |
| M1 | 5 | |
| MX | 51 | |
| Significant markers | N = 0 |
Table S8. Basic characteristics of clinical feature: 'LYMPH.NODE.METASTASIS'
| LYMPH.NODE.METASTASIS | Labels | N |
| N0 | 75 | |
| N1 | 14 | |
| N2 | 27 | |
| N3 | 5 | |
| NX | 10 | |
| Significant markers | N = 1 |
Table S9. Get Full Table List of one gene differentially expressed by 'LYMPH.NODE.METASTASIS'
| ANOVA_P | Q | |
|---|---|---|
| TRIM25|7706 | 6.343e-07 | 0.0116 |
Figure S2. Get High-res Image As an example, this figure shows the association of TRIM25|7706 to 'LYMPH.NODE.METASTASIS'. P value = 6.34e-07 with ANOVA analysis.
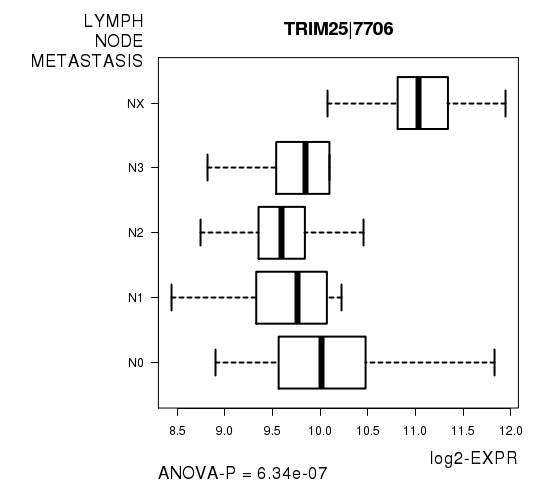
Table S10. Basic characteristics of clinical feature: 'NUMBER.OF.LYMPH.NODES'
| NUMBER.OF.LYMPH.NODES | Mean (SD) | 1.88 (3.7) |
| Significant markers | N = 7 | |
| pos. correlated | 4 | |
| neg. correlated | 3 |
Table S11. Get Full Table List of 7 genes significantly correlated to 'NUMBER.OF.LYMPH.NODES' by Spearman correlation test
| SpearmanCorr | corrP | Q | |
|---|---|---|---|
| PRR15L|79170 | 0.4991 | 1.457e-07 | 0.00267 |
| C6ORF141|135398 | -0.5036 | 2.674e-07 | 0.00489 |
| BAT2|7916 | -0.4878 | 3.03e-07 | 0.00555 |
| TTYH1|57348 | 0.4776 | 5.768e-07 | 0.0106 |
| FBXO5|26271 | -0.4774 | 5.845e-07 | 0.0107 |
| ANXA9|8416 | 0.4581 | 1.859e-06 | 0.034 |
| ERP27|121506 | 0.4538 | 2.385e-06 | 0.0437 |
Figure S3. Get High-res Image As an example, this figure shows the association of PRR15L|79170 to 'NUMBER.OF.LYMPH.NODES'. P value = 1.46e-07 with Spearman correlation analysis. The straight line presents the best linear regression.
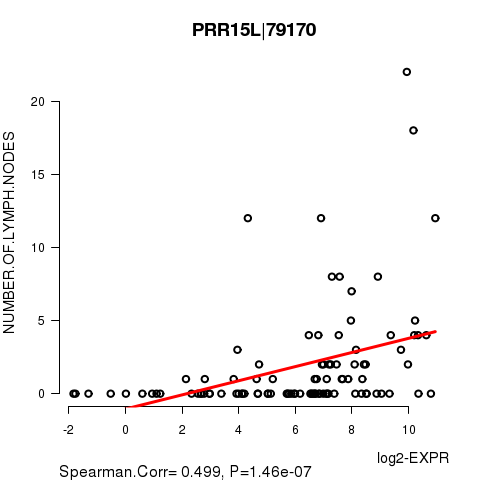
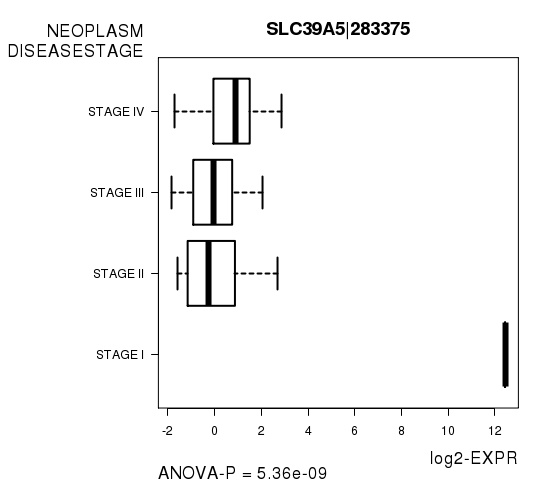
Table S12. Basic characteristics of clinical feature: 'NEOPLASM.DISEASESTAGE'
| NEOPLASM.DISEASESTAGE | Labels | N |
| STAGE I | 1 | |
| STAGE II | 37 | |
| STAGE III | 43 | |
| STAGE IV | 48 | |
| Significant markers | N = 7 |
Table S13. Get Full Table List of 7 genes differentially expressed by 'NEOPLASM.DISEASESTAGE'
| ANOVA_P | Q | |
|---|---|---|
| SLC39A5|283375 | 5.365e-09 | 9.82e-05 |
| LIMD1|8994 | 6.675e-09 | 0.000122 |
| BAAT|570 | 7.634e-09 | 0.00014 |
| PXT1|222659 | 4.345e-08 | 0.000795 |
| FAM35B2|439965 | 1.864e-07 | 0.00341 |
| TTC36|143941 | 2.265e-07 | 0.00415 |
| HAO2|51179 | 1.897e-06 | 0.0347 |
Figure S4. Get High-res Image As an example, this figure shows the association of SLC39A5|283375 to 'NEOPLASM.DISEASESTAGE'. P value = 5.36e-09 with ANOVA analysis.
-
Expresson data file = BLCA-TP.uncv2.mRNAseq_RSEM_normalized_log2.txt
-
Clinical data file = BLCA-TP.clin.merged.picked.txt
-
Number of patients = 134
-
Number of genes = 18307
-
Number of clinical features = 9
For survival clinical features, Wald's test in univariate Cox regression analysis with proportional hazards model (Andersen and Gill 1982) was used to estimate the P values using the 'coxph' function in R. Kaplan-Meier survival curves were plot using the four quartile subgroups of patients based on expression levels
For continuous numerical clinical features, Spearman's rank correlation coefficients (Spearman 1904) and two-tailed P values were estimated using 'cor.test' function in R
For two-class clinical features, two-tailed Student's t test with unequal variance (Lehmann and Romano 2005) was applied to compare the log2-expression levels between the two clinical classes using 't.test' function in R
For multi-class clinical features (ordinal or nominal), one-way analysis of variance (Howell 2002) was applied to compare the log2-expression levels between different clinical classes using 'anova' function in R
For multiple hypothesis correction, Q value is the False Discovery Rate (FDR) analogue of the P value (Benjamini and Hochberg 1995), defined as the minimum FDR at which the test may be called significant. We used the 'Benjamini and Hochberg' method of 'p.adjust' function in R to convert P values into Q values.
This is an experimental feature. The full results of the analysis summarized in this report can be downloaded from the TCGA Data Coordination Center.