This report serves to describe the mutational landscape and properties of a given individual set, as well as rank genes and genesets according to mutational significance. MutSig v2.0 and MutSigCV v0.9 merged result was used to generate the results found in this report.
-
Working with individual set: BLCA-TP
-
Number of patients in set: 28
The input for this pipeline is a set of individuals with the following files associated for each:
-
An annotated .maf file describing the mutations called for the respective individual, and their properties.
-
A .wig file that contains information about the coverage of the sample.
-
MAF used for this analysis:BLCA-TP.final_analysis_set.maf
-
Significantly mutated genes (q ≤ 0.1): 1
-
Mutations seen in COSMIC: 37
-
Significantly mutated genes in COSMIC territory: 3
-
Significantly mutated genesets: 21
-
Read 28 MAFs of type "Broad"
-
Total number of mutations in input MAFs: 7557
-
After removing 3 mutations outside chr1-24: 7554
-
After removing 88 blacklisted mutations: 7466
-
After removing 140 noncoding mutations: 7326
-
Number of mutations before filtering: 7326
-
After removing 93 mutations outside gene set: 7233
-
After removing 11 mutations outside category set: 7222
Table 1. Get Full Table Table representing breakdown of mutations by type.
| type | count |
|---|---|
| Frame_Shift_Del | 94 |
| Frame_Shift_Ins | 39 |
| In_Frame_Del | 23 |
| In_Frame_Ins | 4 |
| Missense_Mutation | 4686 |
| Nonsense_Mutation | 418 |
| Nonstop_Mutation | 9 |
| Silent | 1826 |
| Splice_Site | 115 |
| Translation_Start_Site | 8 |
| Total | 7222 |
Table 2. Get Full Table A breakdown of mutation rates per category discovered for this individual set.
| category | n | N | rate | rate_per_mb | relative_rate | exp_ns_s_ratio |
|---|---|---|---|---|---|---|
| Tp*C->(T/G) | 2636 | 108904258 | 0.000024 | 24 | 3.7 | 3 |
| Tp*C->A | 202 | 108904258 | 1.9e-06 | 1.9 | 0.28 | 4 |
| (A/C/G)p*C->mut | 1235 | 308289400 | 4e-06 | 4 | 0.61 | 3.2 |
| A->mut | 621 | 402887181 | 1.5e-06 | 1.5 | 0.23 | 3.9 |
| indel+null | 691 | 820080839 | 8.4e-07 | 0.84 | 0.13 | NaN |
| double_null | 11 | 820080839 | 1.3e-08 | 0.013 | 0.002 | NaN |
| Total | 5396 | 820080839 | 6.6e-06 | 6.6 | 1 | 3.5 |
The x axis represents the samples. The y axis represents the exons, one row per exon, and they are sorted by average coverage across samples. For exons with exactly the same average coverage, they are sorted next by the %GC of the exon. (The secondary sort is especially useful for the zero-coverage exons at the bottom).
Figure 1.
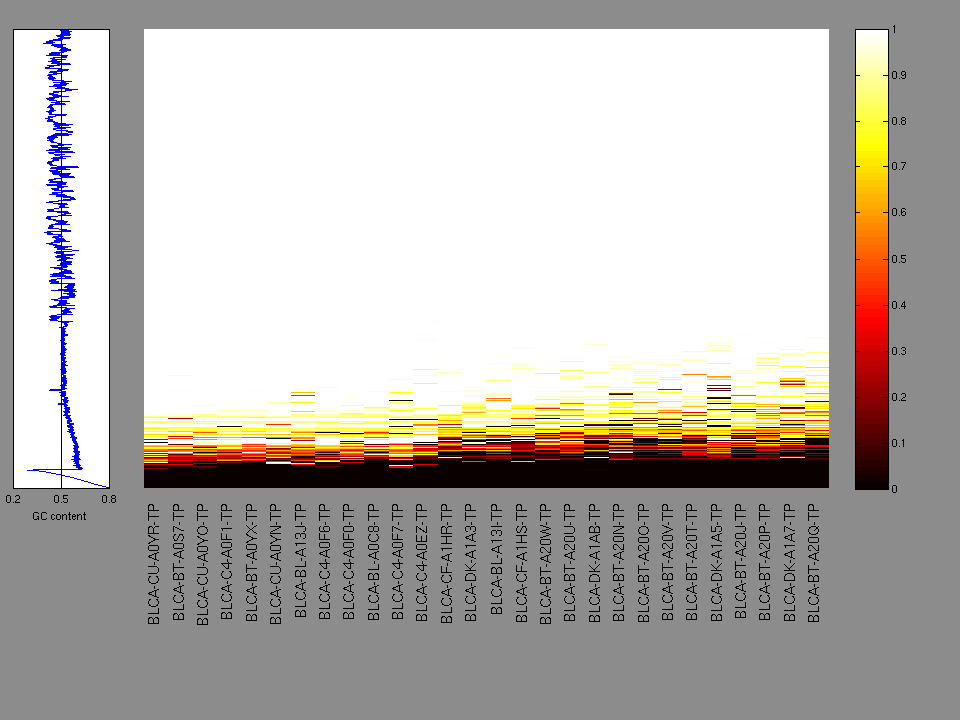
Figure 2. Patients counts and rates file used to generate this plot: BLCA-TP.patients.counts_and_rates.txt
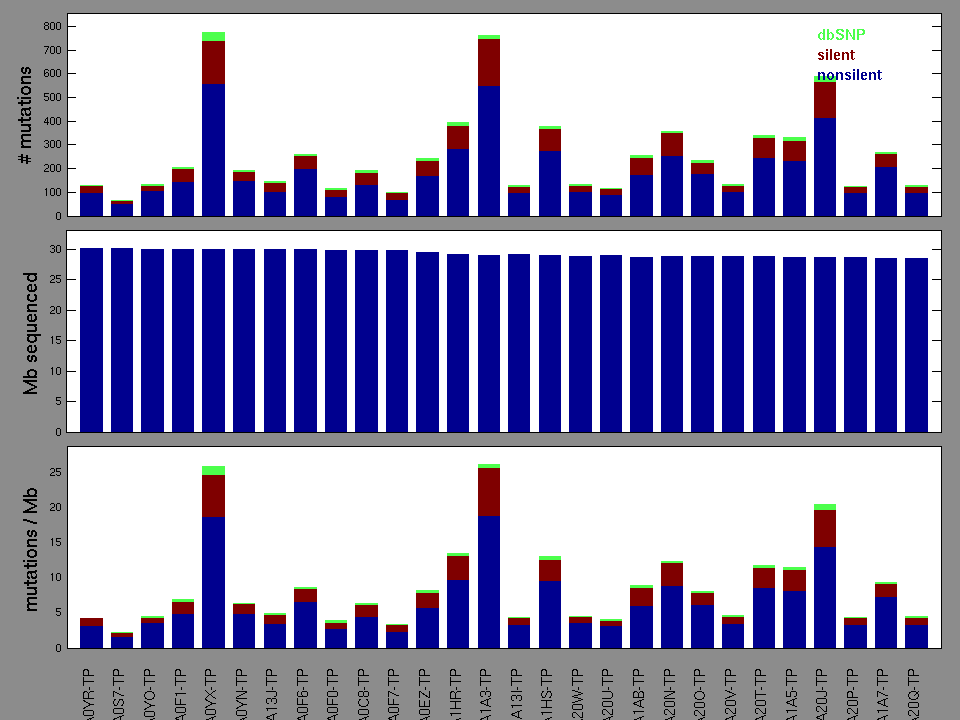
Figure 3. Needs description.
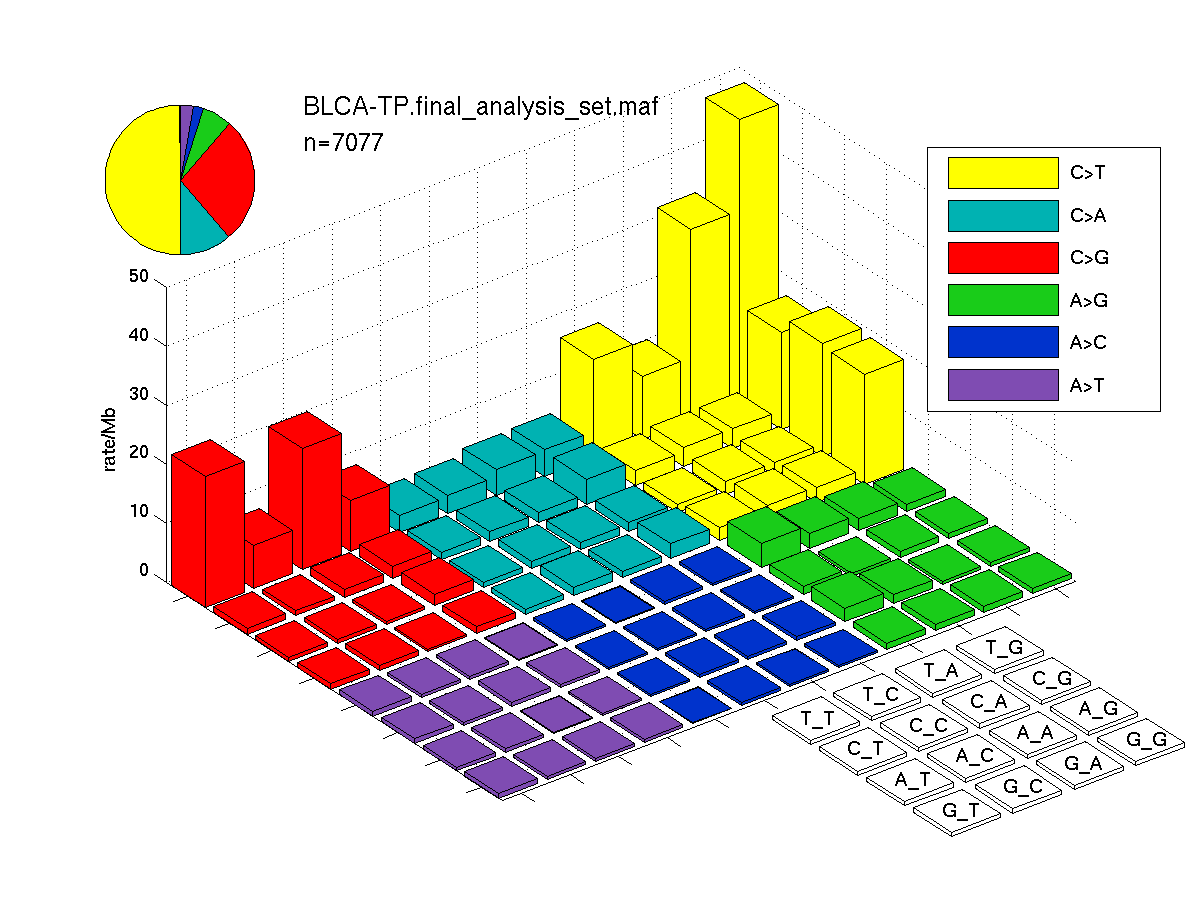
Figure 4. Needs description.
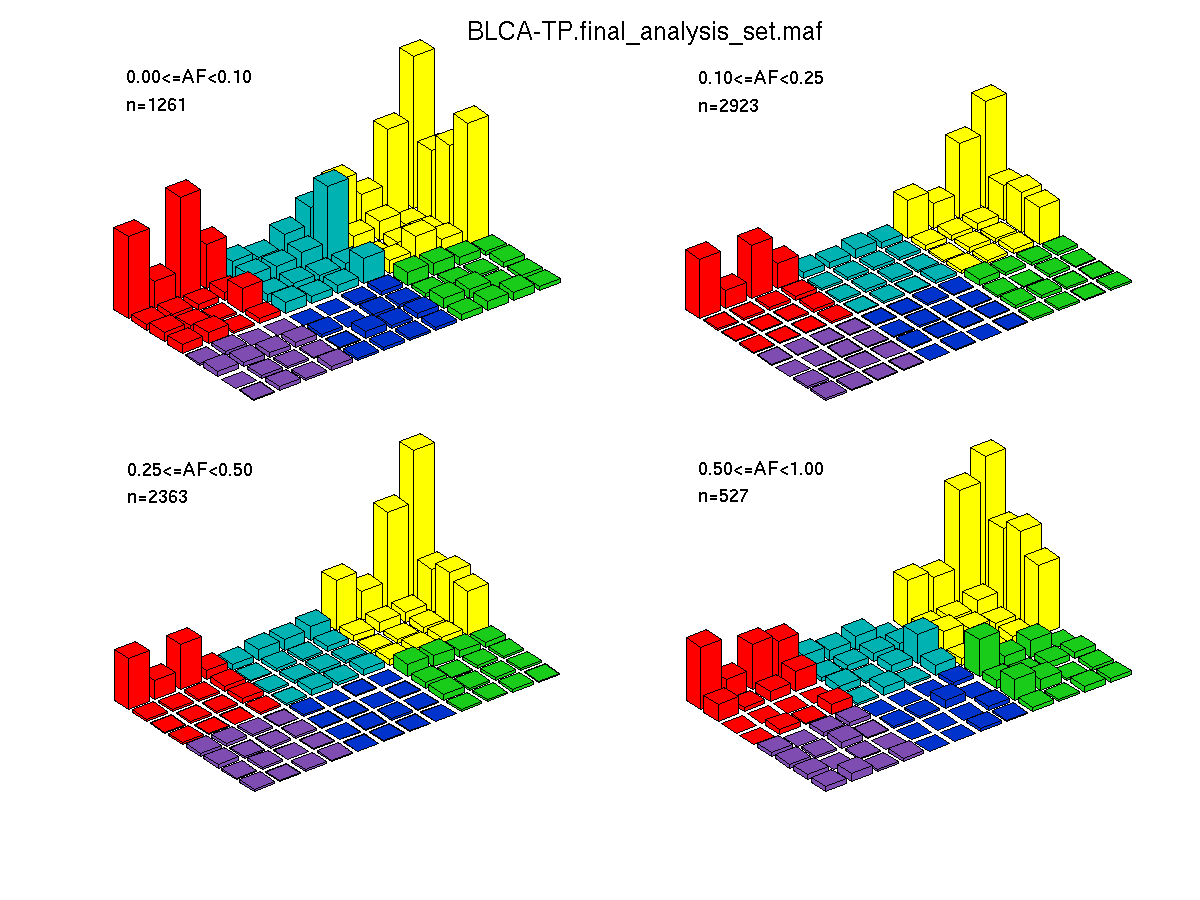
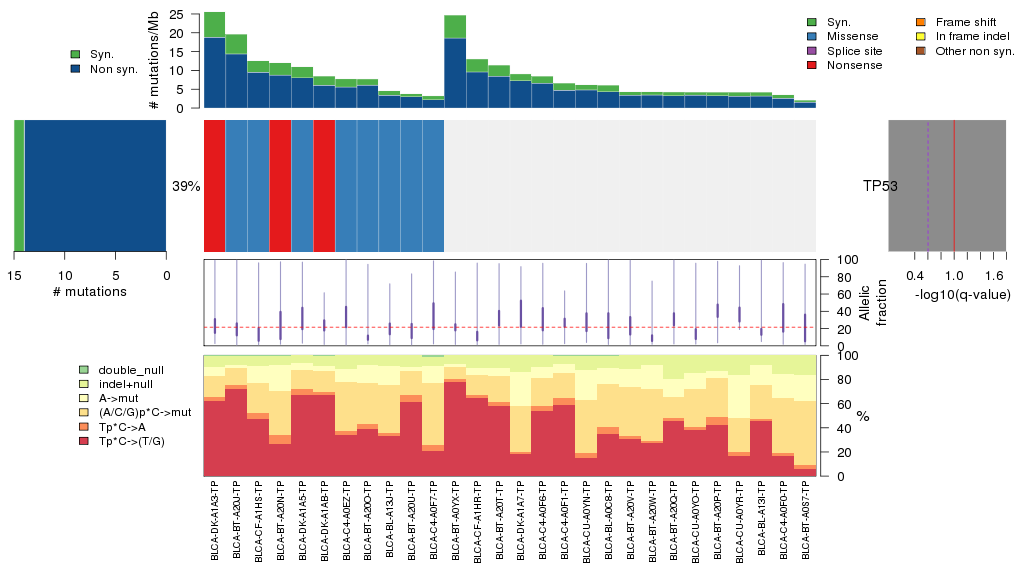
Figure 5. Get High-res Image The matrix in the center of the figure represents individual mutations in patient samples, color-coded by type of mutation, for the significantly mutated genes. The rate of synonymous and non-synonymous mutations is displayed at the top of the matrix. The barplot on the left of the matrix shows the number of mutations in each gene. The percentages represent the fraction of tumors with at least one mutation in the specified gene. The barplot to the right of the matrix displays the q-values for the most significantly mutated genes. The purple boxplots below the matrix (only displayed if required columns are present in the provided MAF) represent the distributions of allelic fractions observed in each sample. The plot at the bottom represents the base substitution distribution of individual samples, using the same categories that were used to calculate significance.
Column Descriptions:
-
N = number of sequenced bases in this gene across the individual set
-
n = number of (nonsilent) mutations in this gene across the individual set
-
npat = number of patients (individuals) with at least one nonsilent mutation
-
nsite = number of unique sites having a non-silent mutation
-
nsil = number of silent mutations in this gene across the individual set
-
n1 = number of nonsilent mutations of type: Tp*C->(T/G)
-
n2 = number of nonsilent mutations of type: Tp*C->A
-
n3 = number of nonsilent mutations of type: (A/C/G)p*C->mut
-
n4 = number of nonsilent mutations of type: A->mut
-
n5 = number of nonsilent mutations of type: indel+null
-
n6 = number of nonsilent mutations of type: double_null
-
p_cons = p-value for enrichment of mutations at evolutionarily most-conserved sites in gene
-
p_joint = p-value for clustering + conservation
-
p = p-value (overall)
-
q = q-value, False Discovery Rate (Benjamini-Hochberg procedure)
Table 3. Get Full Table A Ranked List of Significantly Mutated Genes. Number of significant genes found: 1. Number of genes displayed: 35. Click on a gene name to display its stick figure depicting the distribution of mutations and mutation types across the chosen gene (this feature may not be available for all significant genes).
| rank | gene | description | N | n | npat | nsite | nsil | n1 | n2 | n3 | n4 | n5 | n6 | p_cons | p_joint | p_cv | p | q |
|---|---|---|---|---|---|---|---|---|---|---|---|---|---|---|---|---|---|---|
| 1 | TP53 | tumor protein p53 | 34506 | 14 | 11 | 13 | 1 | 2 | 0 | 8 | 1 | 3 | 0 | 0.0051 | 0.000022 | 0.0021 | 8.3e-07 | 0.015 |
| 2 | FBXW7 | F-box and WD repeat domain containing 7 | 68665 | 6 | 5 | 5 | 0 | 2 | 0 | 2 | 0 | 2 | 0 | 0.081 | 0.0033 | 0.0051 | 0.0002 | 1 |
| 3 | TMCO2 | transmembrane and coiled-coil domains 2 | 15596 | 2 | 2 | 1 | 0 | 0 | 0 | 0 | 0 | 2 | 0 | 0.9 | 0.15 | 0.0024 | 0.0032 | 1 |
| 4 | NFE2L2 | nuclear factor (erythroid-derived 2)-like 2 | 50092 | 4 | 4 | 4 | 0 | 1 | 0 | 1 | 2 | 0 | 0 | 0.011 | 0.022 | 0.047 | 0.008 | 1 |
| 5 | AZI1 | 5-azacytidine induced 1 | 72929 | 3 | 2 | 3 | 2 | 3 | 0 | 0 | 0 | 0 | 0 | 0.014 | 0.0017 | 0.86 | 0.011 | 1 |
| 6 | CRYBB1 | crystallin, beta B1 | 21812 | 2 | 1 | 2 | 1 | 0 | 1 | 0 | 0 | 1 | 0 | 0.09 | 0.015 | 0.11 | 0.012 | 1 |
| 7 | RFTN2 | raftlin family member 2 | 40281 | 3 | 3 | 3 | 0 | 1 | 0 | 0 | 0 | 2 | 0 | 0.54 | 0.5 | 0.0049 | 0.017 | 1 |
| 8 | H1FX | H1 histone family, member X | 6847 | 2 | 1 | 2 | 0 | 2 | 0 | 0 | 0 | 0 | 0 | 0.19 | 0.038 | 0.07 | 0.019 | 1 |
| 9 | GPS2 | G protein pathway suppressor 2 | 26706 | 3 | 3 | 3 | 0 | 0 | 1 | 0 | 0 | 1 | 1 | 0.42 | 0.55 | 0.0059 | 0.022 | 1 |
| 10 | PYGO1 | pygopus homolog 1 (Drosophila) | 35616 | 3 | 3 | 3 | 0 | 0 | 0 | 1 | 1 | 1 | 0 | 0.65 | 0.22 | 0.015 | 0.023 | 1 |
| 11 | RPL31 | ribosomal protein L31 | 12690 | 3 | 1 | 3 | 0 | 3 | 0 | 0 | 0 | 0 | 0 | 0.16 | 0.0065 | 0.57 | 0.024 | 1 |
| 12 | TBCC | tubulin folding cofactor C | 28768 | 3 | 1 | 3 | 0 | 3 | 0 | 0 | 0 | 0 | 0 | 0.005 | 0.0074 | 0.51 | 0.025 | 1 |
| 13 | NXPH2 | neurexophilin 2 | 20944 | 2 | 1 | 2 | 0 | 0 | 0 | 1 | 1 | 0 | 0 | 0.8 | 0.018 | 0.21 | 0.026 | 1 |
| 14 | KLF5 | Kruppel-like factor 5 (intestinal) | 31500 | 2 | 2 | 2 | 1 | 0 | 0 | 0 | 0 | 2 | 0 | 0.42 | 0.4 | 0.0099 | 0.026 | 1 |
| 15 | AMACR | alpha-methylacyl-CoA racemase | 37197 | 2 | 2 | 2 | 0 | 1 | 0 | 0 | 0 | 1 | 0 | 0.23 | 0.063 | 0.064 | 0.026 | 1 |
| 16 | ZNF263 | zinc finger protein 263 | 58087 | 3 | 3 | 3 | 0 | 1 | 0 | 0 | 0 | 2 | 0 | 0.69 | 0.23 | 0.019 | 0.027 | 1 |
| 17 | NUDT14 | nudix (nucleoside diphosphate linked moiety X)-type motif 14 | 16739 | 1 | 1 | 1 | 0 | 0 | 0 | 0 | 0 | 1 | 0 | NaN | NaN | 0.03 | 0.03 | 1 |
| 18 | C17orf81 | chromosome 17 open reading frame 81 | 29954 | 3 | 2 | 3 | 1 | 2 | 0 | 1 | 0 | 0 | 0 | 0.096 | 0.011 | 0.43 | 0.031 | 1 |
| 19 | MGA | MAX gene associated | 241266 | 2 | 2 | 2 | 0 | 1 | 0 | 0 | 0 | 1 | 0 | 0.0048 | 0.0052 | 0.97 | 0.032 | 1 |
| 20 | PLAUR | plasminogen activator, urokinase receptor | 28994 | 3 | 2 | 3 | 0 | 3 | 0 | 0 | 0 | 0 | 0 | 0.4 | 0.014 | 0.38 | 0.033 | 1 |
| 21 | LCE1F | late cornified envelope 1F | 10079 | 1 | 1 | 1 | 0 | 0 | 0 | 0 | 0 | 1 | 0 | NaN | NaN | 0.033 | 0.033 | 1 |
| 22 | CDH8 | cadherin 8, type 2 | 68247 | 3 | 2 | 3 | 0 | 0 | 2 | 0 | 0 | 1 | 0 | 0.19 | 0.0063 | 0.88 | 0.034 | 1 |
| 23 | FEZ2 | fasciculation and elongation protein zeta 2 (zygin II) | 22624 | 2 | 2 | 2 | 0 | 1 | 0 | 0 | 0 | 1 | 0 | 0.6 | 0.32 | 0.018 | 0.035 | 1 |
| 24 | ADSS | adenylosuccinate synthase | 37589 | 1 | 1 | 1 | 0 | 1 | 0 | 0 | 0 | 0 | 0 | NaN | NaN | 0.036 | 0.036 | 1 |
| 25 | GINS1 | GINS complex subunit 1 (Psf1 homolog) | 17292 | 1 | 1 | 1 | 0 | 0 | 0 | 0 | 0 | 1 | 0 | NaN | NaN | 0.036 | 0.036 | 1 |
| 26 | C11orf85 | chromosome 11 open reading frame 85 | 19112 | 2 | 2 | 2 | 0 | 0 | 0 | 0 | 1 | 1 | 0 | 0.93 | 0.22 | 0.028 | 0.038 | 1 |
| 27 | MGP | matrix Gla protein | 8863 | 1 | 1 | 1 | 0 | 0 | 0 | 0 | 0 | 1 | 0 | NaN | NaN | 0.041 | 0.041 | 1 |
| 28 | TP53I13 | tumor protein p53 inducible protein 13 | 26129 | 1 | 1 | 1 | 0 | 0 | 0 | 0 | 0 | 1 | 0 | NaN | NaN | 0.041 | 0.041 | 1 |
| 29 | NME4 | non-metastatic cells 4, protein expressed in | 13692 | 1 | 1 | 1 | 0 | 0 | 0 | 0 | 0 | 1 | 0 | NaN | NaN | 0.042 | 0.042 | 1 |
| 30 | ELF3 | E74-like factor 3 (ets domain transcription factor, epithelial-specific ) | 32054 | 3 | 3 | 3 | 0 | 0 | 0 | 1 | 0 | 2 | 0 | 0.52 | 1 | 0.0071 | 0.042 | 1 |
| 31 | OR11H12 | olfactory receptor, family 11, subfamily H, member 12 | 25197 | 1 | 1 | 1 | 0 | 0 | 0 | 0 | 0 | 1 | 0 | NaN | NaN | 0.042 | 0.042 | 1 |
| 32 | TNFSF4 | tumor necrosis factor (ligand) superfamily, member 4 (tax-transcriptionally activated glycoprotein 1, 34kDa) | 15764 | 1 | 1 | 1 | 0 | 0 | 0 | 0 | 0 | 1 | 0 | NaN | NaN | 0.043 | 0.043 | 1 |
| 33 | HLA-A | major histocompatibility complex, class I, A | 29882 | 3 | 3 | 3 | 0 | 0 | 0 | 1 | 0 | 2 | 0 | 0.7 | 1 | 0.0072 | 0.043 | 1 |
| 34 | INPP4B | inositol polyphosphate-4-phosphatase, type II, 105kDa | 78653 | 2 | 1 | 2 | 0 | 0 | 0 | 1 | 0 | 1 | 0 | 0.03 | 0.02 | 0.37 | 0.044 | 1 |
| 35 | XPR1 | xenotropic and polytropic retrovirus receptor | 59450 | 5 | 4 | 5 | 1 | 3 | 0 | 0 | 0 | 2 | 0 | 0.5 | 0.47 | 0.016 | 0.045 | 1 |
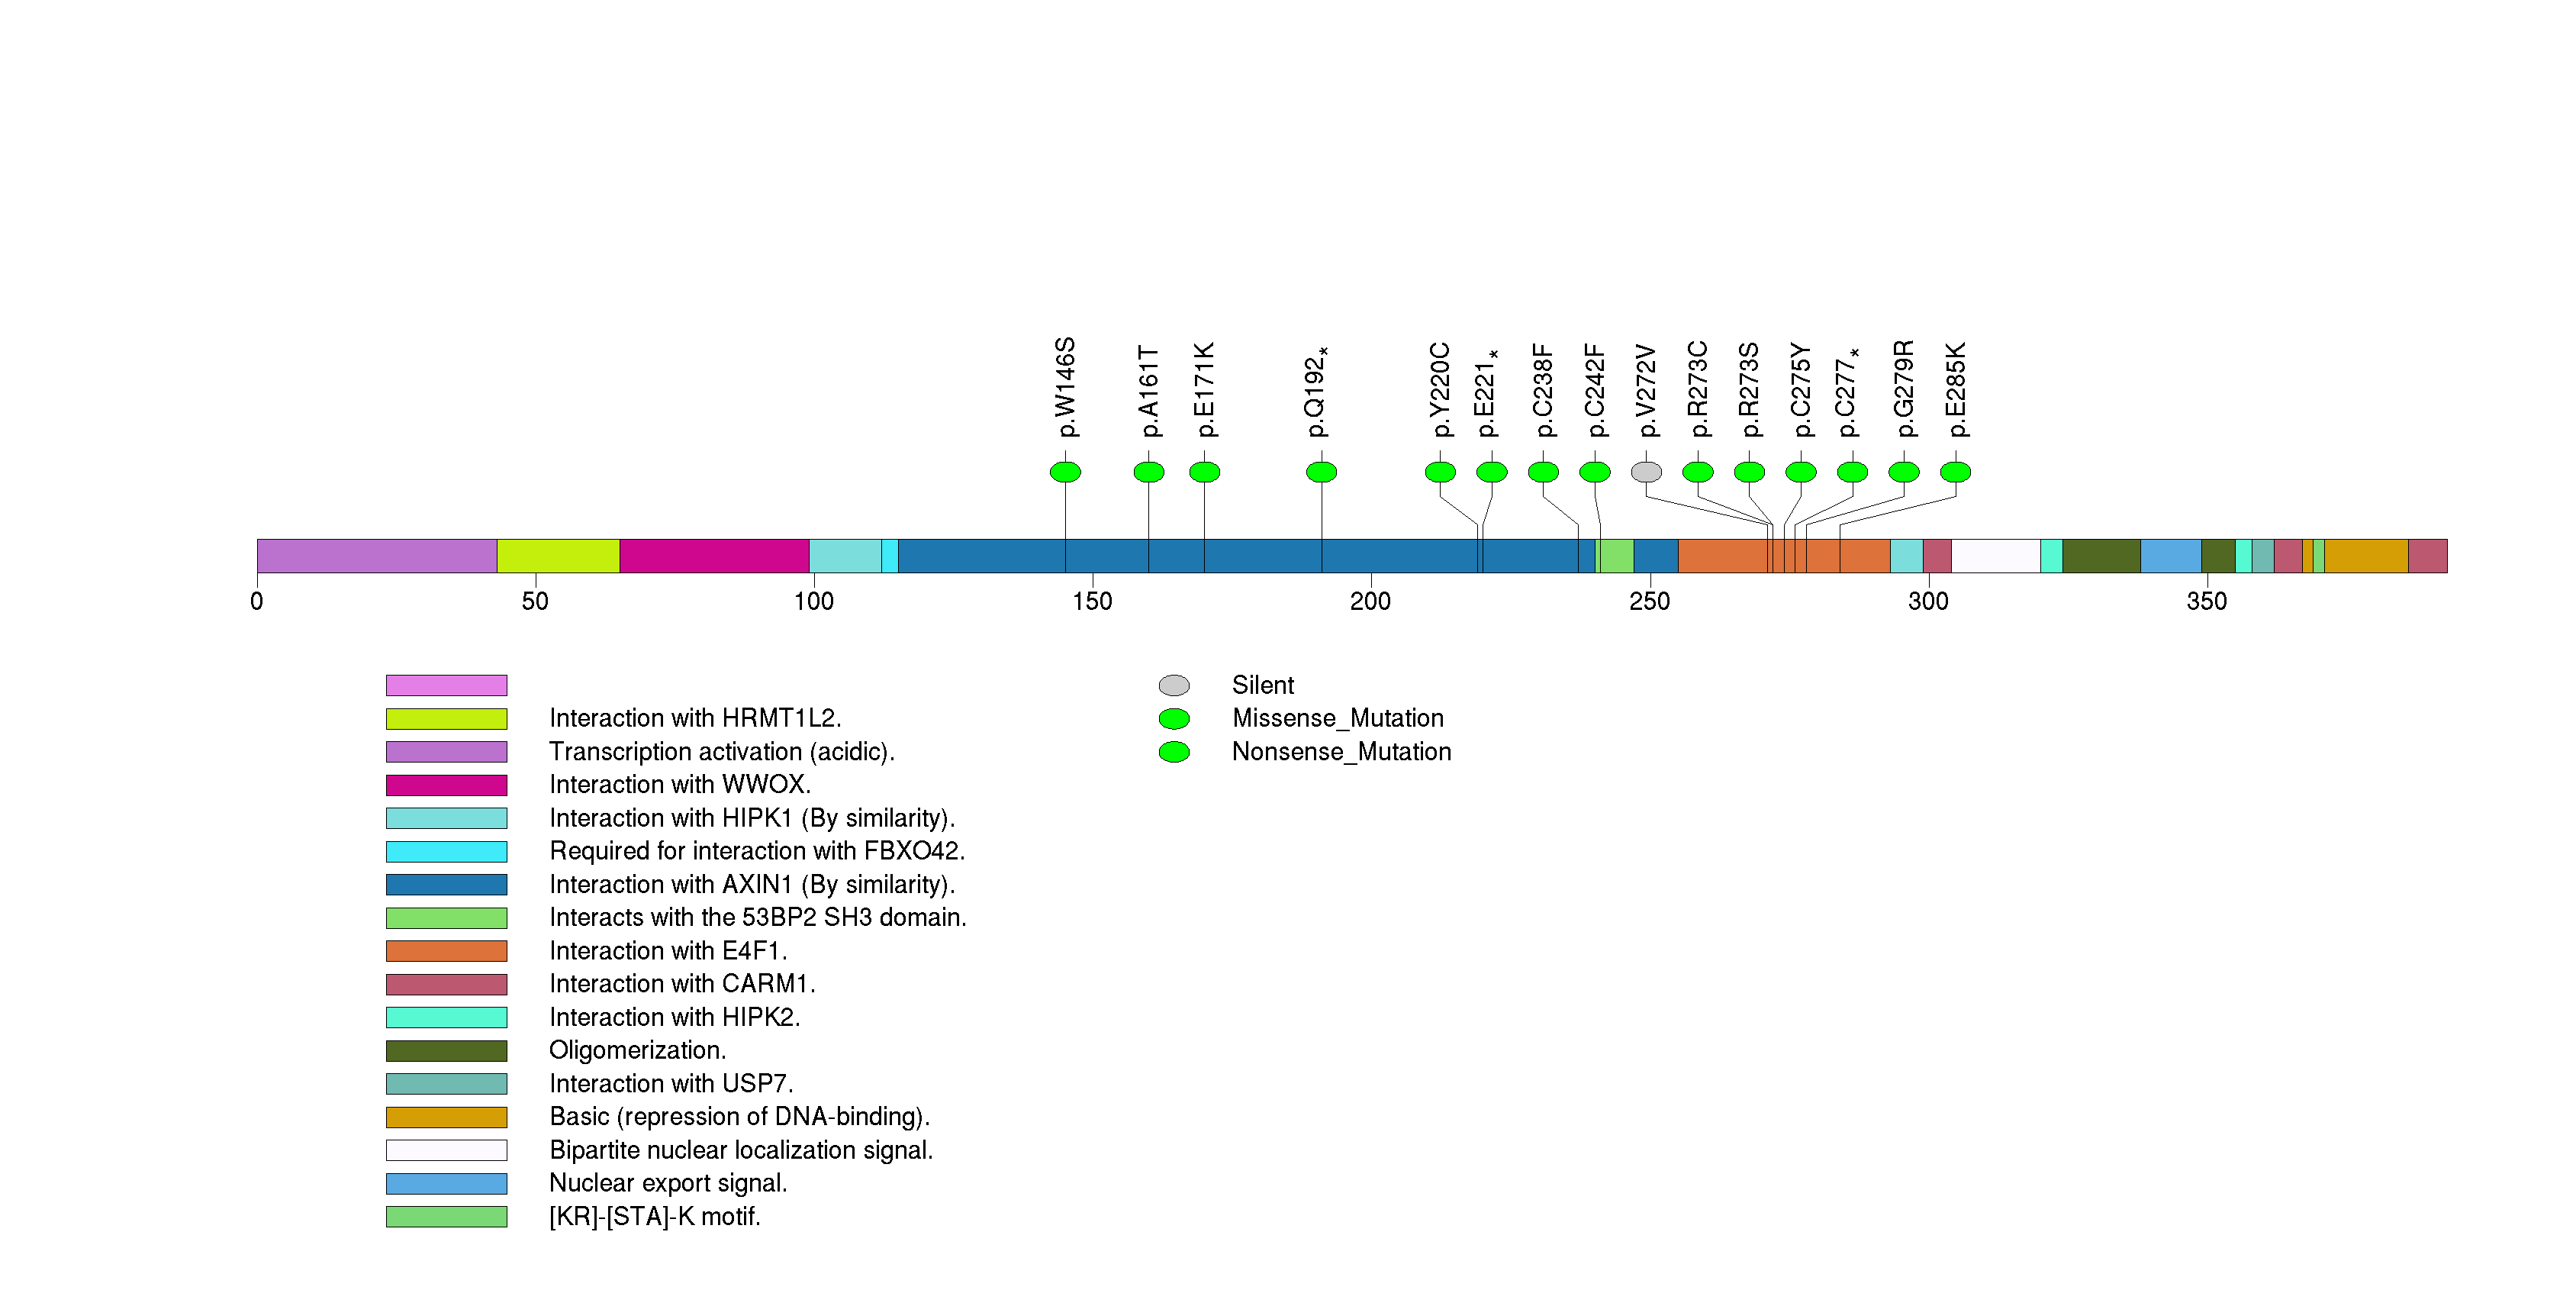
Figure S1. This figure depicts the distribution of mutations and mutation types across the TP53 significant gene.
In this analysis, COSMIC is used as a filter to increase power by restricting the territory of each gene. Cosmic version: v48.
Table 4. Get Full Table Significantly mutated genes (COSMIC territory only). To access the database please go to: COSMIC. Number of significant genes found: 3. Number of genes displayed: 10
| rank | gene | description | n | cos | n_cos | N_cos | cos_ev | p | q |
|---|---|---|---|---|---|---|---|---|---|
| 1 | TP53 | tumor protein p53 | 14 | 356 | 14 | 9968 | 2964 | 4.3e-13 | 1.9e-09 |
| 2 | FBXW7 | F-box and WD repeat domain containing 7 | 6 | 91 | 4 | 2548 | 102 | 3.2e-09 | 7.3e-06 |
| 3 | FGFR3 | fibroblast growth factor receptor 3 (achondroplasia, thanatophoric dwarfism) | 2 | 62 | 2 | 1736 | 216 | 0.000065 | 0.098 |
| 4 | DPYSL4 | dihydropyrimidinase-like 4 | 1 | 1 | 1 | 28 | 2 | 0.00018 | 0.17 |
| 5 | TBC1D8B | TBC1 domain family, member 8B (with GRAM domain) | 2 | 1 | 1 | 28 | 1 | 0.00018 | 0.17 |
| 6 | BMX | BMX non-receptor tyrosine kinase | 2 | 2 | 1 | 56 | 2 | 0.00037 | 0.24 |
| 7 | GABRA6 | gamma-aminobutyric acid (GABA) A receptor, alpha 6 | 2 | 2 | 1 | 56 | 1 | 0.00037 | 0.24 |
| 8 | BAZ1A | bromodomain adjacent to zinc finger domain, 1A | 1 | 4 | 1 | 112 | 1 | 0.00074 | 0.32 |
| 9 | PHIP | pleckstrin homology domain interacting protein | 3 | 4 | 1 | 112 | 1 | 0.00074 | 0.32 |
| 10 | SCN9A | sodium channel, voltage-gated, type IX, alpha subunit | 1 | 4 | 1 | 112 | 1 | 0.00074 | 0.32 |
Note:
n - number of (nonsilent) mutations in this gene across the individual set.
cos = number of unique mutated sites in this gene in COSMIC
n_cos = overlap between n and cos.
N_cos = number of individuals times cos.
cos_ev = total evidence: number of reports in COSMIC for mutations seen in this gene.
p = p-value for seeing the observed amount of overlap in this gene)
q = q-value, False Discovery Rate (Benjamini-Hochberg procedure)
Table 5. Get Full Table A Ranked List of Significantly Mutated Genesets. (Source: MSigDB GSEA Cannonical Pathway Set).Number of significant genesets found: 21. Number of genesets displayed: 10
| rank | geneset | description | genes | N_genes | mut_tally | N | n | npat | nsite | nsil | n1 | n2 | n3 | n4 | n5 | n6 | p_ns_s | p | q |
|---|---|---|---|---|---|---|---|---|---|---|---|---|---|---|---|---|---|---|---|
| 1 | TIDPATHWAY | On ligand binding, interferon gamma receptors stimulate JAK2 kinase to phosphorylate STAT transcription factors, which promote expression of interferon responsive genes. | DNAJA3, HSPA1A, IFNG, IFNGR1, IFNGR2, IKBKB, JAK2, LIN7A, NFKB1, NFKBIA, RB1, RELA, TIP-1, TNF, TNFRSF1A, TNFRSF1B, TP53, USH1C, WT1 | 18 | IFNGR2(1), JAK2(1), RB1(2), RELA(1), TNFRSF1B(1), TP53(14), USH1C(1) | 754587 | 21 | 15 | 19 | 1 | 5 | 1 | 9 | 1 | 4 | 1 | 0.023 | 2e-08 | 0.000012 |
| 2 | PMLPATHWAY | Ring-shaped PML nuclear bodies regulate transcription and are required co-activators in p53- and DAXX-mediated apoptosis. | CREBBP, DAXX, HRAS, PAX3, PML, PRAM-1, RARA, RB1, SIRT1, SP100, TNF, TNFRSF1A, TNFRSF1B, TNFRSF6, TNFSF6, TP53, UBL1 | 13 | CREBBP(5), DAXX(1), PML(3), RARA(2), RB1(2), SP100(1), TNFRSF1B(1), TP53(14) | 792662 | 29 | 17 | 27 | 2 | 7 | 0 | 13 | 1 | 7 | 1 | 0.012 | 6e-08 | 0.000018 |
| 3 | RNAPATHWAY | dsRNA-activated protein kinase phosphorylates elF2a, which generally inhibits translation, and activates NF-kB to provoke inflammation. | CHUK, DNAJC3, EIF2S1, EIF2S2, MAP3K14, NFKB1, NFKBIA, PRKR, RELA, TP53 | 9 | DNAJC3(1), RELA(1), TP53(14) | 408205 | 16 | 12 | 15 | 1 | 4 | 0 | 8 | 1 | 3 | 0 | 0.085 | 3.2e-07 | 0.000065 |
| 4 | TERTPATHWAY | hTERC, the RNA subunit of telomerase, and hTERT, the catalytic protein subunit, are required for telomerase activity and are overexpressed in many cancers. | HDAC1, MAX, MYC, SP1, SP3, TP53, WT1, ZNF42 | 7 | SP3(2), TP53(14) | 292760 | 16 | 12 | 15 | 2 | 4 | 0 | 8 | 1 | 3 | 0 | 0.19 | 9.2e-07 | 0.00014 |
| 5 | FBW7PATHWAY | Cyclin E interacts with cell cycle checkpoint kinase cdk2 to allow transcription of genes required for S phase, including transcription of additional cyclin E. | CCNE1, CDC34, CDK2, CUL1, E2F1, FBXW7, RB1, SKP1A, TFDP1 | 8 | CUL1(4), FBXW7(6), RB1(2) | 343289 | 12 | 9 | 9 | 0 | 5 | 0 | 3 | 0 | 3 | 1 | 0.06 | 5.9e-06 | 0.00072 |
| 6 | RBPATHWAY | The ATM protein kinase recognizes DNA damage and blocks cell cycle progression by phosphorylating chk1 and p53, which normally inhibits Rb to allow G1/S transitions. | ATM, CDC2, CDC25A, CDC25B, CDC25C, CDK2, CDK4, CHEK1, MYT1, RB1, TP53, WEE1, YWHAH | 12 | ATM(3), RB1(2), TP53(14), WEE1(1) | 734757 | 20 | 16 | 18 | 3 | 3 | 0 | 9 | 2 | 5 | 1 | 0.3 | 0.000026 | 0.0026 |
| 7 | PLK3PATHWAY | Active Plk3 phosphorylates CDC25c, blocking the G2/M transition, and phosphorylates p53 to induce apoptosis. | ATM, ATR, CDC25C, CHEK1, CHEK2, CNK, TP53, YWHAH | 7 | ATM(3), ATR(3), TP53(14) | 670310 | 20 | 13 | 19 | 2 | 6 | 0 | 9 | 2 | 3 | 0 | 0.18 | 0.000072 | 0.0064 |
| 8 | SA_G1_AND_S_PHASES | Cdk2, 4, and 6 bind cyclin D in G1, while cdk2/cyclin E promotes the G1/S transition. | ARF1, ARF3, CCND1, CDK2, CDK4, CDKN1A, CDKN1B, CDKN2A, CFL1, E2F1, E2F2, MDM2, NXT1, PRB1, TP53 | 15 | CCND1(1), CDKN1A(2), E2F2(1), TP53(14) | 345627 | 18 | 12 | 17 | 3 | 4 | 0 | 9 | 2 | 3 | 0 | 0.22 | 0.00016 | 0.012 |
| 9 | ARFPATHWAY | Cyclin-dependent kinase inhibitor 2A is a tumor suppressor that induces G1 arrest and can activate the p53 pathway, leading to G2/M arrest. | ABL1, CDKN2A, E2F1, MDM2, MYC, PIK3CA, PIK3R1, POLR1A, POLR1B, POLR1C, POLR1D, RAC1, RB1, TBX2, TP53, TWIST1 | 16 | ABL1(1), PIK3CA(3), PIK3R1(1), RB1(2), TP53(14) | 838723 | 21 | 13 | 19 | 3 | 5 | 1 | 9 | 1 | 4 | 1 | 0.16 | 0.00028 | 0.019 |
| 10 | G1PATHWAY | CDK4/6-cyclin D and CDK2-cyclin E phosphorylate Rb, which allows the transcription of genes needed for the G1/S cell cycle transition. | ABL1, ATM, ATR, CCNA1, CCND1, CCNE1, CDC2, CDC25A, CDK2, CDK4, CDK6, CDKN1A, CDKN1B, CDKN2A, CDKN2B, DHFR, E2F1, GSK3B, HDAC1, MADH3, MADH4, RB1, SKP2, TFDP1, TGFB1, TGFB2, TGFB3, TP53 | 25 | ABL1(1), ATM(3), ATR(3), CCND1(1), CDK6(1), CDKN1A(2), RB1(2), TP53(14) | 1250337 | 27 | 17 | 25 | 3 | 10 | 0 | 10 | 2 | 4 | 1 | 0.079 | 0.0003 | 0.019 |
In brief, we tabulate the number of mutations and the number of covered bases for each gene. The counts are broken down by mutation context category: four context categories that are discovered by MutSig, and one for indel and 'null' mutations, which include indels, nonsense mutations, splice-site mutations, and non-stop (read-through) mutations. For each gene, we calculate the probability of seeing the observed constellation of mutations, i.e. the product P1 x P2 x ... x Pm, or a more extreme one, given the background mutation rates calculated across the dataset. [1]
This is an experimental feature. The full results of the analysis summarized in this report can be downloaded from the TCGA Data Coordination Center.