This pipeline uses various statistical tests to identify genes whose promoter methylation levels correlated to selected clinical features.
Testing the association between 19950 genes and 9 clinical features across 575 samples, statistically thresholded by Q value < 0.05, 9 clinical features related to at least one genes.
-
6 genes correlated to 'Time to Death'.
-
MTHFD1 , CDC73 , MIR1278 , PIH1D1 , ALDH16A1 , ...
-
197 genes correlated to 'AGE'.
-
KIAA1143 , KIF15 , C1ORF103 , LGALS8 , C10ORF35 , ...
-
193 genes correlated to 'GENDER'.
-
ALDOC , ZNF486 , C19ORF24 , CIRBP__2 , DNAJC15 , ...
-
448 genes correlated to 'HISTOLOGICAL.TYPE'.
-
ZNF230 , ZNF846 , JOSD2 , GTF2F1 , LOC100288730 , ...
-
204 genes correlated to 'RADIATIONS.RADIATION.REGIMENINDICATION'.
-
TUBA4A , TUBA4B , NDUFB4 , SNRPF , TBCA , ...
-
21 genes correlated to 'DISTANT.METASTASIS'.
-
RHBDL3 , MMAB , MVK , NHEDC1 , SAG , ...
-
76 genes correlated to 'LYMPH.NODE.METASTASIS'.
-
SS18L1__1 , ZNF235 , MANBAL , TPCN2 , ZNF33A , ...
-
1 gene correlated to 'NUMBER.OF.LYMPH.NODES'.
-
TCP11L1
-
40 genes correlated to 'NEOPLASM.DISEASESTAGE'.
-
IDH3B , TMX4 , DRG2 , HIST1H4C , WDR74 , ...
Complete statistical result table is provided in Supplement Table 1
Table 1. Get Full Table This table shows the clinical features, statistical methods used, and the number of genes that are significantly associated with each clinical feature at Q value < 0.05.
| Clinical feature | Statistical test | Significant genes | Associated with | Associated with | ||
|---|---|---|---|---|---|---|
| Time to Death | Cox regression test | N=6 | shorter survival | N=4 | longer survival | N=2 |
| AGE | Spearman correlation test | N=197 | older | N=181 | younger | N=16 |
| GENDER | t test | N=193 | male | N=50 | female | N=143 |
| HISTOLOGICAL TYPE | ANOVA test | N=448 | ||||
| RADIATIONS RADIATION REGIMENINDICATION | t test | N=204 | yes | N=164 | no | N=40 |
| DISTANT METASTASIS | ANOVA test | N=21 | ||||
| LYMPH NODE METASTASIS | ANOVA test | N=76 | ||||
| NUMBER OF LYMPH NODES | Spearman correlation test | N=1 | higher number.of.lymph.nodes | N=1 | lower number.of.lymph.nodes | N=0 |
| NEOPLASM DISEASESTAGE | ANOVA test | N=40 |
Table S1. Basic characteristics of clinical feature: 'Time to Death'
| Time to Death | Duration (Months) | 0-223.4 (median=17.7) |
| censored | N = 485 | |
| death | N = 61 | |
| Significant markers | N = 6 | |
| associated with shorter survival | 4 | |
| associated with longer survival | 2 |
Table S2. Get Full Table List of 6 genes significantly associated with 'Time to Death' by Cox regression test
| HazardRatio | Wald_P | Q | C_index | |
|---|---|---|---|---|
| MTHFD1 | 5000000001 | 1.749e-08 | 0.00035 | 0.655 |
| CDC73 | 0 | 1.318e-06 | 0.026 | 0.358 |
| MIR1278 | 0 | 1.318e-06 | 0.026 | 0.358 |
| PIH1D1 | 141 | 1.588e-06 | 0.032 | 0.545 |
| ALDH16A1 | 3801 | 1.878e-06 | 0.037 | 0.548 |
| PIH1D1__1 | 3801 | 1.878e-06 | 0.037 | 0.548 |
Figure S1. Get High-res Image As an example, this figure shows the association of MTHFD1 to 'Time to Death'. four curves present the cumulative survival rates of 4 quartile subsets of patients. P value = 1.75e-08 with univariate Cox regression analysis using continuous log-2 expression values.
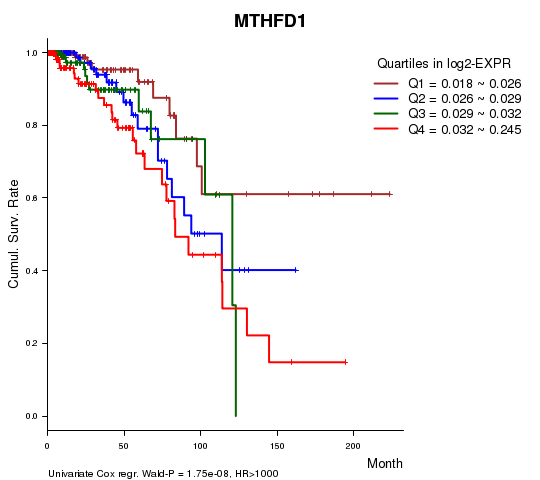
Table S3. Basic characteristics of clinical feature: 'AGE'
| AGE | Mean (SD) | 57.87 (13) |
| Significant markers | N = 197 | |
| pos. correlated | 181 | |
| neg. correlated | 16 |
Table S4. Get Full Table List of top 10 genes significantly correlated to 'AGE' by Spearman correlation test
| SpearmanCorr | corrP | Q | |
|---|---|---|---|
| KIAA1143 | 0.3254 | 1.277e-15 | 2.55e-11 |
| KIF15 | 0.3254 | 1.277e-15 | 2.55e-11 |
| C1ORF103 | 0.3154 | 1.017e-14 | 2.03e-10 |
| LGALS8 | -0.2851 | 3.4e-12 | 6.78e-08 |
| C10ORF35 | 0.2817 | 6.203e-12 | 1.24e-07 |
| EGR2 | 0.281 | 7.116e-12 | 1.42e-07 |
| MEX3C | 0.2791 | 9.842e-12 | 1.96e-07 |
| CACNA2D1 | 0.2782 | 1.167e-11 | 2.33e-07 |
| BMPER | 0.2736 | 2.575e-11 | 5.13e-07 |
| RPS2__2 | 0.2722 | 3.273e-11 | 6.53e-07 |
Figure S2. Get High-res Image As an example, this figure shows the association of KIAA1143 to 'AGE'. P value = 1.28e-15 with Spearman correlation analysis. The straight line presents the best linear regression.
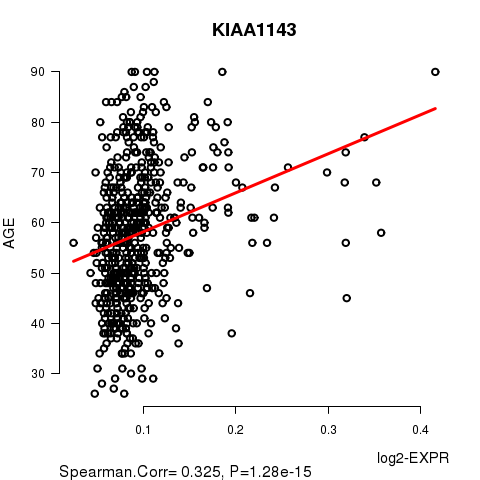
Table S5. Basic characteristics of clinical feature: 'GENDER'
| GENDER | Labels | N |
| FEMALE | 569 | |
| MALE | 6 | |
| Significant markers | N = 193 | |
| Higher in MALE | 50 | |
| Higher in FEMALE | 143 |
Table S6. Get Full Table List of top 10 genes differentially expressed by 'GENDER'
| T(pos if higher in 'MALE') | ttestP | Q | AUC | |
|---|---|---|---|---|
| ALDOC | -27.01 | 8.262e-102 | 1.65e-97 | 0.872 |
| ZNF486 | -19.2 | 1.713e-63 | 3.42e-59 | 0.8207 |
| C19ORF24 | 18.66 | 9.298e-61 | 1.85e-56 | 0.8225 |
| CIRBP__2 | 18.66 | 9.298e-61 | 1.85e-56 | 0.8225 |
| DNAJC15 | -14.13 | 4.057e-37 | 8.09e-33 | 0.7299 |
| NMNAT3 | -13.71 | 2.479e-36 | 4.94e-32 | 0.6977 |
| LOC400043 | -13.49 | 5.046e-32 | 1.01e-27 | 0.5971 |
| EML1 | -11.89 | 5.384e-29 | 1.07e-24 | 0.609 |
| RND2 | -13.34 | 3.968e-28 | 7.91e-24 | 0.7912 |
| SPC25 | -12.84 | 1.122e-27 | 2.24e-23 | 0.754 |
Figure S3. Get High-res Image As an example, this figure shows the association of ALDOC to 'GENDER'. P value = 8.26e-102 with T-test analysis.
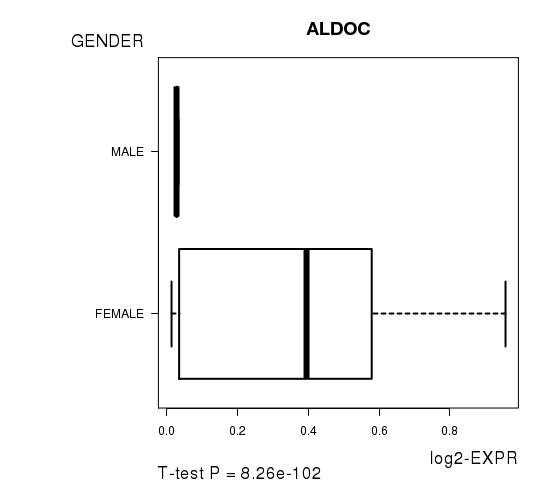
Table S7. Basic characteristics of clinical feature: 'HISTOLOGICAL.TYPE'
| HISTOLOGICAL.TYPE | Labels | N |
| INFILTRATING DUCTAL CARCINOMA | 420 | |
| INFILTRATING LOBULAR CARCINOMA | 95 | |
| MEDULLARY CARCINOMA | 4 | |
| MIXED HISTOLOGY (PLEASE SPECIFY) | 21 | |
| MUCINOUS CARCINOMA | 8 | |
| OTHER SPECIFY | 27 | |
| Significant markers | N = 448 |
Table S8. Get Full Table List of top 10 genes differentially expressed by 'HISTOLOGICAL.TYPE'
| ANOVA_P | Q | |
|---|---|---|
| ZNF230 | 2.339e-28 | 4.67e-24 |
| ZNF846 | 9.051e-24 | 1.81e-19 |
| JOSD2 | 1.319e-17 | 2.63e-13 |
| GTF2F1 | 6.828e-16 | 1.36e-11 |
| LOC100288730 | 7.101e-16 | 1.42e-11 |
| PAN3 | 7.101e-16 | 1.42e-11 |
| TAT | 1.092e-15 | 2.18e-11 |
| FN1 | 1.142e-14 | 2.28e-10 |
| TNK2 | 3.016e-14 | 6.01e-10 |
| GADD45B | 5.269e-14 | 1.05e-09 |
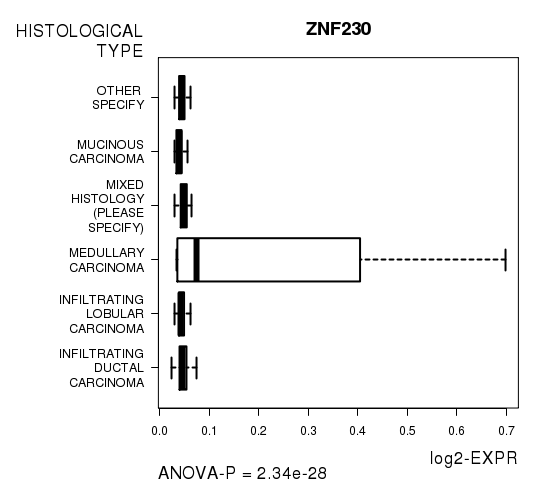
Figure S4. Get High-res Image As an example, this figure shows the association of ZNF230 to 'HISTOLOGICAL.TYPE'. P value = 2.34e-28 with ANOVA analysis.
204 genes related to 'RADIATIONS.RADIATION.REGIMENINDICATION'.
Table S9. Basic characteristics of clinical feature: 'RADIATIONS.RADIATION.REGIMENINDICATION'
| RADIATIONS.RADIATION.REGIMENINDICATION | Labels | N |
| NO | 147 | |
| YES | 428 | |
| Significant markers | N = 204 | |
| Higher in YES | 164 | |
| Higher in NO | 40 |
Table S10. Get Full Table List of top 10 genes differentially expressed by 'RADIATIONS.RADIATION.REGIMENINDICATION'
| T(pos if higher in 'YES') | ttestP | Q | AUC | |
|---|---|---|---|---|
| TUBA4A | 6.86 | 2.539e-11 | 5.07e-07 | 0.6536 |
| TUBA4B | 6.86 | 2.539e-11 | 5.07e-07 | 0.6536 |
| NDUFB4 | 6.73 | 8.652e-11 | 1.73e-06 | 0.6685 |
| SNRPF | 6.64 | 1.129e-10 | 2.25e-06 | 0.6555 |
| TBCA | 6.59 | 1.488e-10 | 2.97e-06 | 0.6524 |
| NECAP1 | 6.58 | 1.748e-10 | 3.49e-06 | 0.655 |
| C12ORF52__1 | 6.57 | 2.063e-10 | 4.12e-06 | 0.6606 |
| DDX54 | 6.57 | 2.063e-10 | 4.12e-06 | 0.6606 |
| TICAM1 | 6.55 | 2.471e-10 | 4.93e-06 | 0.6665 |
| HDGF | 6.33 | 7.247e-10 | 1.45e-05 | 0.6346 |
Figure S5. Get High-res Image As an example, this figure shows the association of TUBA4A to 'RADIATIONS.RADIATION.REGIMENINDICATION'. P value = 2.54e-11 with T-test analysis.
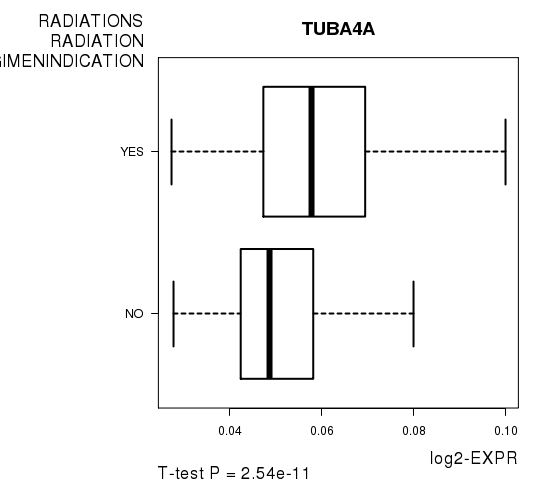
Table S11. Basic characteristics of clinical feature: 'DISTANT.METASTASIS'
| DISTANT.METASTASIS | Labels | N |
| CM0 (I+) | 1 | |
| M0 | 491 | |
| M1 | 6 | |
| MX | 77 | |
| Significant markers | N = 21 |
Table S12. Get Full Table List of top 10 genes differentially expressed by 'DISTANT.METASTASIS'
| ANOVA_P | Q | |
|---|---|---|
| RHBDL3 | 1.438e-22 | 2.87e-18 |
| MMAB | 6.135e-20 | 1.22e-15 |
| MVK | 6.135e-20 | 1.22e-15 |
| NHEDC1 | 4.245e-18 | 8.47e-14 |
| SAG | 1.073e-11 | 2.14e-07 |
| PACRGL | 9.222e-11 | 1.84e-06 |
| C9ORF153 | 1.743e-08 | 0.000348 |
| TRIM21 | 3.719e-08 | 0.000742 |
| LARS | 5.951e-08 | 0.00119 |
| AK1 | 7.499e-08 | 0.0015 |
Figure S6. Get High-res Image As an example, this figure shows the association of RHBDL3 to 'DISTANT.METASTASIS'. P value = 1.44e-22 with ANOVA analysis.
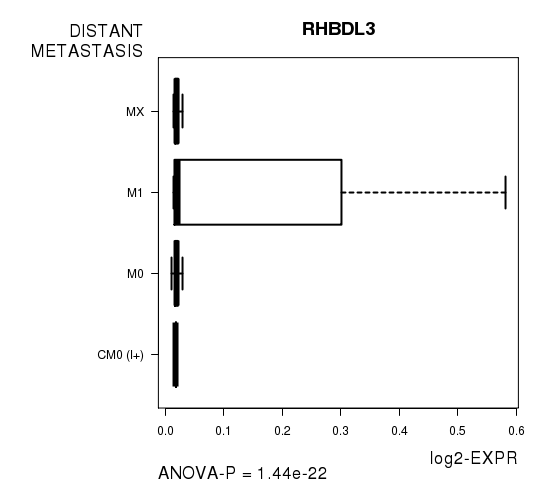
Table S13. Basic characteristics of clinical feature: 'LYMPH.NODE.METASTASIS'
| LYMPH.NODE.METASTASIS | Labels | N |
| N0 | 157 | |
| N0 (I+) | 14 | |
| N0 (I-) | 81 | |
| N0 (MOL+) | 1 | |
| N1 | 74 | |
| N1A | 87 | |
| N1B | 23 | |
| N1C | 2 | |
| N1MI | 15 | |
| N2 | 38 | |
| N2A | 43 | |
| N3 | 13 | |
| N3A | 18 | |
| N3B | 2 | |
| NX | 7 | |
| Significant markers | N = 76 |
Table S14. Get Full Table List of top 10 genes differentially expressed by 'LYMPH.NODE.METASTASIS'
| ANOVA_P | Q | |
|---|---|---|
| SS18L1__1 | 1.012e-76 | 2.02e-72 |
| ZNF235 | 8.102e-55 | 1.62e-50 |
| MANBAL | 4.687e-23 | 9.35e-19 |
| TPCN2 | 7.296e-19 | 1.46e-14 |
| ZNF33A | 6.593e-14 | 1.32e-09 |
| CLPP | 2.202e-11 | 4.39e-07 |
| LRRC29 | 2.859e-11 | 5.7e-07 |
| TMEM208 | 2.859e-11 | 5.7e-07 |
| KCNQ5 | 8.408e-11 | 1.68e-06 |
| RG9MTD1 | 1.84e-10 | 3.67e-06 |
Figure S7. Get High-res Image As an example, this figure shows the association of SS18L1__1 to 'LYMPH.NODE.METASTASIS'. P value = 1.01e-76 with ANOVA analysis.
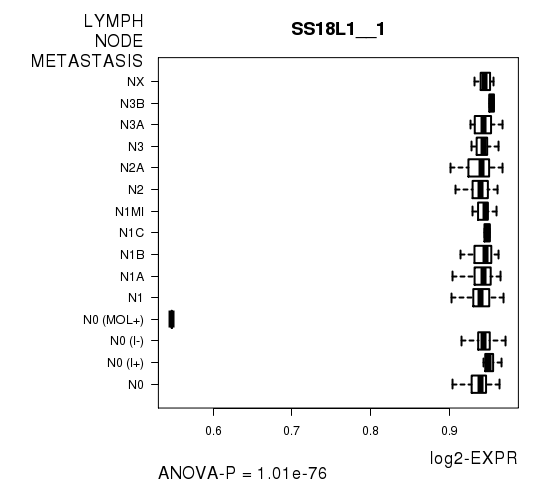
Table S15. Basic characteristics of clinical feature: 'NUMBER.OF.LYMPH.NODES'
| NUMBER.OF.LYMPH.NODES | Mean (SD) | 2.46 (4.6) |
| Significant markers | N = 1 | |
| pos. correlated | 1 | |
| neg. correlated | 0 |
Table S16. Get Full Table List of one gene significantly correlated to 'NUMBER.OF.LYMPH.NODES' by Spearman correlation test
| SpearmanCorr | corrP | Q | |
|---|---|---|---|
| TCP11L1 | 0.2122 | 7.435e-07 | 0.0148 |
Figure S8. Get High-res Image As an example, this figure shows the association of TCP11L1 to 'NUMBER.OF.LYMPH.NODES'. P value = 7.43e-07 with Spearman correlation analysis. The straight line presents the best linear regression.
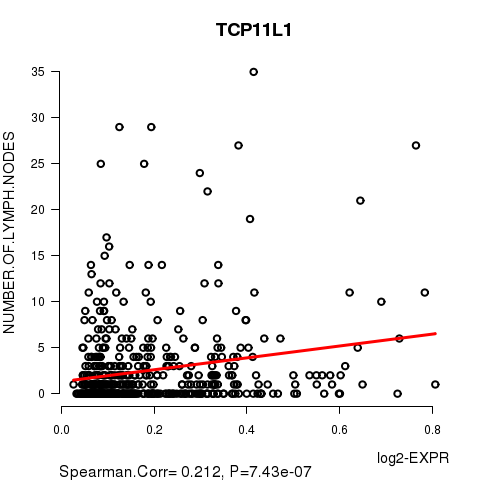
Table S17. Basic characteristics of clinical feature: 'NEOPLASM.DISEASESTAGE'
| NEOPLASM.DISEASESTAGE | Labels | N |
| STAGE I | 45 | |
| STAGE IA | 45 | |
| STAGE IB | 2 | |
| STAGE II | 8 | |
| STAGE IIA | 185 | |
| STAGE IIB | 131 | |
| STAGE III | 2 | |
| STAGE IIIA | 99 | |
| STAGE IIIB | 16 | |
| STAGE IIIC | 30 | |
| STAGE IV | 6 | |
| STAGE X | 5 | |
| Significant markers | N = 40 |
Table S18. Get Full Table List of top 10 genes differentially expressed by 'NEOPLASM.DISEASESTAGE'
| ANOVA_P | Q | |
|---|---|---|
| IDH3B | 1.961e-71 | 3.91e-67 |
| TMX4 | 9.656e-58 | 1.93e-53 |
| DRG2 | 5.338e-32 | 1.06e-27 |
| HIST1H4C | 3.88e-20 | 7.74e-16 |
| WDR74 | 2.603e-18 | 5.19e-14 |
| RHBDL3 | 1.252e-17 | 2.5e-13 |
| ATP5J | 1.388e-15 | 2.77e-11 |
| GABPA | 1.388e-15 | 2.77e-11 |
| LNP1 | 2.501e-15 | 4.99e-11 |
| TOMM70A | 2.501e-15 | 4.99e-11 |
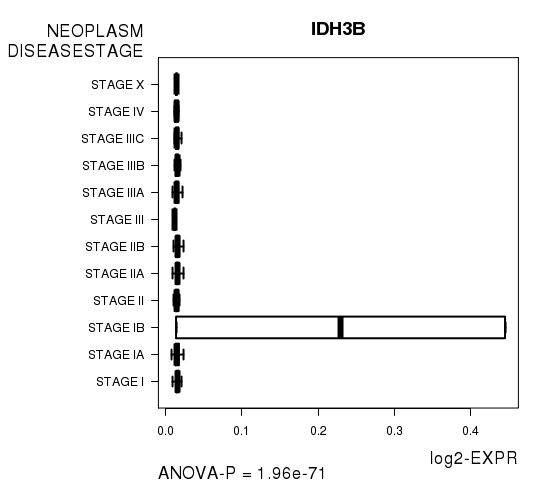
Figure S9. Get High-res Image As an example, this figure shows the association of IDH3B to 'NEOPLASM.DISEASESTAGE'. P value = 1.96e-71 with ANOVA analysis.
-
Expresson data file = BRCA-TP.meth.by_min_expr_corr.data.txt
-
Clinical data file = BRCA-TP.clin.merged.picked.txt
-
Number of patients = 575
-
Number of genes = 19950
-
Number of clinical features = 9
For survival clinical features, Wald's test in univariate Cox regression analysis with proportional hazards model (Andersen and Gill 1982) was used to estimate the P values using the 'coxph' function in R. Kaplan-Meier survival curves were plot using the four quartile subgroups of patients based on expression levels
For continuous numerical clinical features, Spearman's rank correlation coefficients (Spearman 1904) and two-tailed P values were estimated using 'cor.test' function in R
For two-class clinical features, two-tailed Student's t test with unequal variance (Lehmann and Romano 2005) was applied to compare the log2-expression levels between the two clinical classes using 't.test' function in R
For multi-class clinical features (ordinal or nominal), one-way analysis of variance (Howell 2002) was applied to compare the log2-expression levels between different clinical classes using 'anova' function in R
For multiple hypothesis correction, Q value is the False Discovery Rate (FDR) analogue of the P value (Benjamini and Hochberg 1995), defined as the minimum FDR at which the test may be called significant. We used the 'Benjamini and Hochberg' method of 'p.adjust' function in R to convert P values into Q values.
This is an experimental feature. The full results of the analysis summarized in this report can be downloaded from the TCGA Data Coordination Center.