This pipeline uses various statistical tests to identify RPPAs whose expression levels correlated to selected clinical features.
Testing the association between 142 genes and 9 clinical features across 408 samples, statistically thresholded by Q value < 0.05, 5 clinical features related to at least one genes.
-
16 genes correlated to 'AGE'.
-
ESR1|ER-ALPHA , STMN1|STATHMIN , CDC2|CDK1 , KIT|C-KIT , MET|C-MET_PY1235 , ...
-
6 genes correlated to 'HISTOLOGICAL.TYPE'.
-
CDH1|E-CADHERIN , CTNNB1|BETA-CATENIN , CTNNA1|ALPHA-CATENIN , TP53|P53 , CLDN7|CLAUDIN-7 , ...
-
1 gene correlated to 'DISTANT.METASTASIS'.
-
BCL2L1|BCL-XL
-
4 genes correlated to 'LYMPH.NODE.METASTASIS'.
-
PIK3CA |PI3K-P110-ALPHA , ERRFI1|MIG-6 , NF2|NF2 , EIF4EBP1|4E-BP1_PS65
-
2 genes correlated to 'NEOPLASM.DISEASESTAGE'.
-
BCL2L1|BCL-XL , COL6A1|COLLAGEN_VI
-
No genes correlated to 'Time to Death', 'GENDER', 'RADIATIONS.RADIATION.REGIMENINDICATION', and 'NUMBER.OF.LYMPH.NODES'.
Complete statistical result table is provided in Supplement Table 1
Table 1. Get Full Table This table shows the clinical features, statistical methods used, and the number of genes that are significantly associated with each clinical feature at Q value < 0.05.
| Clinical feature | Statistical test | Significant genes | Associated with | Associated with | ||
|---|---|---|---|---|---|---|
| Time to Death | Cox regression test | N=0 | ||||
| AGE | Spearman correlation test | N=16 | older | N=6 | younger | N=10 |
| GENDER | t test | N=0 | ||||
| HISTOLOGICAL TYPE | ANOVA test | N=6 | ||||
| RADIATIONS RADIATION REGIMENINDICATION | t test | N=0 | ||||
| DISTANT METASTASIS | ANOVA test | N=1 | ||||
| LYMPH NODE METASTASIS | ANOVA test | N=4 | ||||
| NUMBER OF LYMPH NODES | Spearman correlation test | N=0 | ||||
| NEOPLASM DISEASESTAGE | ANOVA test | N=2 |
Table S1. Basic characteristics of clinical feature: 'Time to Death'
| Time to Death | Duration (Months) | 0.1-189 (median=24.5) |
| censored | N = 336 | |
| death | N = 44 | |
| Significant markers | N = 0 |
Table S2. Basic characteristics of clinical feature: 'AGE'
| AGE | Mean (SD) | 57.85 (13) |
| Significant markers | N = 16 | |
| pos. correlated | 6 | |
| neg. correlated | 10 |
Table S3. Get Full Table List of top 10 genes significantly correlated to 'AGE' by Spearman correlation test
| SpearmanCorr | corrP | Q | |
|---|---|---|---|
| ESR1|ER-ALPHA | 0.3845 | 8.013e-16 | 1.14e-13 |
| STMN1|STATHMIN | -0.2322 | 2.125e-06 | 3e-04 |
| CDC2|CDK1 | -0.217 | 9.725e-06 | 0.00136 |
| KIT|C-KIT | -0.2159 | 1.09e-05 | 0.00151 |
| MET|C-MET_PY1235 | -0.2153 | 1.152e-05 | 0.00159 |
| AR|AR | 0.2085 | 2.189e-05 | 0.003 |
| CDH3|P-CADHERIN | -0.2082 | 2.242e-05 | 0.00305 |
| EGFR|EGFR | -0.2067 | 2.582e-05 | 0.00349 |
| NOTCH1|NOTCH1 | -0.1931 | 8.668e-05 | 0.0116 |
| TSC2|TUBERIN | 0.1914 | 0.0001003 | 0.0133 |
Figure S1. Get High-res Image As an example, this figure shows the association of ESR1|ER-ALPHA to 'AGE'. P value = 8.01e-16 with Spearman correlation analysis. The straight line presents the best linear regression.
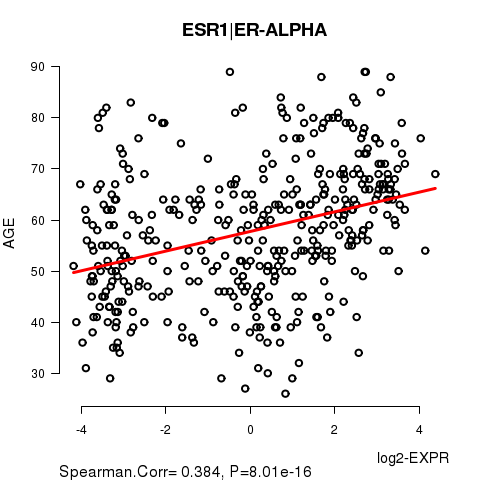
Table S4. Basic characteristics of clinical feature: 'GENDER'
| GENDER | Labels | N |
| FEMALE | 403 | |
| MALE | 5 | |
| Significant markers | N = 0 |
Table S5. Basic characteristics of clinical feature: 'HISTOLOGICAL.TYPE'
| HISTOLOGICAL.TYPE | Labels | N |
| INFILTRATING DUCTAL CARCINOMA | 353 | |
| INFILTRATING LOBULAR CARCINOMA | 30 | |
| MEDULLARY CARCINOMA | 1 | |
| MIXED HISTOLOGY (PLEASE SPECIFY) | 7 | |
| MUCINOUS CARCINOMA | 2 | |
| OTHER SPECIFY | 15 | |
| Significant markers | N = 6 |
Table S6. Get Full Table List of 6 genes differentially expressed by 'HISTOLOGICAL.TYPE'
| ANOVA_P | Q | |
|---|---|---|
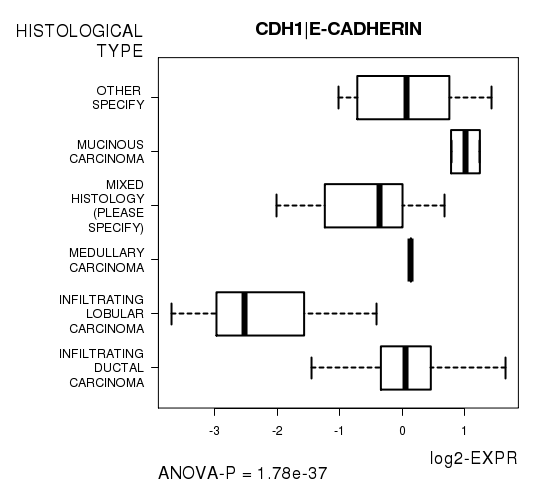
| CDH1|E-CADHERIN | 1.776e-37 | 2.52e-35 |
| CTNNB1|BETA-CATENIN | 1.443e-18 | 2.04e-16 |
| CTNNA1|ALPHA-CATENIN | 8.194e-15 | 1.15e-12 |
| TP53|P53 | 0.0001428 | 0.0199 |
| CLDN7|CLAUDIN-7 | 0.0001921 | 0.0265 |
| COL6A1|COLLAGEN_VI | 0.0002369 | 0.0325 |
Figure S2. Get High-res Image As an example, this figure shows the association of CDH1|E-CADHERIN to 'HISTOLOGICAL.TYPE'. P value = 1.78e-37 with ANOVA analysis.
No gene related to 'RADIATIONS.RADIATION.REGIMENINDICATION'.
Table S7. Basic characteristics of clinical feature: 'RADIATIONS.RADIATION.REGIMENINDICATION'
| RADIATIONS.RADIATION.REGIMENINDICATION | Labels | N |
| NO | 125 | |
| YES | 283 | |
| Significant markers | N = 0 |
Table S8. Basic characteristics of clinical feature: 'DISTANT.METASTASIS'
| DISTANT.METASTASIS | Labels | N |
| CM0 (I+) | 1 | |
| M0 | 386 | |
| M1 | 14 | |
| MX | 7 | |
| Significant markers | N = 1 |
Table S9. Get Full Table List of one gene differentially expressed by 'DISTANT.METASTASIS'
| ANOVA_P | Q | |
|---|---|---|
| BCL2L1|BCL-XL | 0.0002307 | 0.0328 |
Figure S3. Get High-res Image As an example, this figure shows the association of BCL2L1|BCL-XL to 'DISTANT.METASTASIS'. P value = 0.000231 with ANOVA analysis.
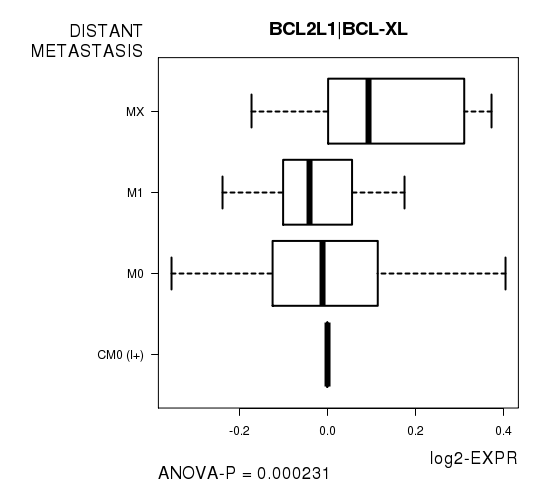
Table S10. Basic characteristics of clinical feature: 'LYMPH.NODE.METASTASIS'
| LYMPH.NODE.METASTASIS | Labels | N |
| N0 | 100 | |
| N0 (I+) | 13 | |
| N0 (I-) | 79 | |
| N1 | 48 | |
| N1A | 63 | |
| N1B | 8 | |
| N1C | 1 | |
| N1MI | 12 | |
| N2 | 27 | |
| N2A | 25 | |
| N3 | 9 | |
| N3A | 15 | |
| N3C | 1 | |
| NX | 7 | |
| Significant markers | N = 4 |
Table S11. Get Full Table List of 4 genes differentially expressed by 'LYMPH.NODE.METASTASIS'
| ANOVA_P | Q | |
|---|---|---|
| PIK3CA |PI3K-P110-ALPHA | 4.101e-28 | 5.82e-26 |
| ERRFI1|MIG-6 | 6.684e-06 | 0.000942 |
| NF2|NF2 | 8.796e-05 | 0.0123 |
| EIF4EBP1|4E-BP1_PS65 | 0.0002749 | 0.0382 |
Figure S4. Get High-res Image As an example, this figure shows the association of PIK3CA |PI3K-P110-ALPHA to 'LYMPH.NODE.METASTASIS'. P value = 4.1e-28 with ANOVA analysis.
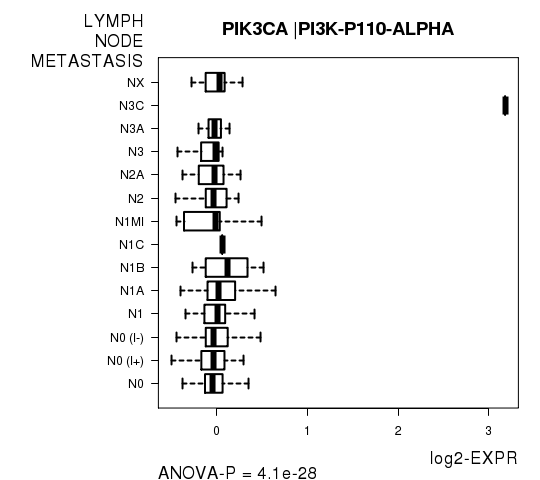
Table S12. Basic characteristics of clinical feature: 'NUMBER.OF.LYMPH.NODES'
| NUMBER.OF.LYMPH.NODES | Mean (SD) | 1.86 (3.5) |
| Significant markers | N = 0 |
Table S13. Basic characteristics of clinical feature: 'NEOPLASM.DISEASESTAGE'
| NEOPLASM.DISEASESTAGE | Labels | N |
| STAGE I | 30 | |
| STAGE IA | 31 | |
| STAGE IB | 4 | |
| STAGE IIA | 137 | |
| STAGE IIB | 94 | |
| STAGE IIIA | 62 | |
| STAGE IIIB | 13 | |
| STAGE IIIC | 15 | |
| STAGE IV | 14 | |
| STAGE X | 8 | |
| Significant markers | N = 2 |
Table S14. Get Full Table List of 2 genes differentially expressed by 'NEOPLASM.DISEASESTAGE'
| ANOVA_P | Q | |
|---|---|---|
| BCL2L1|BCL-XL | 1.663e-05 | 0.00236 |
| COL6A1|COLLAGEN_VI | 0.0001192 | 0.0168 |
Figure S5. Get High-res Image As an example, this figure shows the association of BCL2L1|BCL-XL to 'NEOPLASM.DISEASESTAGE'. P value = 1.66e-05 with ANOVA analysis.

-
Expresson data file = BRCA-TP.rppa.txt
-
Clinical data file = BRCA-TP.clin.merged.picked.txt
-
Number of patients = 408
-
Number of genes = 142
-
Number of clinical features = 9
For survival clinical features, Wald's test in univariate Cox regression analysis with proportional hazards model (Andersen and Gill 1982) was used to estimate the P values using the 'coxph' function in R. Kaplan-Meier survival curves were plot using the four quartile subgroups of patients based on expression levels
For continuous numerical clinical features, Spearman's rank correlation coefficients (Spearman 1904) and two-tailed P values were estimated using 'cor.test' function in R
For two-class clinical features, two-tailed Student's t test with unequal variance (Lehmann and Romano 2005) was applied to compare the log2-expression levels between the two clinical classes using 't.test' function in R
For multi-class clinical features (ordinal or nominal), one-way analysis of variance (Howell 2002) was applied to compare the log2-expression levels between different clinical classes using 'anova' function in R
For multiple hypothesis correction, Q value is the False Discovery Rate (FDR) analogue of the P value (Benjamini and Hochberg 1995), defined as the minimum FDR at which the test may be called significant. We used the 'Benjamini and Hochberg' method of 'p.adjust' function in R to convert P values into Q values.
This is an experimental feature. The full results of the analysis summarized in this report can be downloaded from the TCGA Data Coordination Center.