This pipeline uses various statistical tests to identify mRNAs whose expression levels correlated to selected clinical features.
Testing the association between 17814 genes and 9 clinical features across 526 samples, statistically thresholded by Q value < 0.05, 9 clinical features related to at least one genes.
-
2 genes correlated to 'Time to Death'.
-
RPS26 , PPP1R14D
-
393 genes correlated to 'AGE'.
-
ESR1 , CNTNAP3 , MAGED4B , KRT17 , KLK6 , ...
-
5 genes correlated to 'GENDER'.
-
TMEM16C , CACNG1 , MAPK4 , GSTA2 , P11
-
184 genes correlated to 'HISTOLOGICAL.TYPE'.
-
CDH1 , NRAP , MGC32805 , MAGEC3 , OR8D4 , ...
-
1 gene correlated to 'RADIATIONS.RADIATION.REGIMENINDICATION'.
-
OR13C4
-
1 gene correlated to 'DISTANT.METASTASIS'.
-
GBF1
-
10 genes correlated to 'LYMPH.NODE.METASTASIS'.
-
PIK3CA , KCNMB2 , GUCA2A , ARID1B , AMTN , ...
-
1 gene correlated to 'NUMBER.OF.LYMPH.NODES'.
-
CSDE1
-
24 genes correlated to 'NEOPLASM.DISEASESTAGE'.
-
NGFB , OR1M1 , PRKACG , OR6K3 , C20ORF71 , ...
Complete statistical result table is provided in Supplement Table 1
Table 1. Get Full Table This table shows the clinical features, statistical methods used, and the number of genes that are significantly associated with each clinical feature at Q value < 0.05.
| Clinical feature | Statistical test | Significant genes | Associated with | Associated with | ||
|---|---|---|---|---|---|---|
| Time to Death | Cox regression test | N=2 | shorter survival | N=2 | longer survival | N=0 |
| AGE | Spearman correlation test | N=393 | older | N=129 | younger | N=264 |
| GENDER | t test | N=5 | male | N=1 | female | N=4 |
| HISTOLOGICAL TYPE | ANOVA test | N=184 | ||||
| RADIATIONS RADIATION REGIMENINDICATION | t test | N=1 | yes | N=1 | no | N=0 |
| DISTANT METASTASIS | ANOVA test | N=1 | ||||
| LYMPH NODE METASTASIS | ANOVA test | N=10 | ||||
| NUMBER OF LYMPH NODES | Spearman correlation test | N=1 | higher number.of.lymph.nodes | N=0 | lower number.of.lymph.nodes | N=1 |
| NEOPLASM DISEASESTAGE | ANOVA test | N=24 |
Table S1. Basic characteristics of clinical feature: 'Time to Death'
| Time to Death | Duration (Months) | 0.1-223.4 (median=24.2) |
| censored | N = 429 | |
| death | N = 65 | |
| Significant markers | N = 2 | |
| associated with shorter survival | 2 | |
| associated with longer survival | 0 |
Table S2. Get Full Table List of 2 genes significantly associated with 'Time to Death' by Cox regression test
| HazardRatio | Wald_P | Q | C_index | |
|---|---|---|---|---|
| RPS26 | 2.7 | 2.118e-07 | 0.0038 | 0.676 |
| PPP1R14D | 2.2 | 6.448e-07 | 0.011 | 0.588 |
Figure S1. Get High-res Image As an example, this figure shows the association of RPS26 to 'Time to Death'. four curves present the cumulative survival rates of 4 quartile subsets of patients. P value = 2.12e-07 with univariate Cox regression analysis using continuous log-2 expression values.
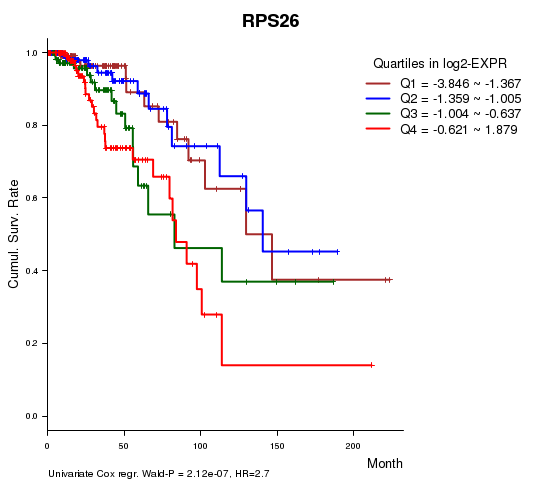
Table S3. Basic characteristics of clinical feature: 'AGE'
| AGE | Mean (SD) | 57.92 (13) |
| Significant markers | N = 393 | |
| pos. correlated | 129 | |
| neg. correlated | 264 |
Table S4. Get Full Table List of top 10 genes significantly correlated to 'AGE' by Spearman correlation test
| SpearmanCorr | corrP | Q | |
|---|---|---|---|
| ESR1 | 0.4217 | 4.262e-24 | 7.59e-20 |
| CNTNAP3 | -0.302 | 1.478e-12 | 2.63e-08 |
| MAGED4B | -0.301 | 1.763e-12 | 3.14e-08 |
| KRT17 | -0.2966 | 3.843e-12 | 6.84e-08 |
| KLK6 | -0.2908 | 1.035e-11 | 1.84e-07 |
| GJB3 | -0.288 | 1.66e-11 | 2.96e-07 |
| PPP1R14C | -0.288 | 1.679e-11 | 2.99e-07 |
| C20ORF42 | -0.2874 | 1.831e-11 | 3.26e-07 |
| SOSTDC1 | -0.2862 | 2.256e-11 | 4.02e-07 |
| SYT8 | -0.2858 | 2.387e-11 | 4.25e-07 |
Figure S2. Get High-res Image As an example, this figure shows the association of ESR1 to 'AGE'. P value = 4.26e-24 with Spearman correlation analysis. The straight line presents the best linear regression.
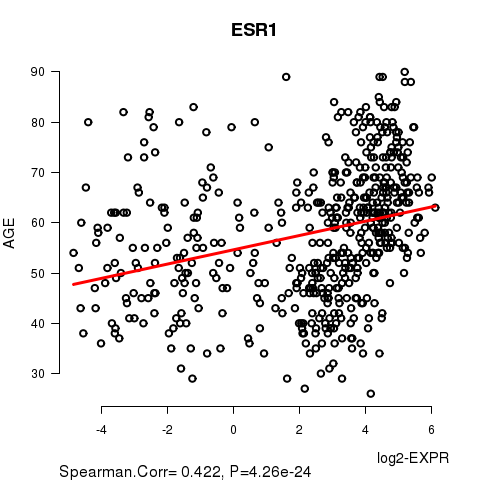
Table S5. Basic characteristics of clinical feature: 'GENDER'
| GENDER | Labels | N |
| FEMALE | 520 | |
| MALE | 6 | |
| Significant markers | N = 5 | |
| Higher in MALE | 1 | |
| Higher in FEMALE | 4 |
Table S6. Get Full Table List of 5 genes differentially expressed by 'GENDER'
| T(pos if higher in 'MALE') | ttestP | Q | AUC | |
|---|---|---|---|---|
| TMEM16C | -16.03 | 1.122e-14 | 2e-10 | 0.9324 |
| CACNG1 | 20.22 | 7.307e-10 | 1.3e-05 | 0.9625 |
| MAPK4 | -11.19 | 1.03e-09 | 1.83e-05 | 0.8146 |
| GSTA2 | -11.42 | 5.015e-07 | 0.00893 | 0.8657 |
| P11 | -7.66 | 6.366e-07 | 0.0113 | 0.6862 |
Figure S3. Get High-res Image As an example, this figure shows the association of TMEM16C to 'GENDER'. P value = 1.12e-14 with T-test analysis.
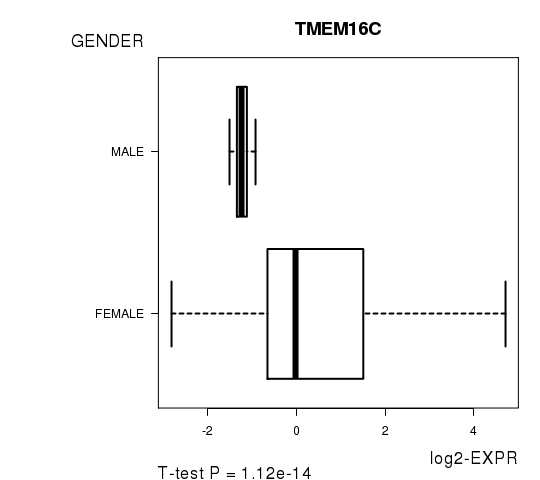
Table S7. Basic characteristics of clinical feature: 'HISTOLOGICAL.TYPE'
| HISTOLOGICAL.TYPE | Labels | N |
| INFILTRATING DUCTAL CARCINOMA | 449 | |
| INFILTRATING LOBULAR CARCINOMA | 41 | |
| MEDULLARY CARCINOMA | 1 | |
| MIXED HISTOLOGY (PLEASE SPECIFY) | 11 | |
| MUCINOUS CARCINOMA | 2 | |
| OTHER SPECIFY | 22 | |
| Significant markers | N = 184 |
Table S8. Get Full Table List of top 10 genes differentially expressed by 'HISTOLOGICAL.TYPE'
| ANOVA_P | Q | |
|---|---|---|
| CDH1 | 8.624e-44 | 1.54e-39 |
| NRAP | 4.396e-13 | 7.83e-09 |
| MGC32805 | 2.321e-12 | 4.13e-08 |
| MAGEC3 | 5.313e-12 | 9.46e-08 |
| OR8D4 | 3.131e-11 | 5.58e-07 |
| ADAD1 | 1.624e-10 | 2.89e-06 |
| GLTSCR2 | 1.988e-10 | 3.54e-06 |
| PPIL1 | 2.802e-10 | 4.99e-06 |
| C15ORF2 | 3.611e-10 | 6.43e-06 |
| IL17F | 4.904e-10 | 8.73e-06 |
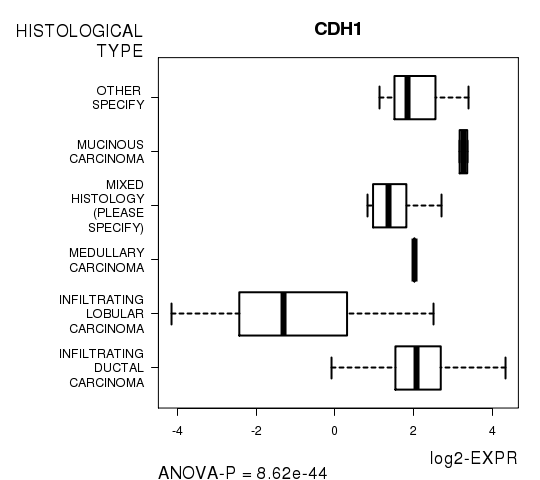
Figure S4. Get High-res Image As an example, this figure shows the association of CDH1 to 'HISTOLOGICAL.TYPE'. P value = 8.62e-44 with ANOVA analysis.
One gene related to 'RADIATIONS.RADIATION.REGIMENINDICATION'.
Table S9. Basic characteristics of clinical feature: 'RADIATIONS.RADIATION.REGIMENINDICATION'
| RADIATIONS.RADIATION.REGIMENINDICATION | Labels | N |
| NO | 148 | |
| YES | 378 | |
| Significant markers | N = 1 | |
| Higher in YES | 1 | |
| Higher in NO | 0 |
Table S10. Get Full Table List of one gene differentially expressed by 'RADIATIONS.RADIATION.REGIMENINDICATION'
| T(pos if higher in 'YES') | ttestP | Q | AUC | |
|---|---|---|---|---|
| OR13C4 | 5.14 | 5.471e-07 | 0.00975 | 0.6324 |
Figure S5. Get High-res Image As an example, this figure shows the association of OR13C4 to 'RADIATIONS.RADIATION.REGIMENINDICATION'. P value = 5.47e-07 with T-test analysis.
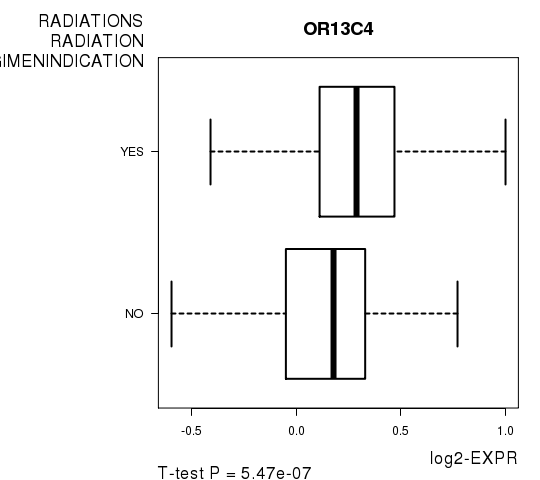
Table S11. Basic characteristics of clinical feature: 'DISTANT.METASTASIS'
| DISTANT.METASTASIS | Labels | N |
| CM0 (I+) | 2 | |
| M0 | 496 | |
| M1 | 14 | |
| MX | 14 | |
| Significant markers | N = 1 |
Table S12. Get Full Table List of one gene differentially expressed by 'DISTANT.METASTASIS'
| ANOVA_P | Q | |
|---|---|---|
| GBF1 | 2.538e-06 | 0.0452 |
Figure S6. Get High-res Image As an example, this figure shows the association of GBF1 to 'DISTANT.METASTASIS'. P value = 2.54e-06 with ANOVA analysis.
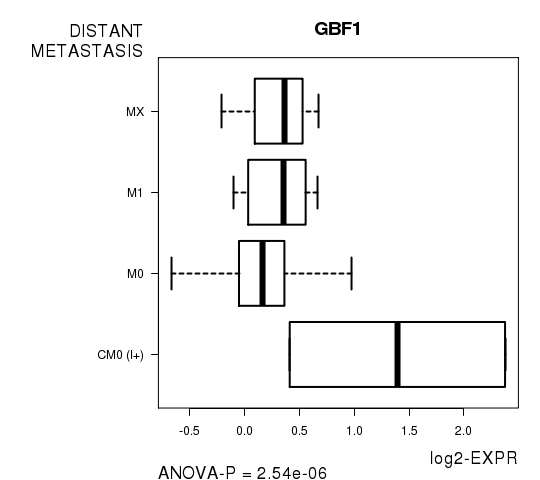
Table S13. Basic characteristics of clinical feature: 'LYMPH.NODE.METASTASIS'
| LYMPH.NODE.METASTASIS | Labels | N |
| N0 | 138 | |
| N0 (I+) | 16 | |
| N0 (I-) | 101 | |
| N1 | 58 | |
| N1A | 77 | |
| N1B | 20 | |
| N1C | 2 | |
| N1MI | 13 | |
| N2 | 32 | |
| N2A | 29 | |
| N3 | 10 | |
| N3A | 18 | |
| N3C | 1 | |
| NX | 11 | |
| Significant markers | N = 10 |
Table S14. Get Full Table List of 10 genes differentially expressed by 'LYMPH.NODE.METASTASIS'
| ANOVA_P | Q | |
|---|---|---|
| PIK3CA | 1.949e-23 | 3.47e-19 |
| KCNMB2 | 1.488e-18 | 2.65e-14 |
| GUCA2A | 3.424e-14 | 6.1e-10 |
| ARID1B | 7.723e-08 | 0.00138 |
| AMTN | 1.016e-07 | 0.00181 |
| PDS5A | 1.786e-07 | 0.00318 |
| REG1B | 1.872e-07 | 0.00333 |
| SULT1B1 | 3.372e-07 | 0.006 |
| C16ORF44 | 8.574e-07 | 0.0153 |
| H1FNT | 2.519e-06 | 0.0449 |
Figure S7. Get High-res Image As an example, this figure shows the association of PIK3CA to 'LYMPH.NODE.METASTASIS'. P value = 1.95e-23 with ANOVA analysis.
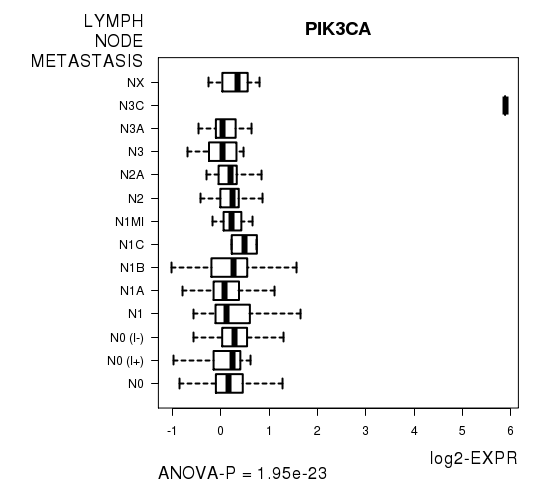
Table S15. Basic characteristics of clinical feature: 'NUMBER.OF.LYMPH.NODES'
| NUMBER.OF.LYMPH.NODES | Mean (SD) | 1.83 (3.5) |
| Significant markers | N = 1 | |
| pos. correlated | 0 | |
| neg. correlated | 1 |
Table S16. Get Full Table List of one gene significantly correlated to 'NUMBER.OF.LYMPH.NODES' by Spearman correlation test
| SpearmanCorr | corrP | Q | |
|---|---|---|---|
| CSDE1 | -0.2306 | 2.646e-06 | 0.0471 |
Figure S8. Get High-res Image As an example, this figure shows the association of CSDE1 to 'NUMBER.OF.LYMPH.NODES'. P value = 2.65e-06 with Spearman correlation analysis. The straight line presents the best linear regression.
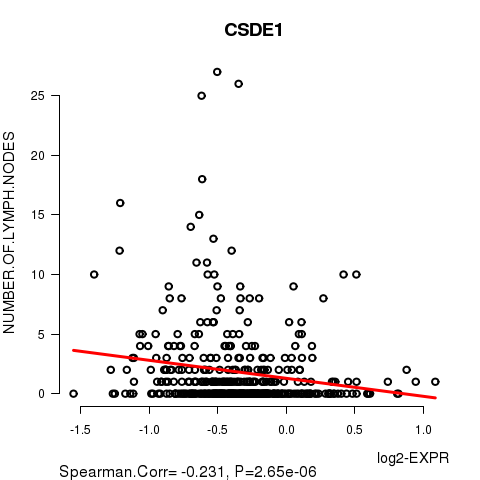
Table S17. Basic characteristics of clinical feature: 'NEOPLASM.DISEASESTAGE'
| NEOPLASM.DISEASESTAGE | Labels | N |
| STAGE I | 42 | |
| STAGE IA | 41 | |
| STAGE IB | 6 | |
| STAGE IIA | 185 | |
| STAGE IIB | 110 | |
| STAGE IIIA | 77 | |
| STAGE IIIB | 15 | |
| STAGE IIIC | 19 | |
| STAGE IV | 14 | |
| STAGE TIS | 1 | |
| STAGE X | 16 | |
| Significant markers | N = 24 |
Table S18. Get Full Table List of top 10 genes differentially expressed by 'NEOPLASM.DISEASESTAGE'
| ANOVA_P | Q | |
|---|---|---|
| NGFB | 6.535e-23 | 1.16e-18 |
| OR1M1 | 4.553e-21 | 8.11e-17 |
| PRKACG | 9.251e-15 | 1.65e-10 |
| OR6K3 | 3.085e-13 | 5.49e-09 |
| C20ORF71 | 1.358e-12 | 2.42e-08 |
| IFNA7 | 5.598e-12 | 9.97e-08 |
| GPR52 | 1.144e-10 | 2.04e-06 |
| TAS2R40 | 3.83e-10 | 6.82e-06 |
| SEBOX | 6.362e-10 | 1.13e-05 |
| OR1J4 | 1.211e-09 | 2.16e-05 |
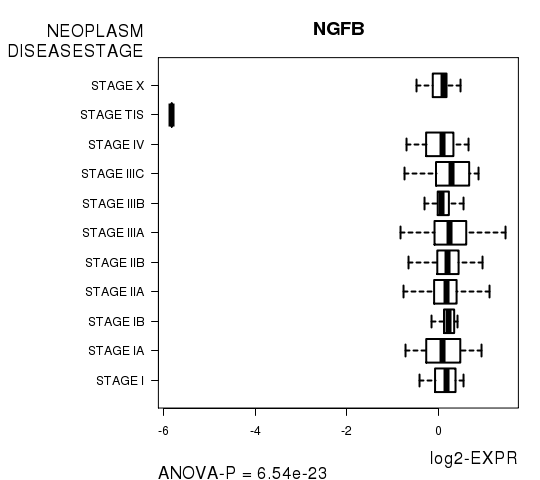
Figure S9. Get High-res Image As an example, this figure shows the association of NGFB to 'NEOPLASM.DISEASESTAGE'. P value = 6.54e-23 with ANOVA analysis.
-
Expresson data file = BRCA-TP.medianexp.txt
-
Clinical data file = BRCA-TP.clin.merged.picked.txt
-
Number of patients = 526
-
Number of genes = 17814
-
Number of clinical features = 9
For survival clinical features, Wald's test in univariate Cox regression analysis with proportional hazards model (Andersen and Gill 1982) was used to estimate the P values using the 'coxph' function in R. Kaplan-Meier survival curves were plot using the four quartile subgroups of patients based on expression levels
For continuous numerical clinical features, Spearman's rank correlation coefficients (Spearman 1904) and two-tailed P values were estimated using 'cor.test' function in R
For two-class clinical features, two-tailed Student's t test with unequal variance (Lehmann and Romano 2005) was applied to compare the log2-expression levels between the two clinical classes using 't.test' function in R
For multi-class clinical features (ordinal or nominal), one-way analysis of variance (Howell 2002) was applied to compare the log2-expression levels between different clinical classes using 'anova' function in R
For multiple hypothesis correction, Q value is the False Discovery Rate (FDR) analogue of the P value (Benjamini and Hochberg 1995), defined as the minimum FDR at which the test may be called significant. We used the 'Benjamini and Hochberg' method of 'p.adjust' function in R to convert P values into Q values.
This is an experimental feature. The full results of the analysis summarized in this report can be downloaded from the TCGA Data Coordination Center.