This pipeline uses various statistical tests to identify mRNAs whose expression levels correlated to selected clinical features.
Testing the association between 18279 genes and 9 clinical features across 877 samples, statistically thresholded by Q value < 0.05, 7 clinical features related to at least one genes.
-
6 genes correlated to 'Time to Death'.
-
DIP2B|57609 , CAND1|55832 , NFKBIA|4792 , PGK1|5230 , LRP11|84918 , ...
-
774 genes correlated to 'AGE'.
-
ESR1|2099 , LRFN5|145581 , TFPI2|7980 , TMEFF1|8577 , DZIP1|22873 , ...
-
19 genes correlated to 'GENDER'.
-
NLGN4Y|22829 , ZFY|7544 , PRKY|5616 , C7ORF10|79783 , SYT9|143425 , ...
-
3599 genes correlated to 'HISTOLOGICAL.TYPE'.
-
CDH1|999 , RAPGEF3|10411 , LRRC70|100130733 , MUC2|4583 , PSMD14|10213 , ...
-
44 genes correlated to 'LYMPH.NODE.METASTASIS'.
-
PIK3CA|5290 , BTBD10|84280 , RPL35|11224 , HSPA8|3312 , C19ORF21|126353 , ...
-
1 gene correlated to 'NUMBER.OF.LYMPH.NODES'.
-
HMSD|284293
-
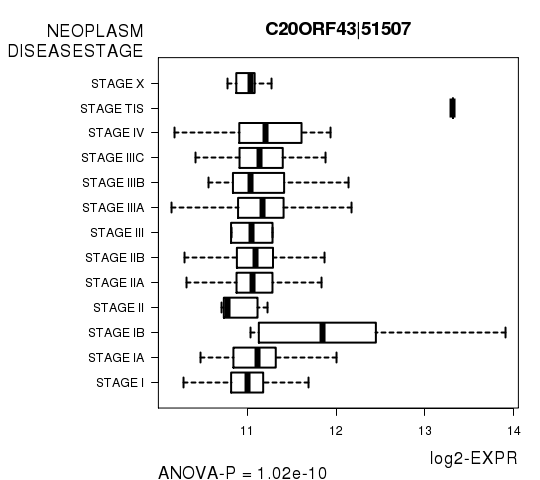
3 genes correlated to 'NEOPLASM.DISEASESTAGE'.
-
C20ORF43|51507 , CSTF1|1477 , PGGT1B|5229
-
No genes correlated to 'RADIATIONS.RADIATION.REGIMENINDICATION', and 'DISTANT.METASTASIS'.
Complete statistical result table is provided in Supplement Table 1
Table 1. Get Full Table This table shows the clinical features, statistical methods used, and the number of genes that are significantly associated with each clinical feature at Q value < 0.05.
| Clinical feature | Statistical test | Significant genes | Associated with | Associated with | ||
|---|---|---|---|---|---|---|
| Time to Death | Cox regression test | N=6 | shorter survival | N=4 | longer survival | N=2 |
| AGE | Spearman correlation test | N=774 | older | N=201 | younger | N=573 |
| GENDER | t test | N=19 | male | N=8 | female | N=11 |
| HISTOLOGICAL TYPE | ANOVA test | N=3599 | ||||
| RADIATIONS RADIATION REGIMENINDICATION | t test | N=0 | ||||
| DISTANT METASTASIS | ANOVA test | N=0 | ||||
| LYMPH NODE METASTASIS | ANOVA test | N=44 | ||||
| NUMBER OF LYMPH NODES | Spearman correlation test | N=1 | higher number.of.lymph.nodes | N=0 | lower number.of.lymph.nodes | N=1 |
| NEOPLASM DISEASESTAGE | ANOVA test | N=3 |
Table S1. Basic characteristics of clinical feature: 'Time to Death'
| Time to Death | Duration (Months) | 0-223.4 (median=18.2) |
| censored | N = 723 | |
| death | N = 96 | |
| Significant markers | N = 6 | |
| associated with shorter survival | 4 | |
| associated with longer survival | 2 |
Table S2. Get Full Table List of 6 genes significantly associated with 'Time to Death' by Cox regression test
| HazardRatio | Wald_P | Q | C_index | |
|---|---|---|---|---|
| DIP2B|57609 | 3 | 6.028e-08 | 0.0011 | 0.634 |
| CAND1|55832 | 2 | 1.3e-06 | 0.024 | 0.623 |
| NFKBIA|4792 | 0.42 | 1.493e-06 | 0.027 | 0.362 |
| PGK1|5230 | 2 | 1.595e-06 | 0.029 | 0.679 |
| LRP11|84918 | 1.9 | 1.624e-06 | 0.03 | 0.633 |
| IRF2|3660 | 0.29 | 1.805e-06 | 0.033 | 0.332 |
Figure S1. Get High-res Image As an example, this figure shows the association of DIP2B|57609 to 'Time to Death'. four curves present the cumulative survival rates of 4 quartile subsets of patients. P value = 6.03e-08 with univariate Cox regression analysis using continuous log-2 expression values.
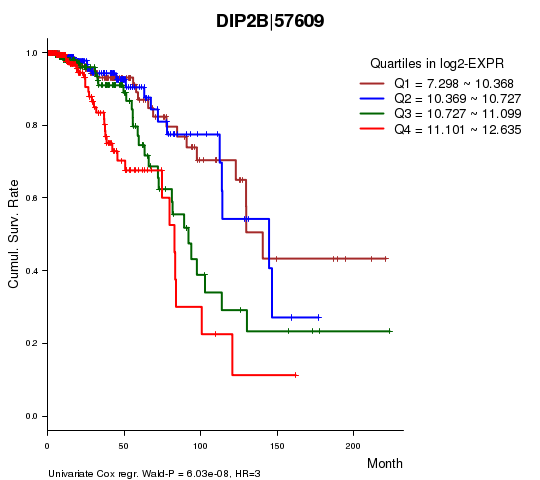
Table S3. Basic characteristics of clinical feature: 'AGE'
| AGE | Mean (SD) | 58.42 (13) |
| Significant markers | N = 774 | |
| pos. correlated | 201 | |
| neg. correlated | 573 |
Table S4. Get Full Table List of top 10 genes significantly correlated to 'AGE' by Spearman correlation test
| SpearmanCorr | corrP | Q | |
|---|---|---|---|
| ESR1|2099 | 0.3563 | 1.298e-27 | 2.37e-23 |
| LRFN5|145581 | -0.2627 | 5.621e-15 | 1.03e-10 |
| TFPI2|7980 | -0.2608 | 5.748e-15 | 1.05e-10 |
| TMEFF1|8577 | -0.2583 | 8.144e-15 | 1.49e-10 |
| DZIP1|22873 | -0.2502 | 5.694e-14 | 1.04e-09 |
| DSC2|1824 | -0.2472 | 1.15e-13 | 2.1e-09 |
| DBX2|440097 | -0.2644 | 1.992e-13 | 3.64e-09 |
| FMO1|2326 | -0.2437 | 2.665e-13 | 4.87e-09 |
| DIO2|1734 | -0.2428 | 3.183e-13 | 5.82e-09 |
| PCDH18|54510 | -0.2401 | 5.898e-13 | 1.08e-08 |
Figure S2. Get High-res Image As an example, this figure shows the association of ESR1|2099 to 'AGE'. P value = 1.3e-27 with Spearman correlation analysis. The straight line presents the best linear regression.
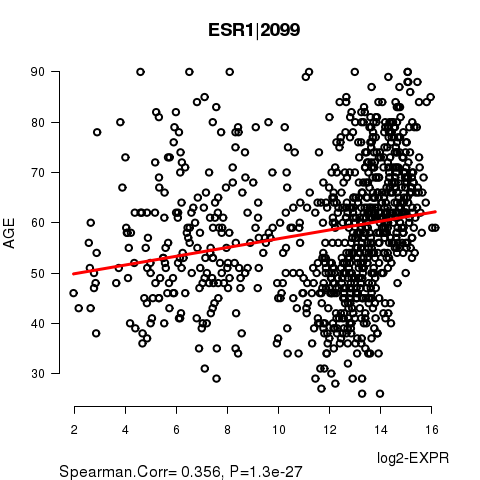
Table S5. Basic characteristics of clinical feature: 'GENDER'
| GENDER | Labels | N |
| FEMALE | 868 | |
| MALE | 9 | |
| Significant markers | N = 19 | |
| Higher in MALE | 8 | |
| Higher in FEMALE | 11 |
Table S6. Get Full Table List of top 10 genes differentially expressed by 'GENDER'
| T(pos if higher in 'MALE') | ttestP | Q | AUC | |
|---|---|---|---|---|
| NLGN4Y|22829 | 41.35 | 2.846e-12 | 5.12e-08 | 1 |
| ZFY|7544 | 42.09 | 1.917e-11 | 3.45e-07 | 1 |
| PRKY|5616 | 27.64 | 6.778e-10 | 1.22e-05 | 1 |
| C7ORF10|79783 | 8.94 | 2.705e-09 | 4.86e-05 | 0.6669 |
| SYT9|143425 | 12.49 | 8.247e-09 | 0.000148 | 0.7952 |
| GSTA1|2938 | -16.33 | 1.16e-08 | 0.000208 | 0.8872 |
| MMP11|4320 | 11.37 | 1.403e-08 | 0.000252 | 0.7526 |
| RND2|8153 | 12.09 | 4.105e-08 | 0.000738 | 0.829 |
| HTR4|3360 | -12.33 | 1.31e-07 | 0.00235 | 0.7979 |
| SNORA74B|677841 | -12 | 1.568e-07 | 0.00282 | 0.8387 |
Figure S3. Get High-res Image As an example, this figure shows the association of NLGN4Y|22829 to 'GENDER'. P value = 2.85e-12 with T-test analysis.
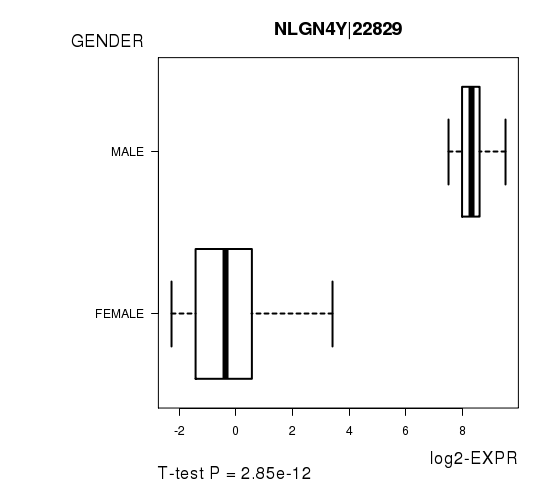
Table S7. Basic characteristics of clinical feature: 'HISTOLOGICAL.TYPE'
| HISTOLOGICAL.TYPE | Labels | N |
| INFILTRATING DUCTAL CARCINOMA | 682 | |
| INFILTRATING LOBULAR CARCINOMA | 116 | |
| MEDULLARY CARCINOMA | 4 | |
| MIXED HISTOLOGY (PLEASE SPECIFY) | 25 | |
| MUCINOUS CARCINOMA | 10 | |
| OTHER SPECIFY | 40 | |
| Significant markers | N = 3599 |
Table S8. Get Full Table List of top 10 genes differentially expressed by 'HISTOLOGICAL.TYPE'
| ANOVA_P | Q | |
|---|---|---|
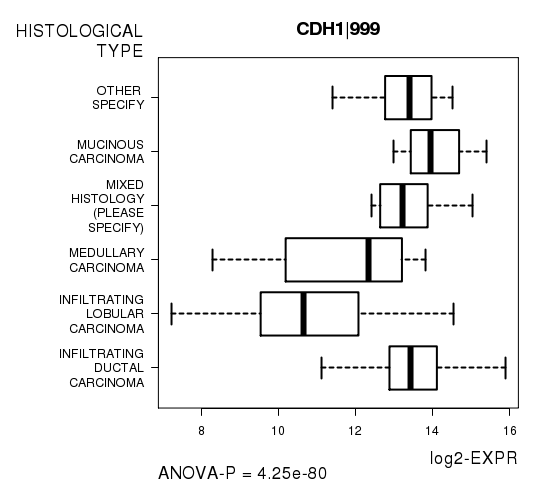
| CDH1|999 | 4.248e-80 | 7.77e-76 |
| RAPGEF3|10411 | 7.163e-30 | 1.31e-25 |
| LRRC70|100130733 | 3.467e-29 | 6.34e-25 |
| MUC2|4583 | 7.76e-29 | 1.42e-24 |
| PSMD14|10213 | 1.558e-28 | 2.85e-24 |
| BTG2|7832 | 3.389e-28 | 6.19e-24 |
| AVPR2|554 | 4.544e-28 | 8.3e-24 |
| SDPR|8436 | 5.083e-28 | 9.29e-24 |
| USHBP1|83878 | 6.156e-28 | 1.12e-23 |
| GPIHBP1|338328 | 1.741e-27 | 3.18e-23 |
Figure S4. Get High-res Image As an example, this figure shows the association of CDH1|999 to 'HISTOLOGICAL.TYPE'. P value = 4.25e-80 with ANOVA analysis.
No gene related to 'RADIATIONS.RADIATION.REGIMENINDICATION'.
Table S9. Basic characteristics of clinical feature: 'RADIATIONS.RADIATION.REGIMENINDICATION'
| RADIATIONS.RADIATION.REGIMENINDICATION | Labels | N |
| NO | 213 | |
| YES | 664 | |
| Significant markers | N = 0 |
Table S10. Basic characteristics of clinical feature: 'DISTANT.METASTASIS'
| DISTANT.METASTASIS | Labels | N |
| CM0 (I+) | 2 | |
| M0 | 778 | |
| M1 | 15 | |
| MX | 82 | |
| Significant markers | N = 0 |
Table S11. Basic characteristics of clinical feature: 'LYMPH.NODE.METASTASIS'
| LYMPH.NODE.METASTASIS | Labels | N |
| N0 | 256 | |
| N0 (I+) | 22 | |
| N0 (I-) | 135 | |
| N0 (MOL+) | 1 | |
| N1 | 104 | |
| N1A | 130 | |
| N1B | 32 | |
| N1C | 2 | |
| N1MI | 24 | |
| N2 | 50 | |
| N2A | 54 | |
| N3 | 19 | |
| N3A | 31 | |
| N3B | 1 | |
| N3C | 1 | |
| NX | 15 | |
| Significant markers | N = 44 |
Table S12. Get Full Table List of top 10 genes differentially expressed by 'LYMPH.NODE.METASTASIS'
| ANOVA_P | Q | |
|---|---|---|
| PIK3CA|5290 | 3.444e-13 | 6.3e-09 |
| BTBD10|84280 | 7.398e-13 | 1.35e-08 |
| RPL35|11224 | 1.982e-09 | 3.62e-05 |
| HSPA8|3312 | 3.46e-09 | 6.32e-05 |
| C19ORF21|126353 | 5.023e-09 | 9.18e-05 |
| SERINC3|10955 | 1.61e-08 | 0.000294 |
| UBR1|197131 | 6.044e-08 | 0.0011 |
| RPL12|6136 | 6.892e-08 | 0.00126 |
| RPL34|6164 | 1.223e-07 | 0.00223 |
| SPPL3|121665 | 1.389e-07 | 0.00254 |
Figure S5. Get High-res Image As an example, this figure shows the association of PIK3CA|5290 to 'LYMPH.NODE.METASTASIS'. P value = 3.44e-13 with ANOVA analysis.
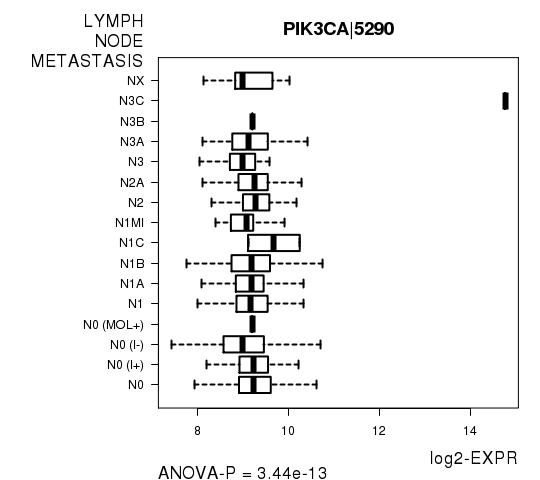
Table S13. Basic characteristics of clinical feature: 'NUMBER.OF.LYMPH.NODES'
| NUMBER.OF.LYMPH.NODES | Mean (SD) | 2.2 (4.4) |
| Significant markers | N = 1 | |
| pos. correlated | 0 | |
| neg. correlated | 1 |
Table S14. Get Full Table List of one gene significantly correlated to 'NUMBER.OF.LYMPH.NODES' by Spearman correlation test
| SpearmanCorr | corrP | Q | |
|---|---|---|---|
| HMSD|284293 | -0.2644 | 1.921e-08 | 0.000351 |
Figure S6. Get High-res Image As an example, this figure shows the association of HMSD|284293 to 'NUMBER.OF.LYMPH.NODES'. P value = 1.92e-08 with Spearman correlation analysis. The straight line presents the best linear regression.
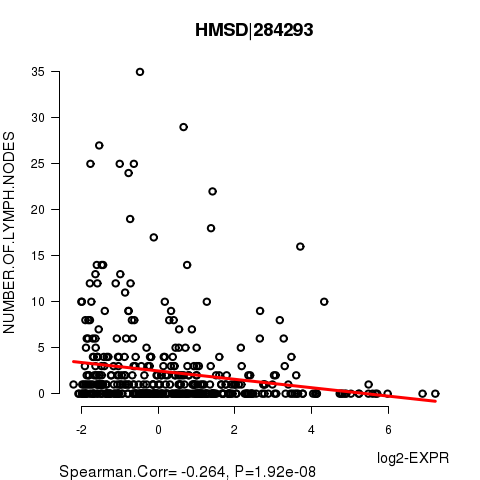
Table S15. Basic characteristics of clinical feature: 'NEOPLASM.DISEASESTAGE'
| NEOPLASM.DISEASESTAGE | Labels | N |
| STAGE I | 72 | |
| STAGE IA | 69 | |
| STAGE IB | 7 | |
| STAGE II | 8 | |
| STAGE IIA | 296 | |
| STAGE IIB | 198 | |
| STAGE III | 2 | |
| STAGE IIIA | 125 | |
| STAGE IIIB | 25 | |
| STAGE IIIC | 41 | |
| STAGE IV | 15 | |
| STAGE TIS | 1 | |
| STAGE X | 17 | |
| Significant markers | N = 3 |
Table S16. Get Full Table List of 3 genes differentially expressed by 'NEOPLASM.DISEASESTAGE'
| ANOVA_P | Q | |
|---|---|---|
| C20ORF43|51507 | 1.021e-10 | 1.87e-06 |
| CSTF1|1477 | 1.901e-08 | 0.000348 |
| PGGT1B|5229 | 2.103e-07 | 0.00384 |
Figure S7. Get High-res Image As an example, this figure shows the association of C20ORF43|51507 to 'NEOPLASM.DISEASESTAGE'. P value = 1.02e-10 with ANOVA analysis.
-
Expresson data file = BRCA-TP.uncv2.mRNAseq_RSEM_normalized_log2.txt
-
Clinical data file = BRCA-TP.clin.merged.picked.txt
-
Number of patients = 877
-
Number of genes = 18279
-
Number of clinical features = 9
For survival clinical features, Wald's test in univariate Cox regression analysis with proportional hazards model (Andersen and Gill 1982) was used to estimate the P values using the 'coxph' function in R. Kaplan-Meier survival curves were plot using the four quartile subgroups of patients based on expression levels
For continuous numerical clinical features, Spearman's rank correlation coefficients (Spearman 1904) and two-tailed P values were estimated using 'cor.test' function in R
For two-class clinical features, two-tailed Student's t test with unequal variance (Lehmann and Romano 2005) was applied to compare the log2-expression levels between the two clinical classes using 't.test' function in R
For multi-class clinical features (ordinal or nominal), one-way analysis of variance (Howell 2002) was applied to compare the log2-expression levels between different clinical classes using 'anova' function in R
For multiple hypothesis correction, Q value is the False Discovery Rate (FDR) analogue of the P value (Benjamini and Hochberg 1995), defined as the minimum FDR at which the test may be called significant. We used the 'Benjamini and Hochberg' method of 'p.adjust' function in R to convert P values into Q values.
This is an experimental feature. The full results of the analysis summarized in this report can be downloaded from the TCGA Data Coordination Center.