This pipeline uses various statistical tests to identify miRs whose expression levels correlated to selected clinical features.
Testing the association between 496 genes and 9 clinical features across 868 samples, statistically thresholded by Q value < 0.05, 6 clinical features related to at least one genes.
-
1 gene correlated to 'Time to Death'.
-
HSA-MIR-874
-
26 genes correlated to 'AGE'.
-
HSA-MIR-424 , HSA-MIR-31 , HSA-MIR-598 , HSA-MIR-542 , HSA-MIR-99A , ...
-
301 genes correlated to 'HISTOLOGICAL.TYPE'.
-
HSA-MIR-210 , HSA-MIR-301A , HSA-MIR-616 , HSA-MIR-501 , HSA-MIR-3653 , ...
-
3 genes correlated to 'DISTANT.METASTASIS'.
-
HSA-MIR-2276 , HSA-MIR-374C , HSA-MIR-3174
-
6 genes correlated to 'LYMPH.NODE.METASTASIS'.
-
HSA-MIR-374C , HSA-MIR-874 , HSA-MIR-197 , HSA-MIR-92A-1 , HSA-MIR-574 , ...
-
9 genes correlated to 'NEOPLASM.DISEASESTAGE'.
-
HSA-MIR-143 , HSA-MIR-210 , HSA-LET-7F-2 , HSA-MIR-200A , HSA-MIR-374C , ...
-
No genes correlated to 'GENDER', 'RADIATIONS.RADIATION.REGIMENINDICATION', and 'NUMBER.OF.LYMPH.NODES'.
Complete statistical result table is provided in Supplement Table 1
Table 1. Get Full Table This table shows the clinical features, statistical methods used, and the number of genes that are significantly associated with each clinical feature at Q value < 0.05.
| Clinical feature | Statistical test | Significant genes | Associated with | Associated with | ||
|---|---|---|---|---|---|---|
| Time to Death | Cox regression test | N=1 | shorter survival | N=1 | longer survival | N=0 |
| AGE | Spearman correlation test | N=26 | older | N=2 | younger | N=24 |
| GENDER | t test | N=0 | ||||
| HISTOLOGICAL TYPE | ANOVA test | N=301 | ||||
| RADIATIONS RADIATION REGIMENINDICATION | t test | N=0 | ||||
| DISTANT METASTASIS | ANOVA test | N=3 | ||||
| LYMPH NODE METASTASIS | ANOVA test | N=6 | ||||
| NUMBER OF LYMPH NODES | Spearman correlation test | N=0 | ||||
| NEOPLASM DISEASESTAGE | ANOVA test | N=9 |
Table S1. Basic characteristics of clinical feature: 'Time to Death'
| Time to Death | Duration (Months) | 0-223.4 (median=18.2) |
| censored | N = 714 | |
| death | N = 95 | |
| Significant markers | N = 1 | |
| associated with shorter survival | 1 | |
| associated with longer survival | 0 |
Table S2. Get Full Table List of one gene significantly associated with 'Time to Death' by Cox regression test
| HazardRatio | Wald_P | Q | C_index | |
|---|---|---|---|---|
| HSA-MIR-874 | 1.56 | 1.448e-05 | 0.0072 | 0.601 |
Figure S1. Get High-res Image As an example, this figure shows the association of HSA-MIR-874 to 'Time to Death'. four curves present the cumulative survival rates of 4 quartile subsets of patients. P value = 1.45e-05 with univariate Cox regression analysis using continuous log-2 expression values.
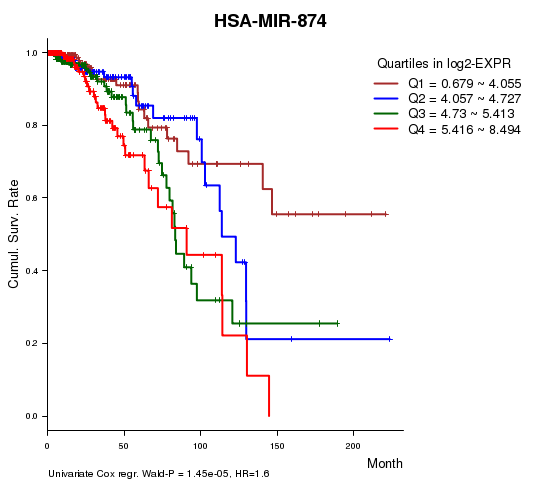
Table S3. Basic characteristics of clinical feature: 'AGE'
| AGE | Mean (SD) | 58.47 (13) |
| Significant markers | N = 26 | |
| pos. correlated | 2 | |
| neg. correlated | 24 |
Table S4. Get Full Table List of top 10 genes significantly correlated to 'AGE' by Spearman correlation test
| SpearmanCorr | corrP | Q | |
|---|---|---|---|
| HSA-MIR-424 | -0.2292 | 8.548e-12 | 4.24e-09 |
| HSA-MIR-31 | -0.2155 | 3.211e-10 | 1.59e-07 |
| HSA-MIR-598 | -0.1939 | 8.58e-09 | 4.24e-06 |
| HSA-MIR-542 | -0.1847 | 4.309e-08 | 2.12e-05 |
| HSA-MIR-99A | -0.1839 | 4.908e-08 | 2.41e-05 |
| HSA-MIR-381 | -0.1813 | 7.735e-08 | 3.8e-05 |
| HSA-MIR-652 | -0.1663 | 8.55e-07 | 0.000419 |
| HSA-LET-7C | -0.1637 | 1.269e-06 | 0.000621 |
| HSA-MIR-202 | -0.1998 | 2.237e-06 | 0.00109 |
| HSA-MIR-450B | -0.1518 | 7.253e-06 | 0.00353 |
Figure S2. Get High-res Image As an example, this figure shows the association of HSA-MIR-424 to 'AGE'. P value = 8.55e-12 with Spearman correlation analysis. The straight line presents the best linear regression.
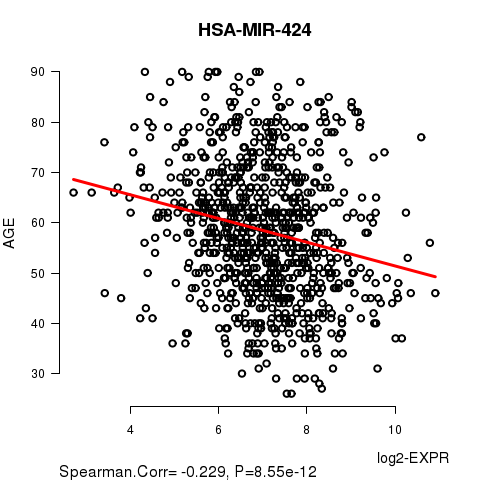
Table S5. Basic characteristics of clinical feature: 'GENDER'
| GENDER | Labels | N |
| FEMALE | 859 | |
| MALE | 9 | |
| Significant markers | N = 0 |
Table S6. Basic characteristics of clinical feature: 'HISTOLOGICAL.TYPE'
| HISTOLOGICAL.TYPE | Labels | N |
| INFILTRATING DUCTAL CARCINOMA | 677 | |
| INFILTRATING LOBULAR CARCINOMA | 111 | |
| MEDULLARY CARCINOMA | 4 | |
| MIXED HISTOLOGY (PLEASE SPECIFY) | 26 | |
| MUCINOUS CARCINOMA | 10 | |
| OTHER SPECIFY | 40 | |
| Significant markers | N = 301 |
Table S7. Get Full Table List of top 10 genes differentially expressed by 'HISTOLOGICAL.TYPE'
| ANOVA_P | Q | |
|---|---|---|
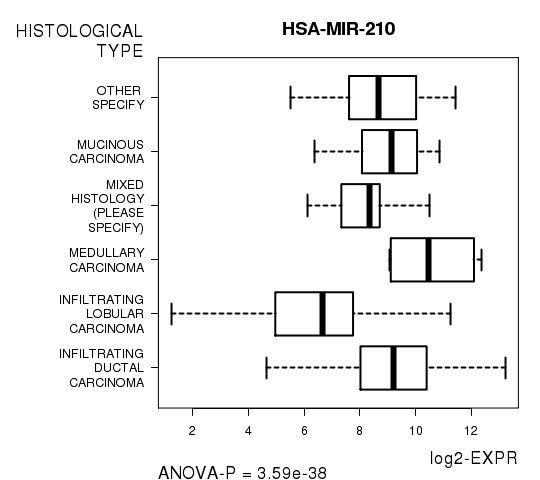
| HSA-MIR-210 | 3.587e-38 | 1.78e-35 |
| HSA-MIR-301A | 5.299e-28 | 2.62e-25 |
| HSA-MIR-616 | 1.558e-24 | 7.7e-22 |
| HSA-MIR-501 | 1.458e-23 | 7.19e-21 |
| HSA-MIR-3653 | 3.212e-23 | 1.58e-20 |
| HSA-MIR-197 | 5.929e-23 | 2.91e-20 |
| HSA-MIR-301B | 1.929e-22 | 9.45e-20 |
| HSA-MIR-1307 | 4.027e-22 | 1.97e-19 |
| HSA-MIR-324 | 6.042e-22 | 2.95e-19 |
| HSA-MIR-1306 | 9.848e-22 | 4.8e-19 |
Figure S3. Get High-res Image As an example, this figure shows the association of HSA-MIR-210 to 'HISTOLOGICAL.TYPE'. P value = 3.59e-38 with ANOVA analysis.
No gene related to 'RADIATIONS.RADIATION.REGIMENINDICATION'.
Table S8. Basic characteristics of clinical feature: 'RADIATIONS.RADIATION.REGIMENINDICATION'
| RADIATIONS.RADIATION.REGIMENINDICATION | Labels | N |
| NO | 210 | |
| YES | 658 | |
| Significant markers | N = 0 |
Table S9. Basic characteristics of clinical feature: 'DISTANT.METASTASIS'
| DISTANT.METASTASIS | Labels | N |
| CM0 (I+) | 2 | |
| M0 | 771 | |
| M1 | 14 | |
| MX | 81 | |
| Significant markers | N = 3 |
Table S10. Get Full Table List of 3 genes differentially expressed by 'DISTANT.METASTASIS'
| ANOVA_P | Q | |
|---|---|---|
| HSA-MIR-2276 | 1.961e-07 | 9.72e-05 |
| HSA-MIR-374C | 4.281e-06 | 0.00212 |
| HSA-MIR-3174 | 3.358e-05 | 0.0166 |
Figure S4. Get High-res Image As an example, this figure shows the association of HSA-MIR-2276 to 'DISTANT.METASTASIS'. P value = 1.96e-07 with ANOVA analysis.
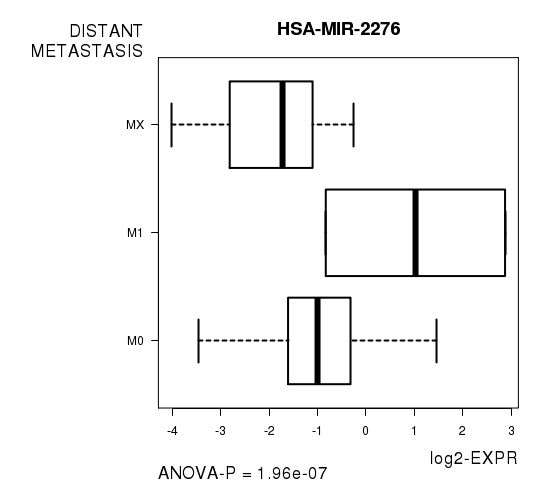
Table S11. Basic characteristics of clinical feature: 'LYMPH.NODE.METASTASIS'
| LYMPH.NODE.METASTASIS | Labels | N |
| N0 | 255 | |
| N0 (I+) | 22 | |
| N0 (I-) | 131 | |
| N0 (MOL+) | 1 | |
| N1 | 103 | |
| N1A | 129 | |
| N1B | 32 | |
| N1C | 2 | |
| N1MI | 24 | |
| N2 | 50 | |
| N2A | 53 | |
| N3 | 18 | |
| N3A | 30 | |
| N3B | 2 | |
| N3C | 1 | |
| NX | 15 | |
| Significant markers | N = 6 |
Table S12. Get Full Table List of 6 genes differentially expressed by 'LYMPH.NODE.METASTASIS'
| ANOVA_P | Q | |
|---|---|---|
| HSA-MIR-374C | 3.314e-08 | 1.64e-05 |
| HSA-MIR-874 | 4.3e-08 | 2.13e-05 |
| HSA-MIR-197 | 2.88e-05 | 0.0142 |
| HSA-MIR-92A-1 | 5.184e-05 | 0.0256 |
| HSA-MIR-574 | 6.08e-05 | 0.0299 |
| HSA-MIR-92A-2 | 6.799e-05 | 0.0334 |
Figure S5. Get High-res Image As an example, this figure shows the association of HSA-MIR-374C to 'LYMPH.NODE.METASTASIS'. P value = 3.31e-08 with ANOVA analysis.
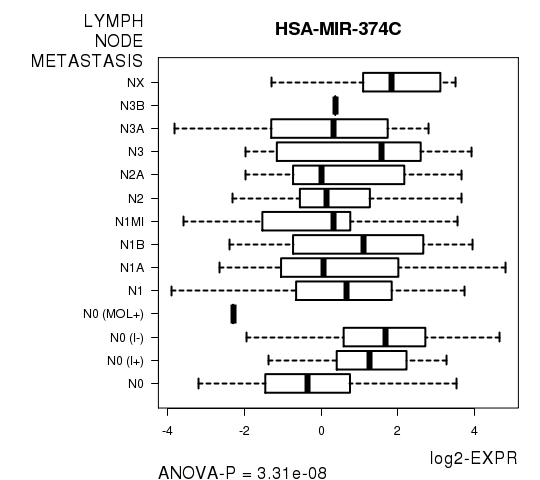
Table S13. Basic characteristics of clinical feature: 'NUMBER.OF.LYMPH.NODES'
| NUMBER.OF.LYMPH.NODES | Mean (SD) | 2.21 (4.4) |
| Significant markers | N = 0 |
Table S14. Basic characteristics of clinical feature: 'NEOPLASM.DISEASESTAGE'
| NEOPLASM.DISEASESTAGE | Labels | N |
| STAGE I | 72 | |
| STAGE IA | 67 | |
| STAGE IB | 7 | |
| STAGE II | 8 | |
| STAGE IIA | 294 | |
| STAGE IIB | 195 | |
| STAGE III | 2 | |
| STAGE IIIA | 124 | |
| STAGE IIIB | 25 | |
| STAGE IIIC | 41 | |
| STAGE IV | 14 | |
| STAGE TIS | 1 | |
| STAGE X | 17 | |
| Significant markers | N = 9 |
Table S15. Get Full Table List of 9 genes differentially expressed by 'NEOPLASM.DISEASESTAGE'
| ANOVA_P | Q | |
|---|---|---|
| HSA-MIR-143 | 5.031e-09 | 2.5e-06 |
| HSA-MIR-210 | 1.406e-08 | 6.96e-06 |
| HSA-LET-7F-2 | 1.133e-07 | 5.6e-05 |
| HSA-MIR-200A | 3.455e-06 | 0.0017 |
| HSA-MIR-374C | 1.038e-05 | 0.0051 |
| HSA-MIR-125B-2 | 4.096e-05 | 0.0201 |
| HSA-MIR-338 | 6.775e-05 | 0.0332 |
| HSA-LET-7A-2 | 8.604e-05 | 0.0421 |
| HSA-LET-7A-1 | 9.022e-05 | 0.044 |
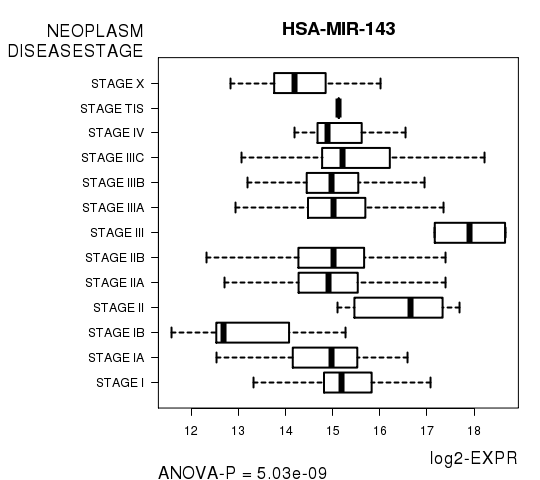
Figure S6. Get High-res Image As an example, this figure shows the association of HSA-MIR-143 to 'NEOPLASM.DISEASESTAGE'. P value = 5.03e-09 with ANOVA analysis.
-
Expresson data file = BRCA-TP.miRseq_RPKM_log2.txt
-
Clinical data file = BRCA-TP.clin.merged.picked.txt
-
Number of patients = 868
-
Number of genes = 496
-
Number of clinical features = 9
For survival clinical features, Wald's test in univariate Cox regression analysis with proportional hazards model (Andersen and Gill 1982) was used to estimate the P values using the 'coxph' function in R. Kaplan-Meier survival curves were plot using the four quartile subgroups of patients based on expression levels
For continuous numerical clinical features, Spearman's rank correlation coefficients (Spearman 1904) and two-tailed P values were estimated using 'cor.test' function in R
For two-class clinical features, two-tailed Student's t test with unequal variance (Lehmann and Romano 2005) was applied to compare the log2-expression levels between the two clinical classes using 't.test' function in R
For multi-class clinical features (ordinal or nominal), one-way analysis of variance (Howell 2002) was applied to compare the log2-expression levels between different clinical classes using 'anova' function in R
For multiple hypothesis correction, Q value is the False Discovery Rate (FDR) analogue of the P value (Benjamini and Hochberg 1995), defined as the minimum FDR at which the test may be called significant. We used the 'Benjamini and Hochberg' method of 'p.adjust' function in R to convert P values into Q values.
This is an experimental feature. The full results of the analysis summarized in this report can be downloaded from the TCGA Data Coordination Center.