This report serves to describe the mutational landscape and properties of a given individual set, as well as rank genes and genesets according to mutational significance. MutSig v2.0 and MutSigCV v0.9 merged result was used to generate the results found in this report.
-
Working with individual set: CESC-TP
-
Number of patients in set: 39
The input for this pipeline is a set of individuals with the following files associated for each:
-
An annotated .maf file describing the mutations called for the respective individual, and their properties.
-
A .wig file that contains information about the coverage of the sample.
-
MAF used for this analysis:CESC-TP.final_analysis_set.maf
-
Significantly mutated genes (q ≤ 0.1): 4
-
Mutations seen in COSMIC: 35
-
Significantly mutated genes in COSMIC territory: 1
-
Significantly mutated genesets: 0
-
Read 39 MAFs of type "Broad"
-
Total number of mutations in input MAFs: 10020
-
After removing 5 mutations outside chr1-24: 10015
-
After removing 261 blacklisted mutations: 9754
-
After removing 617 noncoding mutations: 9137
-
Number of mutations before filtering: 9137
-
After removing 127 mutations outside gene set: 9010
-
After removing 21 mutations outside category set: 8989
Table 1. Get Full Table Table representing breakdown of mutations by type.
| type | count |
|---|---|
| Frame_Shift_Del | 114 |
| Frame_Shift_Ins | 65 |
| In_Frame_Del | 52 |
| In_Frame_Ins | 15 |
| Missense_Mutation | 5620 |
| Nonsense_Mutation | 474 |
| Nonstop_Mutation | 11 |
| Silent | 2532 |
| Splice_Site | 93 |
| Translation_Start_Site | 13 |
| Total | 8989 |
Table 2. Get Full Table A breakdown of mutation rates per category discovered for this individual set.
| category | n | N | rate | rate_per_mb | relative_rate | exp_ns_s_ratio |
|---|---|---|---|---|---|---|
| Tp*C->(T/G) | 3536 | 150569812 | 0.000023 | 23 | 4.1 | 3 |
| (A/C/G)p*C->(T/G) | 1136 | 425623126 | 2.7e-06 | 2.7 | 0.47 | 2.7 |
| C->A | 350 | 576192938 | 6.1e-07 | 0.61 | 0.11 | 4.4 |
| A->mut | 611 | 556925266 | 1.1e-06 | 1.1 | 0.19 | 3.9 |
| indel+null | 805 | 1133118204 | 7.1e-07 | 0.71 | 0.12 | NaN |
| double_null | 19 | 1133118204 | 1.7e-08 | 0.017 | 0.0029 | NaN |
| Total | 6457 | 1133118204 | 5.7e-06 | 5.7 | 1 | 3.5 |
The x axis represents the samples. The y axis represents the exons, one row per exon, and they are sorted by average coverage across samples. For exons with exactly the same average coverage, they are sorted next by the %GC of the exon. (The secondary sort is especially useful for the zero-coverage exons at the bottom).
Figure 1.
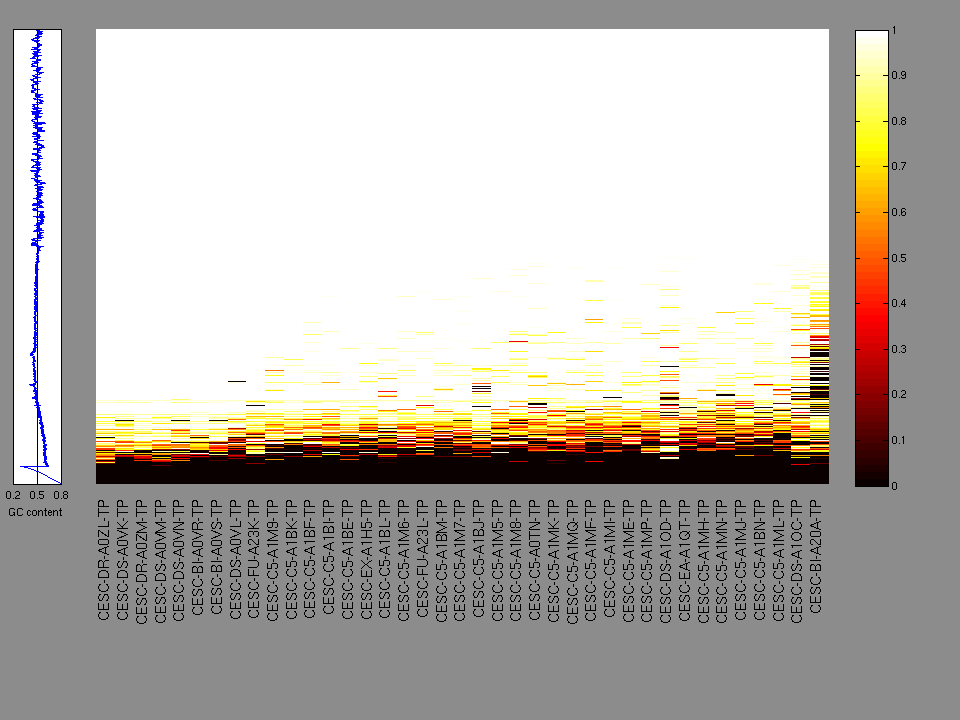
Figure 2. Patients counts and rates file used to generate this plot: CESC-TP.patients.counts_and_rates.txt
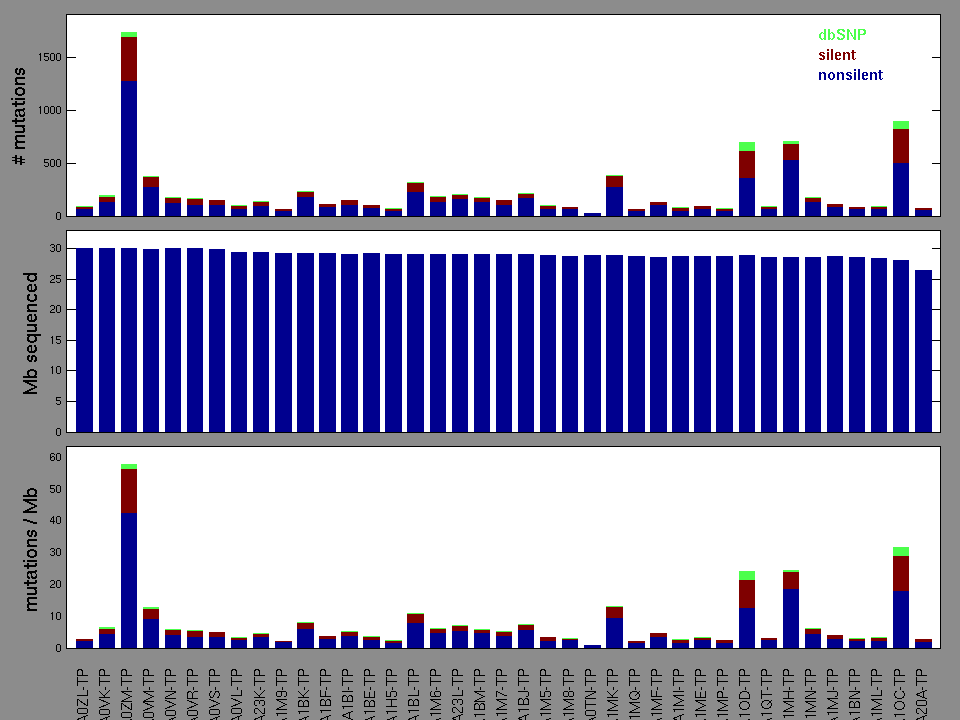
Figure 3. Needs description.
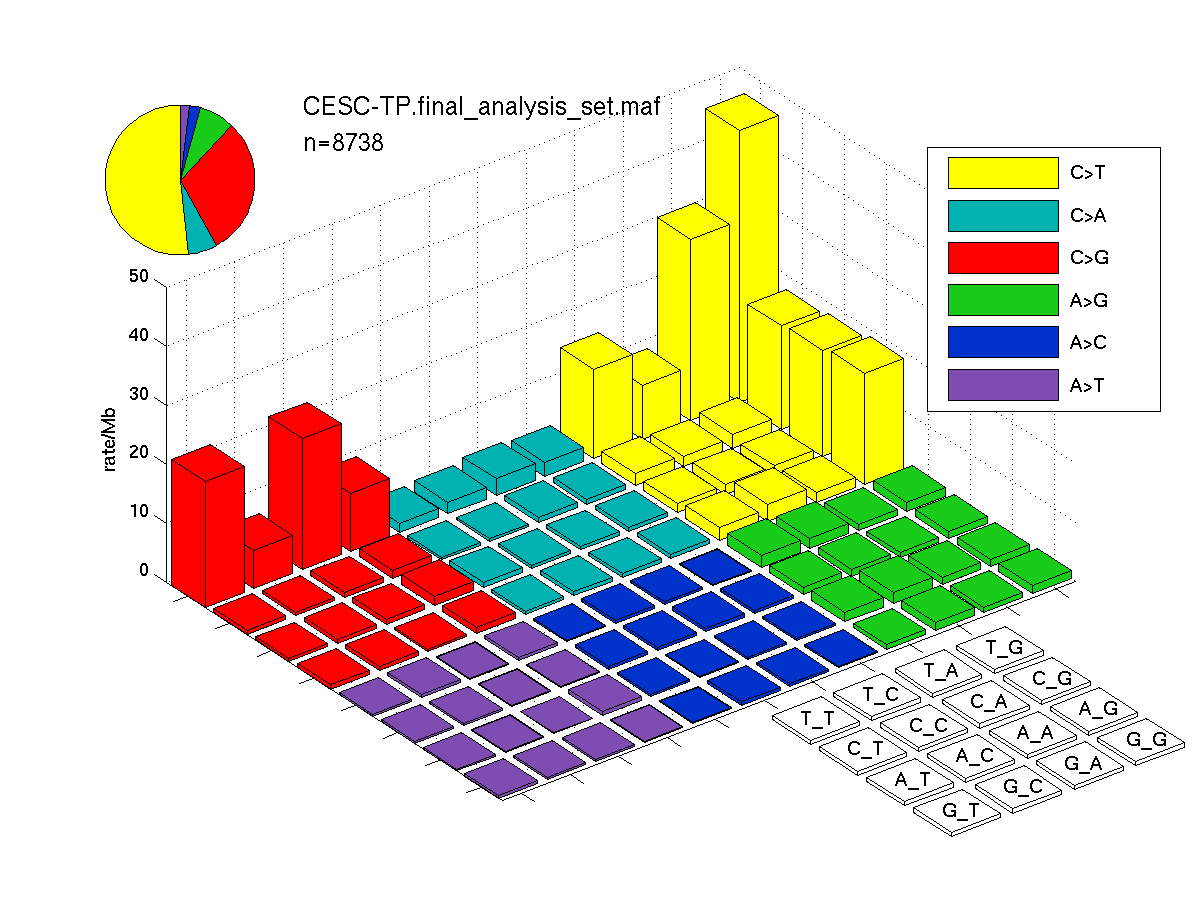
Figure 4. Needs description.
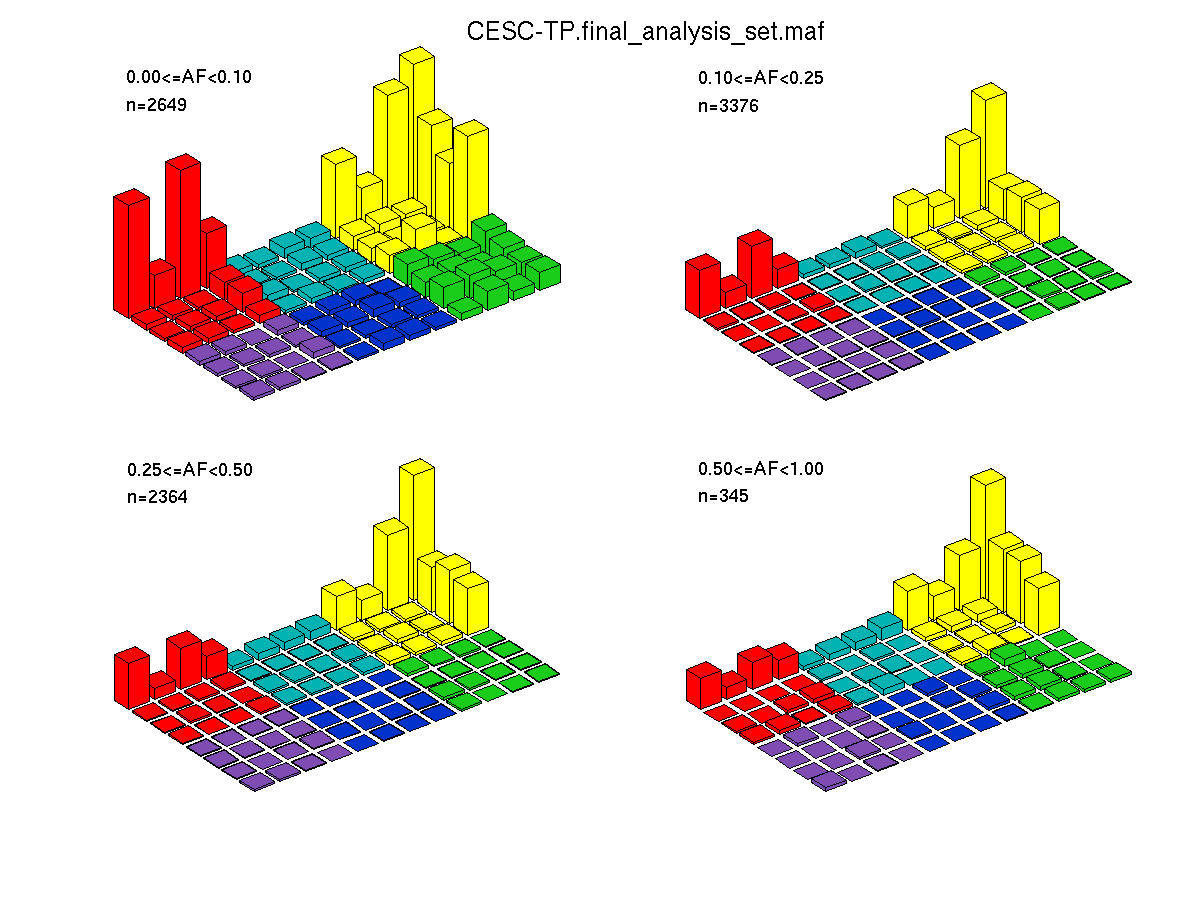
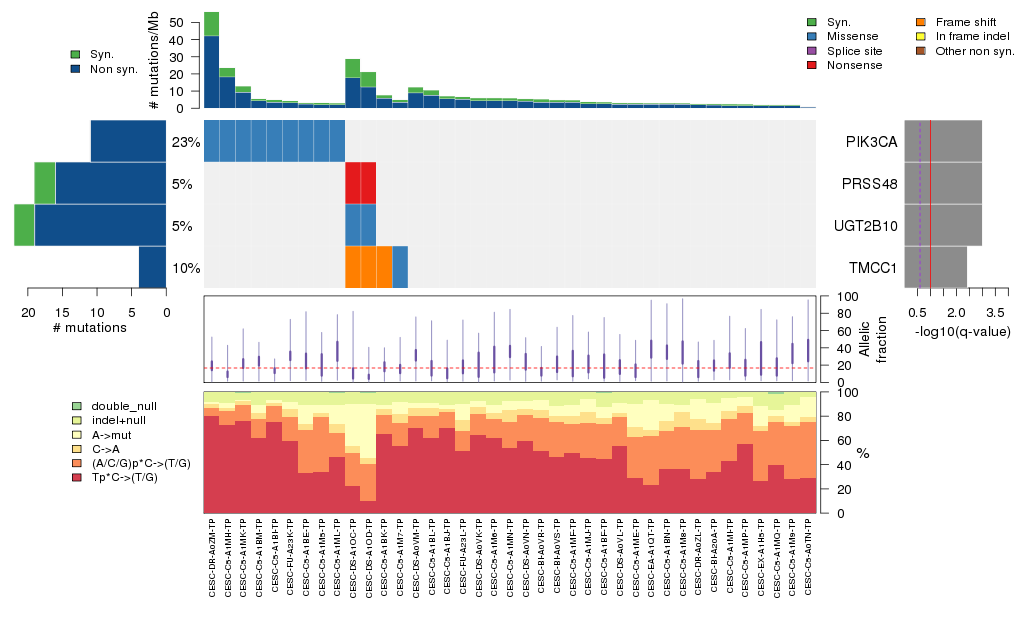
Figure 5. Get High-res Image The matrix in the center of the figure represents individual mutations in patient samples, color-coded by type of mutation, for the significantly mutated genes. The rate of synonymous and non-synonymous mutations is displayed at the top of the matrix. The barplot on the left of the matrix shows the number of mutations in each gene. The percentages represent the fraction of tumors with at least one mutation in the specified gene. The barplot to the right of the matrix displays the q-values for the most significantly mutated genes. The purple boxplots below the matrix (only displayed if required columns are present in the provided MAF) represent the distributions of allelic fractions observed in each sample. The plot at the bottom represents the base substitution distribution of individual samples, using the same categories that were used to calculate significance.
Column Descriptions:
-
N = number of sequenced bases in this gene across the individual set
-
n = number of (nonsilent) mutations in this gene across the individual set
-
npat = number of patients (individuals) with at least one nonsilent mutation
-
nsite = number of unique sites having a non-silent mutation
-
nsil = number of silent mutations in this gene across the individual set
-
n1 = number of nonsilent mutations of type: Tp*C->(T/G)
-
n2 = number of nonsilent mutations of type: (A/C/G)p*C->(T/G)
-
n3 = number of nonsilent mutations of type: C->A
-
n4 = number of nonsilent mutations of type: A->mut
-
n5 = number of nonsilent mutations of type: indel+null
-
n6 = number of nonsilent mutations of type: double_null
-
p_cons = p-value for enrichment of mutations at evolutionarily most-conserved sites in gene
-
p_joint = p-value for clustering + conservation
-
p = p-value (overall)
-
q = q-value, False Discovery Rate (Benjamini-Hochberg procedure)
Table 3. Get Full Table A Ranked List of Significantly Mutated Genes. Number of significant genes found: 4. Number of genes displayed: 35. Click on a gene name to display its stick figure depicting the distribution of mutations and mutation types across the chosen gene (this feature may not be available for all significant genes).
| rank | gene | description | N | n | npat | nsite | nsil | n1 | n2 | n3 | n4 | n5 | n6 | p_cons | p_joint | p_cv | p | q |
|---|---|---|---|---|---|---|---|---|---|---|---|---|---|---|---|---|---|---|
| 1 | PIK3CA | phosphoinositide-3-kinase, catalytic, alpha polypeptide | 126650 | 11 | 9 | 4 | 0 | 10 | 0 | 0 | 1 | 0 | 0 | 0.025 | 0 | 0.00037 | 0 | 0 |
| 2 | PRSS48 | protease, serine, 48 | 38982 | 16 | 2 | 9 | 3 | 0 | 3 | 2 | 9 | 2 | 0 | 0.98 | 0 | 0.28 | 0 | 0 |
| 3 | UGT2B10 | UDP glucuronosyltransferase 2 family, polypeptide B10 | 122318 | 19 | 2 | 13 | 3 | 2 | 3 | 1 | 13 | 0 | 0 | 1 | 0 | 0.99 | 0 | 0 |
| 4 | TMCC1 | transmembrane and coiled-coil domain family 1 | 77000 | 4 | 4 | 3 | 0 | 0 | 0 | 1 | 0 | 3 | 0 | 0.096 | 0.00014 | 0.00023 | 6e-07 | 0.0027 |
| 5 | CDC27 | cell division cycle 27 homolog (S. cerevisiae) | 97176 | 7 | 5 | 4 | 0 | 0 | 0 | 1 | 3 | 3 | 0 | 0.05 | 0.0092 | 0.00025 | 0.000033 | 0.12 |
| 6 | UGT3A2 | UDP glycosyltransferase 3 family, polypeptide A2 | 62290 | 3 | 3 | 2 | 0 | 1 | 0 | 0 | 0 | 2 | 0 | 0.0024 | 0.0013 | 0.0023 | 4e-05 | 0.12 |
| 7 | MAPK1 | mitogen-activated protein kinase 1 | 38660 | 3 | 3 | 1 | 0 | 3 | 0 | 0 | 0 | 0 | 0 | 0.2 | 0.00065 | 0.0046 | 0.000041 | 0.12 |
| 8 | SEH1L | SEH1-like (S. cerevisiae) | 50533 | 2 | 2 | 1 | 0 | 0 | 0 | 0 | 0 | 2 | 0 | 0.016 | 0.0056 | 0.0061 | 0.00038 | 0.85 |
| 9 | PLAC4 | placenta-specific 4 | 7160 | 2 | 2 | 2 | 0 | 0 | 0 | 0 | 0 | 1 | 1 | 0.07 | 0.2 | 0.00019 | 0.00043 | 0.87 |
| 10 | PRB2 | proline-rich protein BstNI subfamily 2 | 49240 | 6 | 4 | 5 | 0 | 0 | 0 | 0 | 1 | 5 | 0 | 0.34 | 0.76 | 0.000055 | 0.00046 | 0.87 |
| 11 | PTEN | phosphatase and tensin homolog (mutated in multiple advanced cancers 1) | 45935 | 3 | 3 | 3 | 0 | 0 | 0 | 0 | 0 | 3 | 0 | 0.82 | 0.39 | 0.00015 | 0.00064 | 1 |
| 12 | NFE2L2 | nuclear factor (erythroid-derived 2)-like 2 | 69545 | 7 | 6 | 6 | 0 | 4 | 0 | 0 | 1 | 2 | 0 | 0.049 | 0.18 | 0.0004 | 0.00076 | 1 |
| 13 | OR10G8 | olfactory receptor, family 10, subfamily G, member 8 | 36617 | 18 | 2 | 12 | 15 | 0 | 10 | 0 | 7 | 1 | 0 | 1 | 0.000085 | 0.96 | 0.00085 | 1 |
| 14 | ITGAX | integrin, alpha X (complement component 3 receptor 4 subunit) | 131027 | 8 | 4 | 6 | 6 | 2 | 2 | 0 | 3 | 1 | 0 | 0.59 | 0.00014 | 0.75 | 0.0011 | 1 |
| 15 | PRG4 | proteoglycan 4 | 166081 | 14 | 5 | 11 | 0 | 2 | 1 | 1 | 0 | 10 | 0 | 0.44 | 0.00018 | 0.86 | 0.0015 | 1 |
| 16 | RAET1L | retinoic acid early transcript 1L | 25451 | 5 | 2 | 4 | 0 | 1 | 1 | 0 | 3 | 0 | 0 | 0.53 | 0.0019 | 0.085 | 0.0016 | 1 |
| 17 | NFYB | nuclear transcription factor Y, beta | 25367 | 2 | 2 | 1 | 0 | 0 | 0 | 0 | 0 | 2 | 0 | 0.018 | 0.12 | 0.0016 | 0.0018 | 1 |
| 18 | TREML4 | triggering receptor expressed on myeloid cells-like 4 | 23897 | 5 | 2 | 4 | 3 | 0 | 3 | 0 | 1 | 1 | 0 | 0.88 | 0.021 | 0.012 | 0.0023 | 1 |
| 19 | USP26 | ubiquitin specific peptidase 26 | 107055 | 2 | 2 | 2 | 0 | 1 | 0 | 0 | 0 | 1 | 0 | 0.0056 | 0.0026 | 0.12 | 0.0029 | 1 |
| 20 | CPNE3 | copine III | 64568 | 3 | 2 | 3 | 0 | 2 | 0 | 0 | 0 | 1 | 0 | 0.98 | 0.0019 | 0.45 | 0.0068 | 1 |
| 21 | SPANXN5 | SPANX family, member N5 | 8853 | 1 | 1 | 1 | 0 | 0 | 0 | 0 | 0 | 1 | 0 | NaN | NaN | 0.0069 | 0.0069 | 1 |
| 22 | C20orf134 | chromosome 20 open reading frame 134 | 15064 | 2 | 2 | 2 | 0 | 1 | 0 | 0 | 0 | 1 | 0 | 0.94 | 0.11 | 0.0078 | 0.0071 | 1 |
| 23 | IFITM1 | interferon induced transmembrane protein 1 (9-27) | 15054 | 2 | 2 | 1 | 2 | 0 | 0 | 0 | 2 | 0 | 0 | 1 | 0.016 | 0.058 | 0.0072 | 1 |
| 24 | PTH2 | parathyroid hormone 2 | 8040 | 2 | 2 | 2 | 0 | 1 | 0 | 1 | 0 | 0 | 0 | 0.05 | 0.028 | 0.033 | 0.0073 | 1 |
| 25 | ZNF645 | zinc finger protein 645 | 49998 | 2 | 2 | 1 | 0 | 0 | 2 | 0 | 0 | 0 | 0 | 0.07 | 0.015 | 0.066 | 0.0077 | 1 |
| 26 | LCE1C | late cornified envelope 1C | 14077 | 4 | 2 | 2 | 9 | 0 | 4 | 0 | 0 | 0 | 0 | 0.98 | 0.0068 | 0.17 | 0.0088 | 1 |
| 27 | FETUB | fetuin B | 45815 | 2 | 2 | 2 | 0 | 1 | 0 | 0 | 1 | 0 | 0 | 0.029 | 0.0085 | 0.13 | 0.0089 | 1 |
| 28 | XAGE5 | X antigen family, member 5 | 13377 | 3 | 2 | 3 | 0 | 0 | 0 | 0 | 2 | 1 | 0 | 0.33 | 0.17 | 0.0071 | 0.0093 | 1 |
| 29 | TMEM47 | transmembrane protein 47 | 11233 | 1 | 1 | 1 | 0 | 0 | 0 | 0 | 0 | 1 | 0 | NaN | NaN | 0.0093 | 0.0093 | 1 |
| 30 | IL13RA1 | interleukin 13 receptor, alpha 1 | 48201 | 2 | 2 | 1 | 0 | 0 | 0 | 0 | 0 | 2 | 0 | 0.64 | 0.24 | 0.0053 | 0.0097 | 1 |
| 31 | TCEAL2 | transcription elongation factor A (SII)-like 2 | 26340 | 3 | 1 | 3 | 1 | 1 | 0 | 0 | 2 | 0 | 0 | 0.96 | 0.004 | 0.33 | 0.01 | 1 |
| 32 | C8orf44 | chromosome 8 open reading frame 44 | 17244 | 5 | 2 | 5 | 2 | 0 | 1 | 0 | 4 | 0 | 0 | 0.92 | 0.033 | 0.049 | 0.012 | 1 |
| 33 | IFNGR2 | interferon gamma receptor 2 (interferon gamma transducer 1) | 37635 | 2 | 2 | 2 | 0 | 0 | 0 | 0 | 0 | 2 | 0 | 0.62 | 0.42 | 0.004 | 0.012 | 1 |
| 34 | C11orf52 | chromosome 11 open reading frame 52 | 14969 | 2 | 2 | 2 | 0 | 1 | 0 | 0 | 0 | 1 | 0 | 0.58 | 0.98 | 0.0019 | 0.014 | 1 |
| 35 | MTL5 | metallothionein-like 5, testis-specific (tesmin) | 48655 | 2 | 2 | 2 | 0 | 0 | 0 | 0 | 0 | 2 | 0 | 0.18 | 0.25 | 0.0079 | 0.014 | 1 |
Figure S1. This figure depicts the distribution of mutations and mutation types across the PIK3CA significant gene.
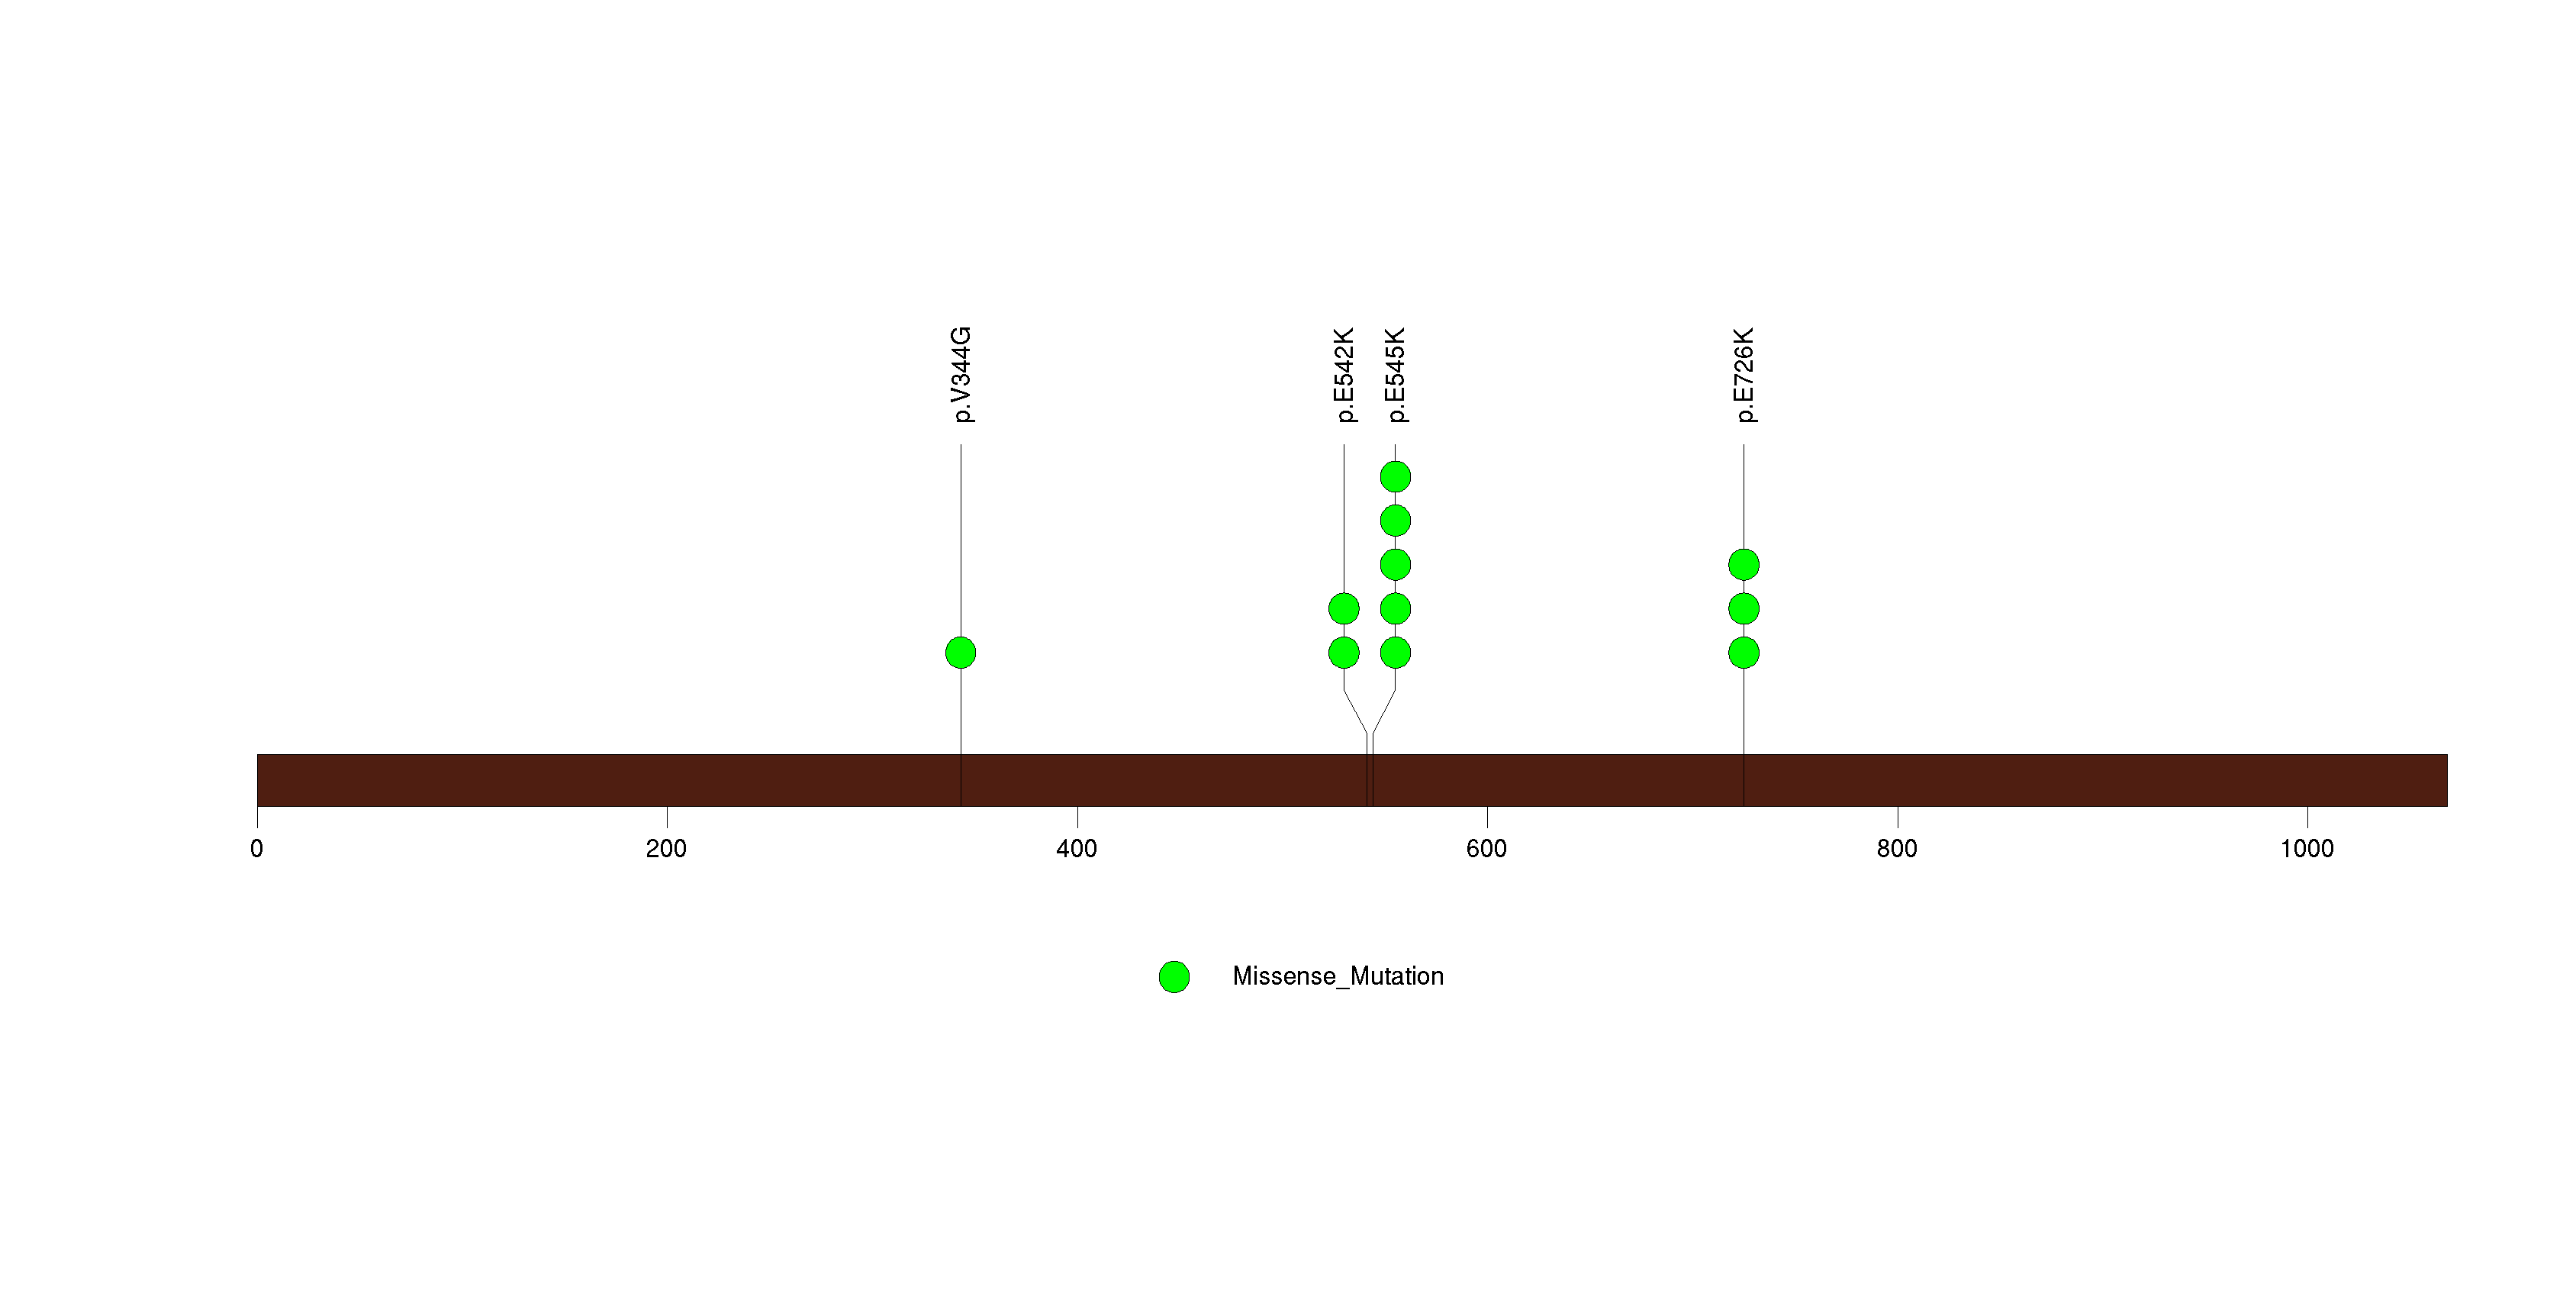
Figure S2. This figure depicts the distribution of mutations and mutation types across the PRSS48 significant gene.
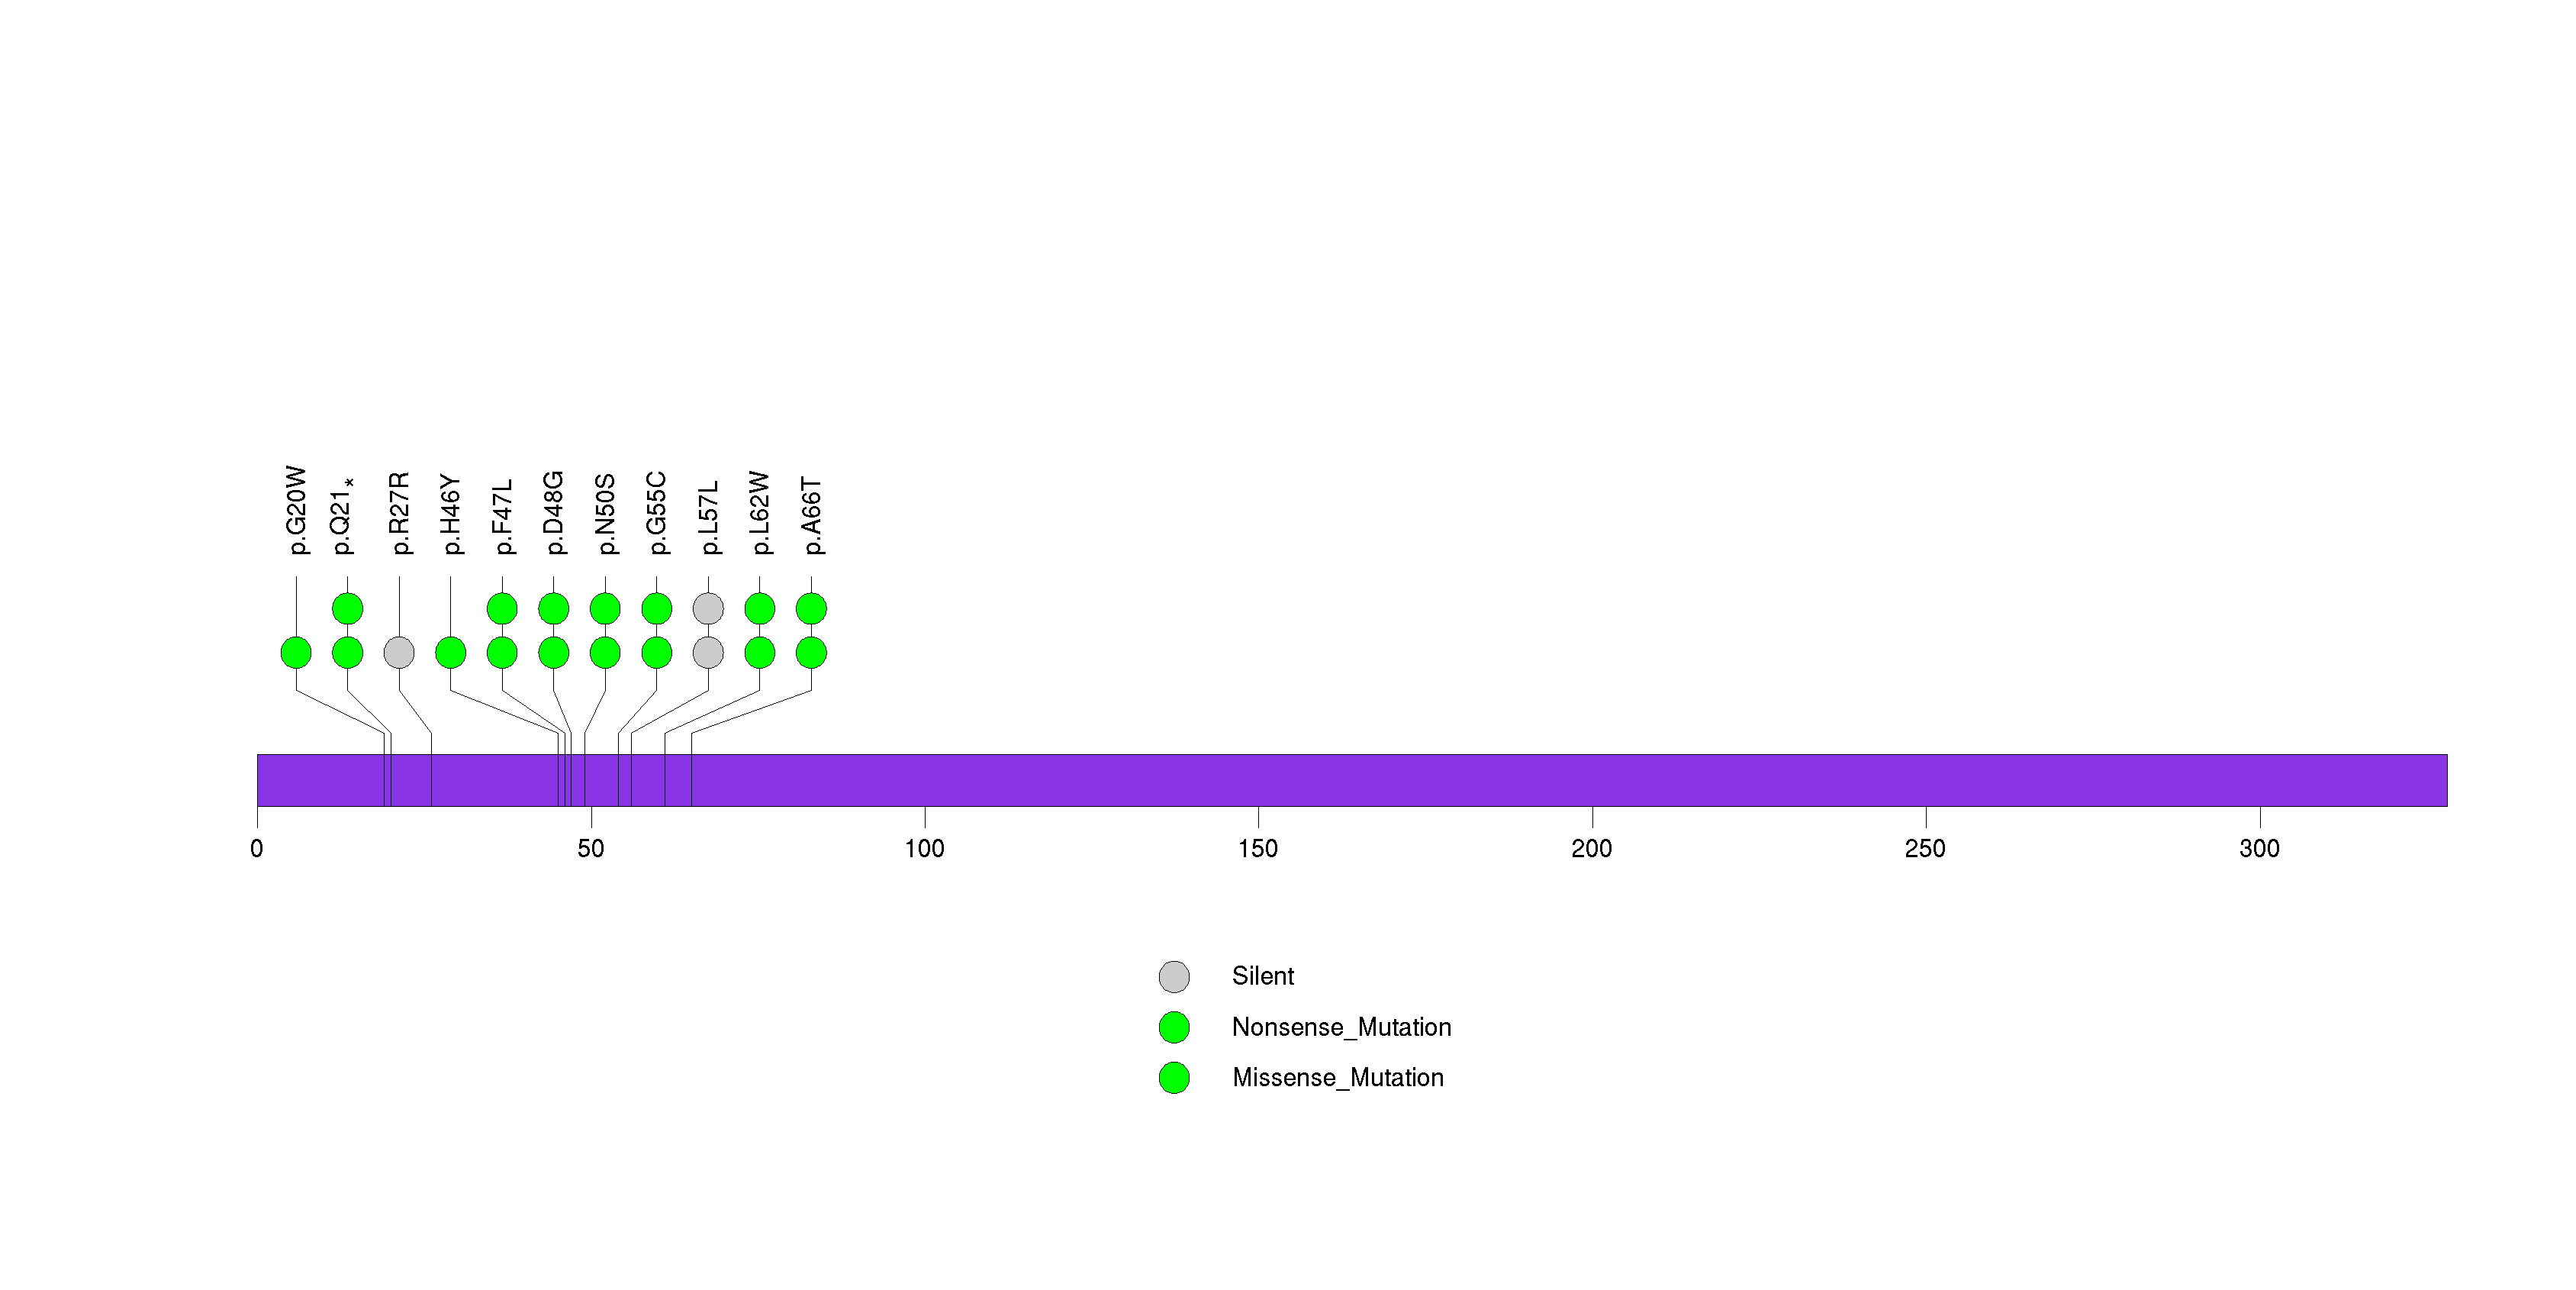
Figure S3. This figure depicts the distribution of mutations and mutation types across the UGT2B10 significant gene.
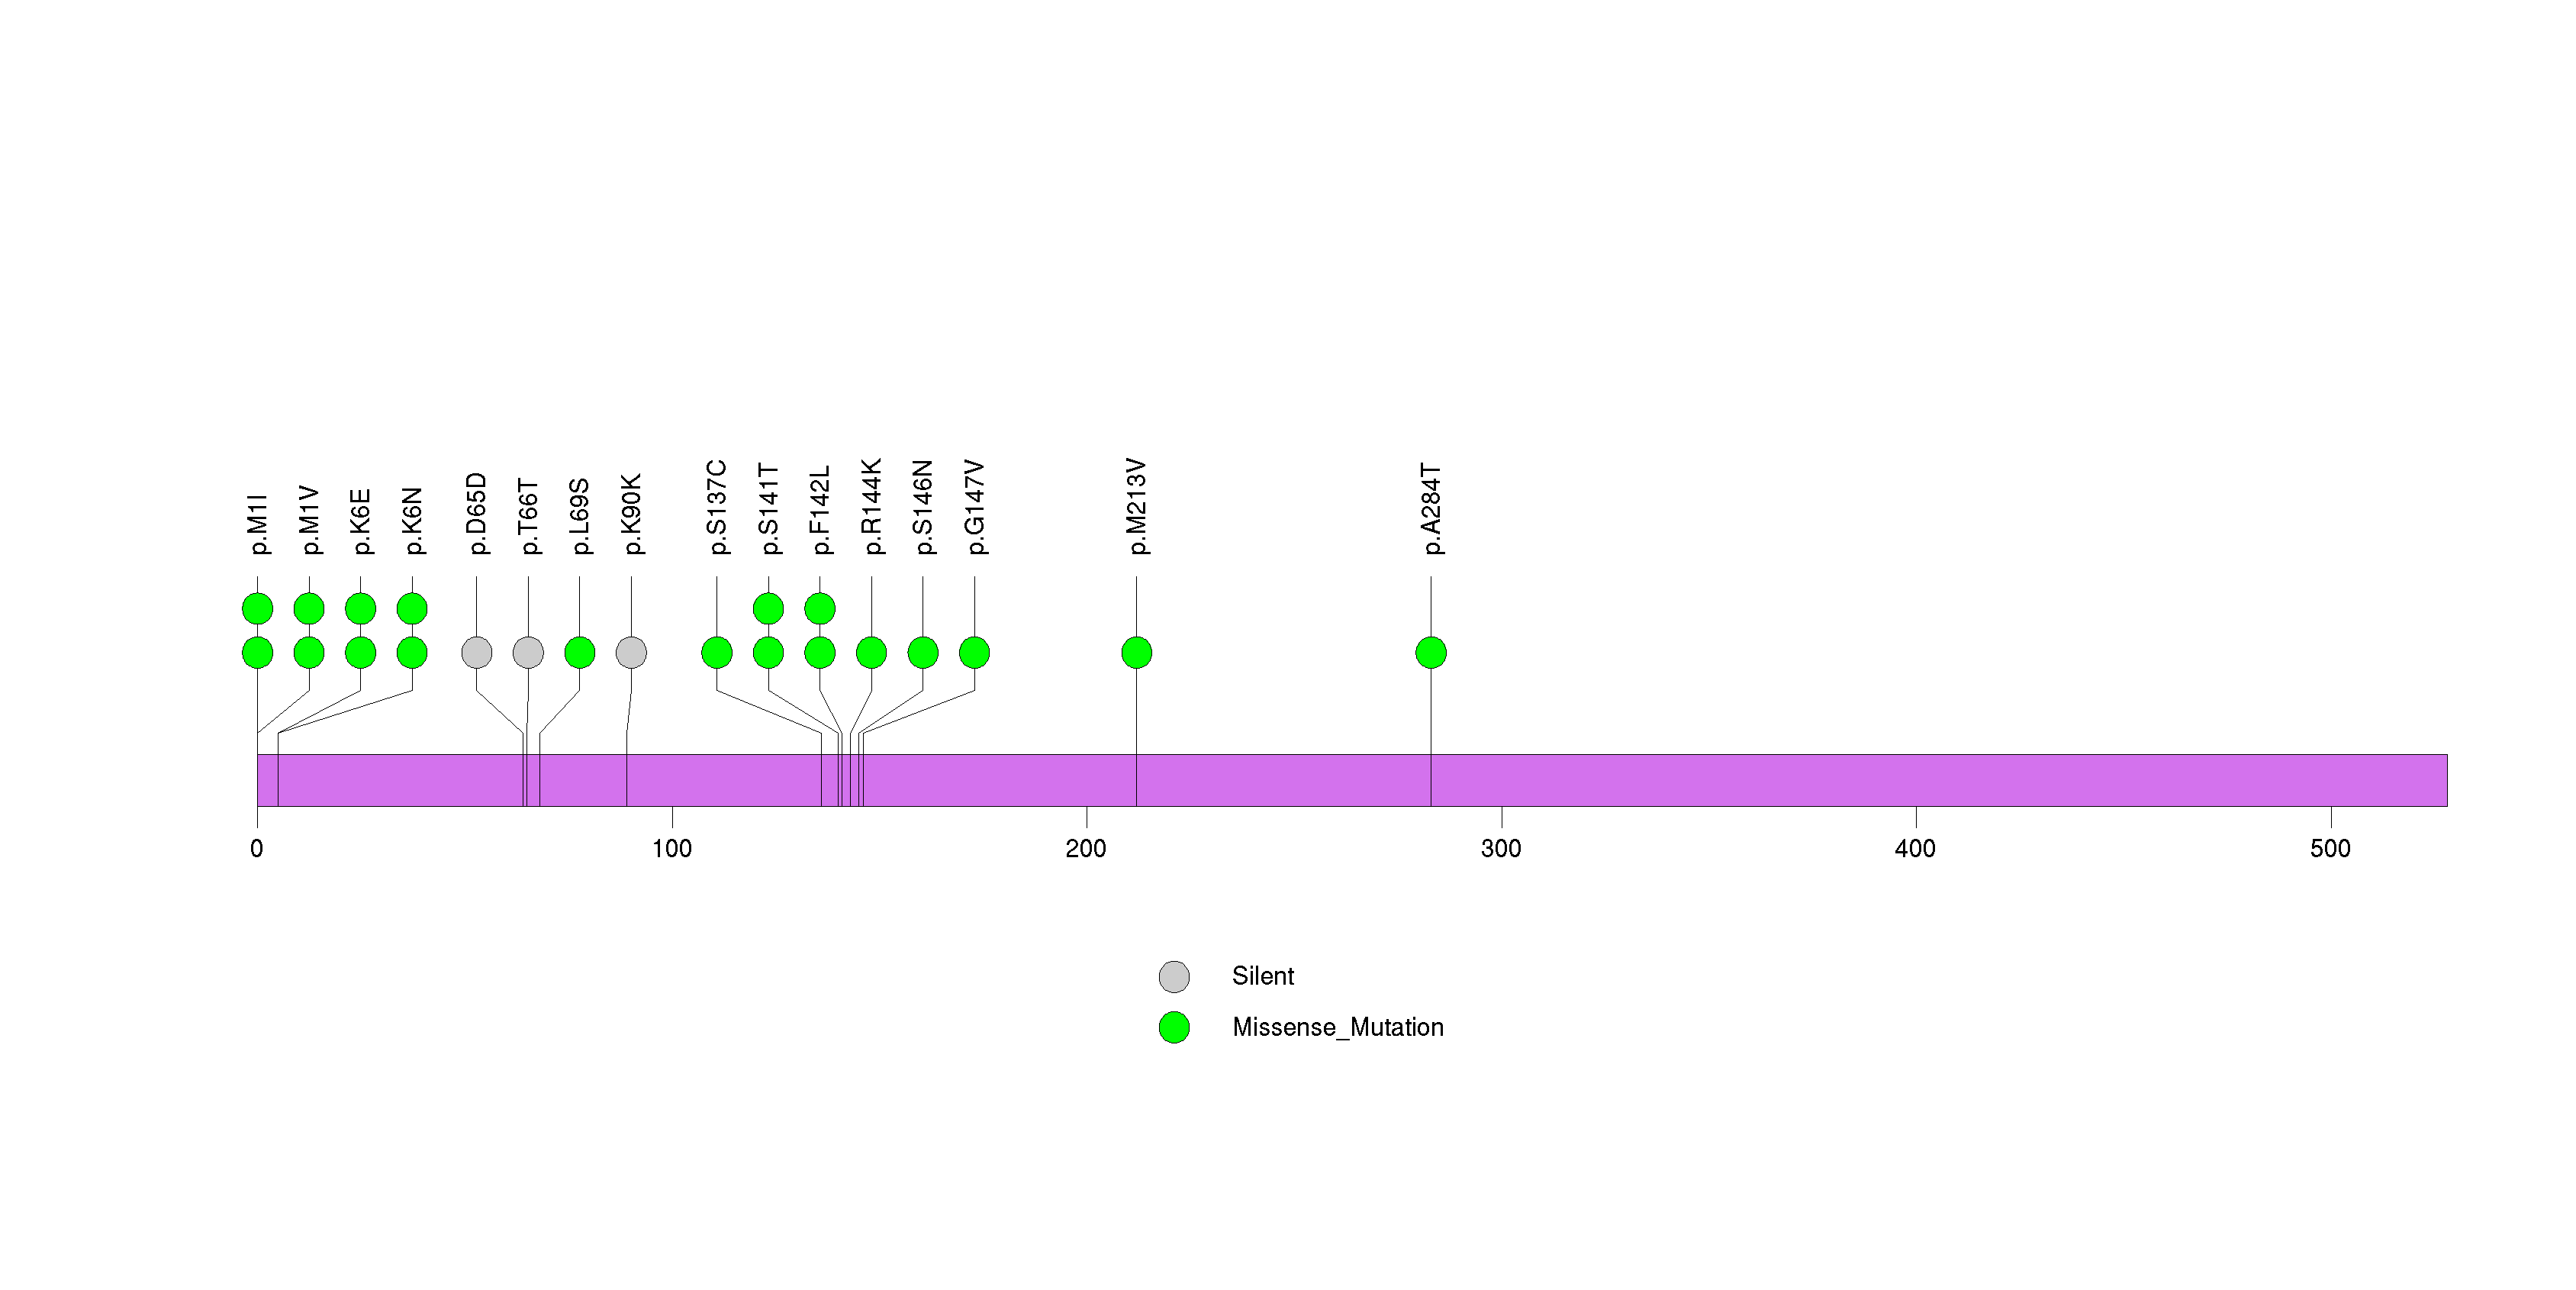
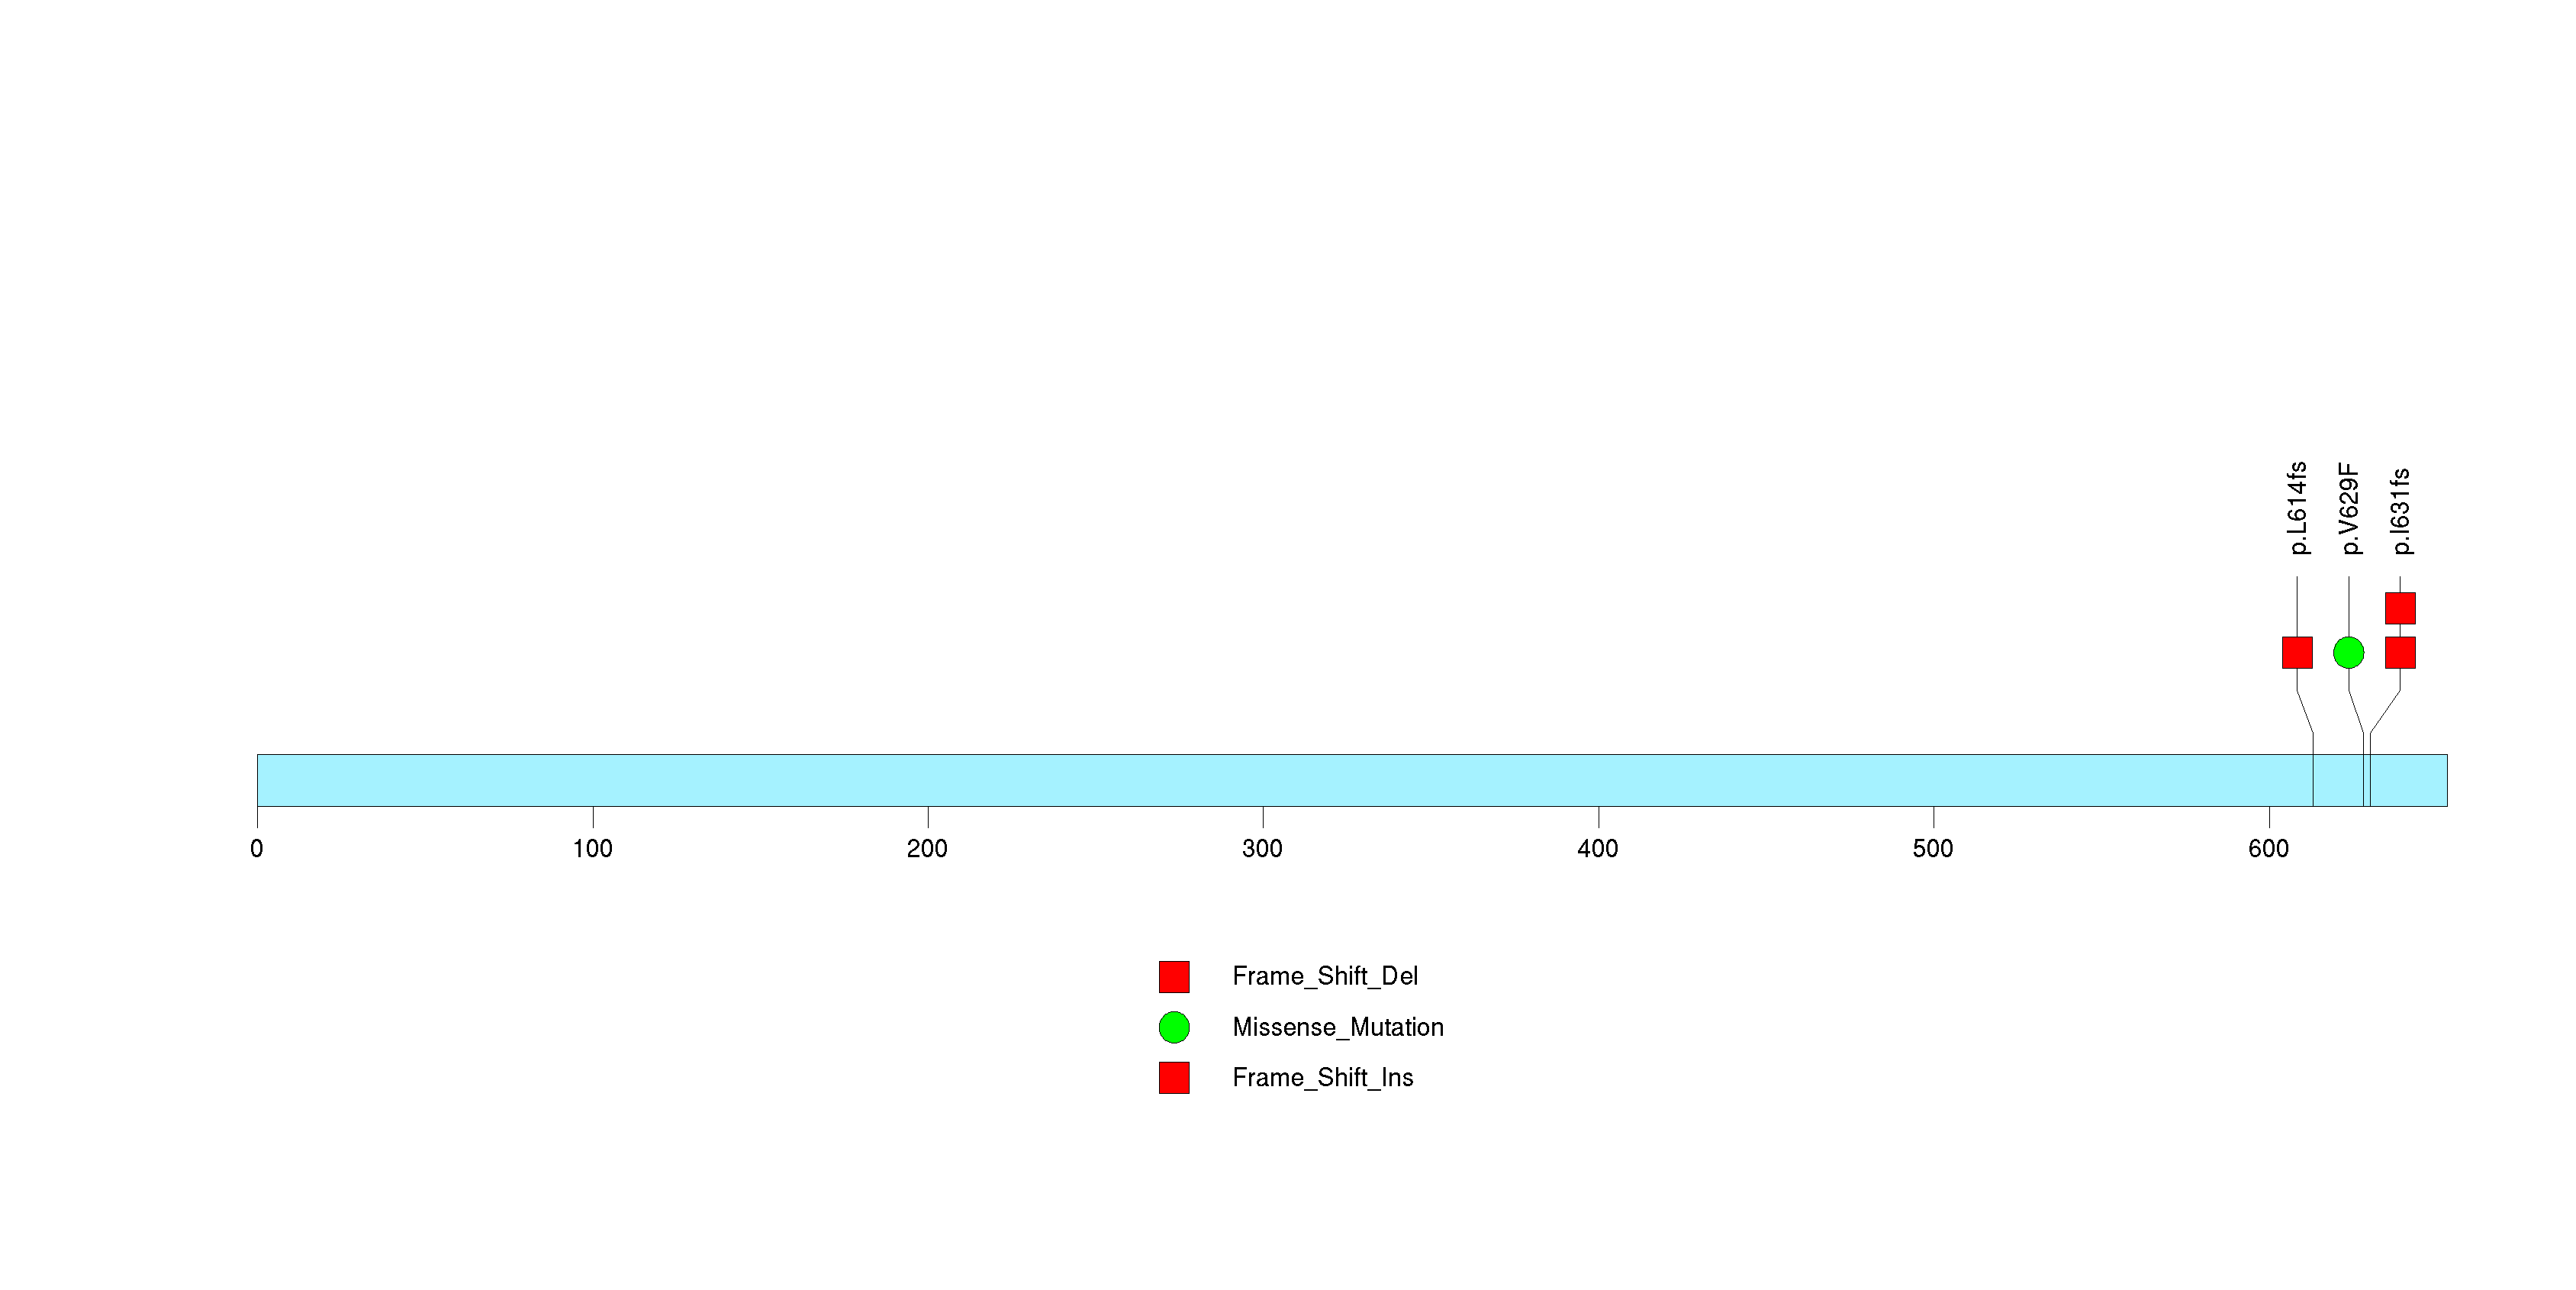
Figure S4. This figure depicts the distribution of mutations and mutation types across the TMCC1 significant gene.
In this analysis, COSMIC is used as a filter to increase power by restricting the territory of each gene. Cosmic version: v48.
Table 4. Get Full Table Significantly mutated genes (COSMIC territory only). To access the database please go to: COSMIC. Number of significant genes found: 1. Number of genes displayed: 10
| rank | gene | description | n | cos | n_cos | N_cos | cos_ev | p | q |
|---|---|---|---|---|---|---|---|---|---|
| 1 | PIK3CA | phosphoinositide-3-kinase, catalytic, alpha polypeptide | 11 | 220 | 8 | 8580 | 3939 | 2.2e-13 | 9.8e-10 |
| 2 | ATL2 | atlastin GTPase 2 | 1 | 1 | 1 | 39 | 1 | 0.00022 | 0.17 |
| 3 | EDA | ectodysplasin A | 1 | 1 | 1 | 39 | 1 | 0.00022 | 0.17 |
| 4 | KIAA1024 | KIAA1024 | 2 | 1 | 1 | 39 | 1 | 0.00022 | 0.17 |
| 5 | MAPK11 | mitogen-activated protein kinase 11 | 1 | 1 | 1 | 39 | 1 | 0.00022 | 0.17 |
| 6 | SUV39H2 | suppressor of variegation 3-9 homolog 2 (Drosophila) | 1 | 1 | 1 | 39 | 2 | 0.00022 | 0.17 |
| 7 | ALS2 | amyotrophic lateral sclerosis 2 (juvenile) | 2 | 3 | 1 | 117 | 1 | 0.00067 | 0.23 |
| 8 | EPHA10 | EPH receptor A10 | 1 | 3 | 1 | 117 | 1 | 0.00067 | 0.23 |
| 9 | IFITM3 | interferon induced transmembrane protein 3 (1-8U) | 5 | 3 | 1 | 117 | 1 | 0.00067 | 0.23 |
| 10 | ITIH5L | inter-alpha (globulin) inhibitor H5-like | 1 | 3 | 1 | 117 | 1 | 0.00067 | 0.23 |
Note:
n - number of (nonsilent) mutations in this gene across the individual set.
cos = number of unique mutated sites in this gene in COSMIC
n_cos = overlap between n and cos.
N_cos = number of individuals times cos.
cos_ev = total evidence: number of reports in COSMIC for mutations seen in this gene.
p = p-value for seeing the observed amount of overlap in this gene)
q = q-value, False Discovery Rate (Benjamini-Hochberg procedure)
Table 5. Get Full Table A Ranked List of Significantly Mutated Genesets. (Source: MSigDB GSEA Cannonical Pathway Set).Number of significant genesets found: 0. Number of genesets displayed: 10
| rank | geneset | description | genes | N_genes | mut_tally | N | n | npat | nsite | nsil | n1 | n2 | n3 | n4 | n5 | n6 | p_ns_s | p | q |
|---|---|---|---|---|---|---|---|---|---|---|---|---|---|---|---|---|---|---|---|
| 1 | PAR1PATHWAY | Activated extracellular thrombin cleaves and activates the G-protein coupled receptors PAR1 and PAR4, which activate platelets. | ADCY1, ARHA, ARHGEF1, F2, F2R, F2RL3, GNA12, GNA13, GNAI1, GNAQ, GNB1, GNGT1, MAP3K7, PIK3CA, PIK3R1, PLCB1, PPP1R12B, PRKCA, PRKCB1, PTK2B, ROCK1 | 19 | ADCY1(1), ARHGEF1(1), F2R(1), F2RL3(2), GNA13(1), PIK3CA(11), PIK3R1(1), PPP1R12B(1), PRKCA(1), ROCK1(3) | 1478575 | 23 | 13 | 16 | 1 | 16 | 3 | 1 | 2 | 0 | 1 | 0.011 | 0.00048 | 0.14 |
| 2 | ACHPATHWAY | Nicotinic acetylcholine receptors are ligand-gated ion channels that primarily mediate neuromuscular signaling and may inhibit neuronal apoptosis via the AKT pathway. | AKT1, BAD, CHRNB1, CHRNG, FOXO3A, MUSK, PIK3CA, PIK3R1, PTK2, PTK2B, RAPSN, SRC, TERT, TNFSF6, YWHAH | 13 | CHRNG(1), MUSK(1), PIK3CA(11), PIK3R1(1), PTK2(1) | 935251 | 15 | 11 | 8 | 1 | 11 | 0 | 1 | 2 | 1 | 0 | 0.053 | 0.0005 | 0.14 |
| 3 | ERK5PATHWAY | Signaling between a tissue and its innervating axon stimulates retrograde transport via Trk receptors, which activate Erk5, which induces transcription of anti-apoptotic factors. | AKT1, CREB1, GRB2, HRAS, MAPK1, MAPK3, MAPK7, MEF2A, MEF2B, MEF2C, MEF2D, NTRK1, PIK3CA, PIK3R1, PLCG1, RPS6KA1, SHC1 | 17 | MAPK1(3), MAPK7(1), MEF2C(1), PIK3CA(11), PIK3R1(1), RPS6KA1(2) | 1088110 | 19 | 11 | 10 | 1 | 14 | 1 | 0 | 3 | 1 | 0 | 0.03 | 0.00078 | 0.14 |
| 4 | GCRPATHWAY | Corticosteroids activate the glucocorticoid receptor (GR), which inhibits NF-kB and activates Annexin-1, thus inhibiting the inflammatory response. | ADRB2, AKT1, ANXA1, CALM1, CALM2, CALM3, CRN, GNAS, GNB1, GNGT1, HSPCA, NFKB1, NOS3, NPPA, NR3C1, PIK3CA, PIK3R1, RELA, SYT1 | 17 | CALM1(1), CALM3(1), NPPA(1), PIK3CA(11), PIK3R1(1), SYT1(1) | 1019231 | 16 | 11 | 9 | 0 | 12 | 1 | 1 | 2 | 0 | 0 | 0.018 | 0.0009 | 0.14 |
| 5 | CTLA4PATHWAY | T cell activation requires interaction with an antigen-MHC-I complex on an antigen-presenting cell (APC), as well as CD28 interaction with the APC's CD80 or 86. | CD28, CD3D, CD3E, CD3G, CD3Z, CD80, CD86, CTLA4, GRB2, HLA-DRA, HLA-DRB1, ICOS, ICOSL, IL2, ITK, LCK, PIK3CA, PIK3R1, PTPN11, TRA@, TRB@ | 17 | CD86(1), ITK(1), PIK3CA(11), PIK3R1(1), PTPN11(1) | 739491 | 15 | 9 | 8 | 0 | 12 | 1 | 0 | 2 | 0 | 0 | 0.018 | 0.0016 | 0.17 |
| 6 | PTENPATHWAY | PTEN suppresses AKT-induced cell proliferation and antagonizes the action of PI3K. | AKT1, BCAR1, CDKN1B, FOXO3A, GRB2, ILK, ITGB1, MAPK1, MAPK3, PDK2, PDPK1, PIK3CA, PIK3R1, PTEN, PTK2, SHC1, SOS1, TNFSF6 | 16 | MAPK1(3), PIK3CA(11), PIK3R1(1), PTEN(3), PTK2(1), SOS1(1) | 1108069 | 20 | 11 | 11 | 0 | 15 | 0 | 0 | 2 | 3 | 0 | 0.0079 | 0.0017 | 0.17 |
| 7 | ST_TYPE_I_INTERFERON_PATHWAY | Type I interferon is an antiviral cytokine that induces a JAK-STAT type pathway leading to ISGF3 activation and a cellular antiviral response. | IFNAR1, IFNB1, ISGF3G, JAK1, PTPRU, REG1A, STAT1, STAT2, TYK2 | 8 | IFNAR1(2), PTPRU(1), REG1A(1), STAT1(3), TYK2(3) | 723179 | 10 | 10 | 10 | 1 | 7 | 3 | 0 | 0 | 0 | 0 | 0.12 | 0.0019 | 0.17 |
| 8 | IFNGPATHWAY | IFN gamma signaling pathway | IFNG, IFNGR1, IFNGR2, JAK1, JAK2, STAT1 | 6 | IFNGR1(2), IFNGR2(2), JAK2(1), STAT1(3) | 473117 | 8 | 7 | 8 | 1 | 4 | 1 | 0 | 0 | 3 | 0 | 0.48 | 0.0022 | 0.17 |
| 9 | ARFPATHWAY | Cyclin-dependent kinase inhibitor 2A is a tumor suppressor that induces G1 arrest and can activate the p53 pathway, leading to G2/M arrest. | ABL1, CDKN2A, E2F1, MDM2, MYC, PIK3CA, PIK3R1, POLR1A, POLR1B, POLR1C, POLR1D, RAC1, RB1, TBX2, TP53, TWIST1 | 16 | ABL1(1), PIK3CA(11), PIK3R1(1), POLR1A(2), POLR1C(2), TP53(2) | 1168503 | 19 | 14 | 12 | 2 | 13 | 0 | 0 | 4 | 2 | 0 | 0.13 | 0.0032 | 0.2 |
| 10 | PLCPATHWAY | Phospholipase C hydrolyzes the membrane lipid PIP2 to DAG, which activates protein kinase C, and IP3, which causes calcium influx. | AKT1, PIK3CA, PIK3R1, PLCB1, PLCG1, PRKCA, PRKCB1, VAV1 | 7 | PIK3CA(11), PIK3R1(1), PRKCA(1) | 739813 | 13 | 9 | 6 | 1 | 11 | 0 | 0 | 2 | 0 | 0 | 0.13 | 0.0032 | 0.2 |
In brief, we tabulate the number of mutations and the number of covered bases for each gene. The counts are broken down by mutation context category: four context categories that are discovered by MutSig, and one for indel and 'null' mutations, which include indels, nonsense mutations, splice-site mutations, and non-stop (read-through) mutations. For each gene, we calculate the probability of seeing the observed constellation of mutations, i.e. the product P1 x P2 x ... x Pm, or a more extreme one, given the background mutation rates calculated across the dataset. [1]
This is an experimental feature. The full results of the analysis summarized in this report can be downloaded from the TCGA Data Coordination Center.