This pipeline computes the correlation between significant arm-level copy number variations (cnvs) and selected clinical features.
Testing the association between copy number variation 76 arm-level results and 11 clinical features across 413 patients, 20 significant findings detected with Q value < 0.25.
-
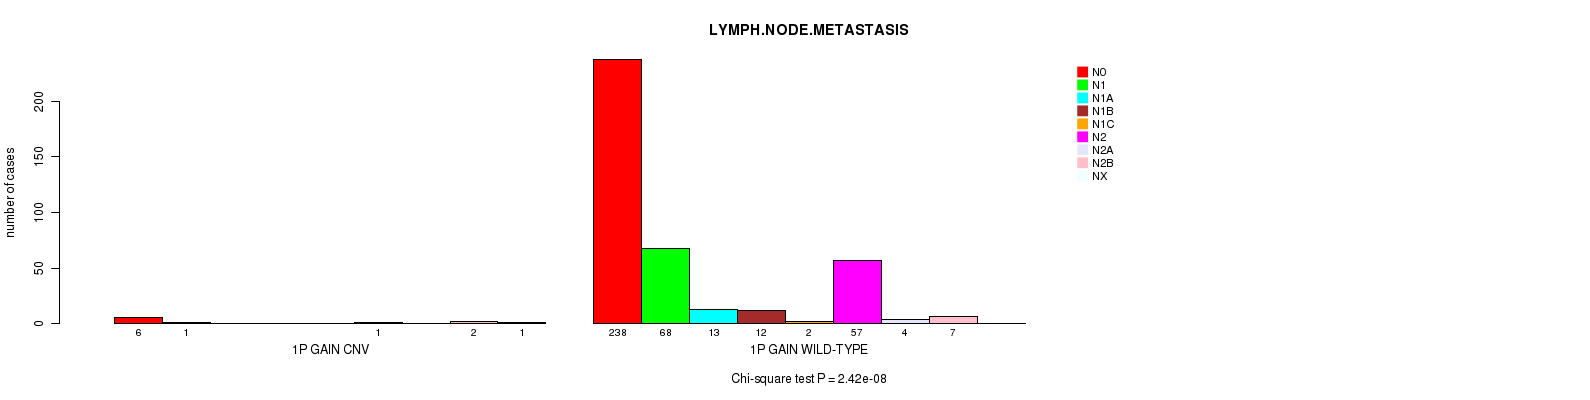
1p gain cnv correlated to 'LYMPH.NODE.METASTASIS'.
-
3p gain cnv correlated to 'DISTANT.METASTASIS'.
-
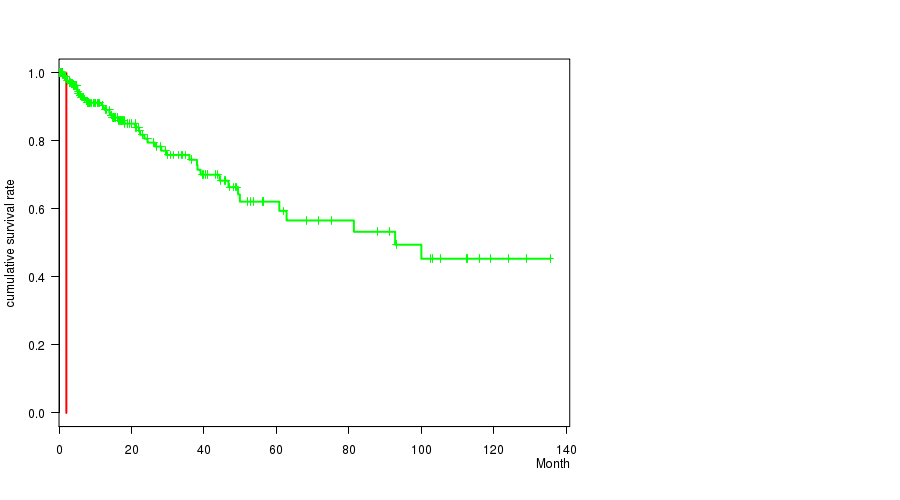
3q gain cnv correlated to 'Time to Death'.
-
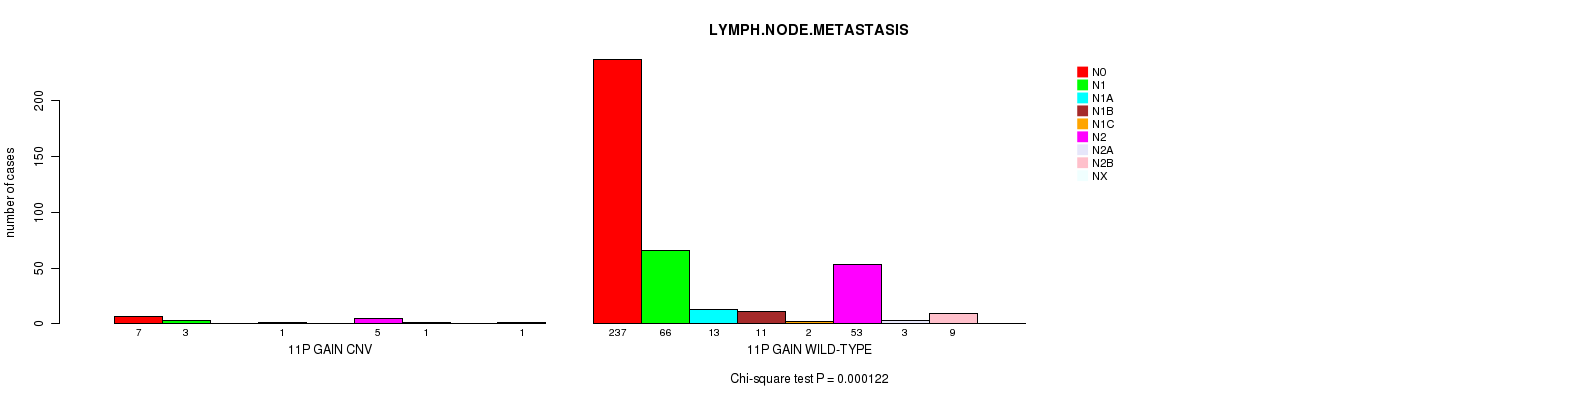
11p gain cnv correlated to 'LYMPH.NODE.METASTASIS'.
-
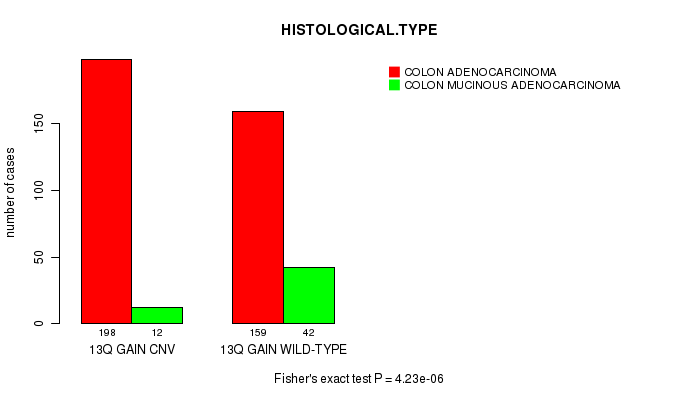
13q gain cnv correlated to 'HISTOLOGICAL.TYPE'.
-
17p gain cnv correlated to 'DISTANT.METASTASIS' and 'LYMPH.NODE.METASTASIS'.
-
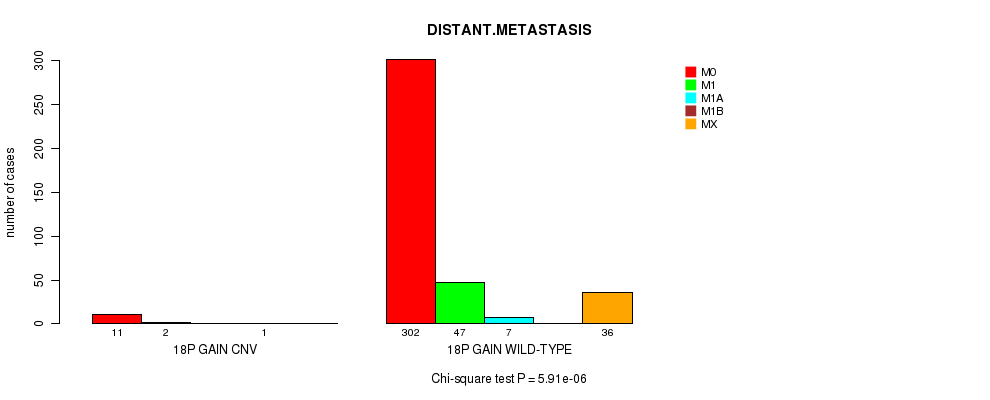
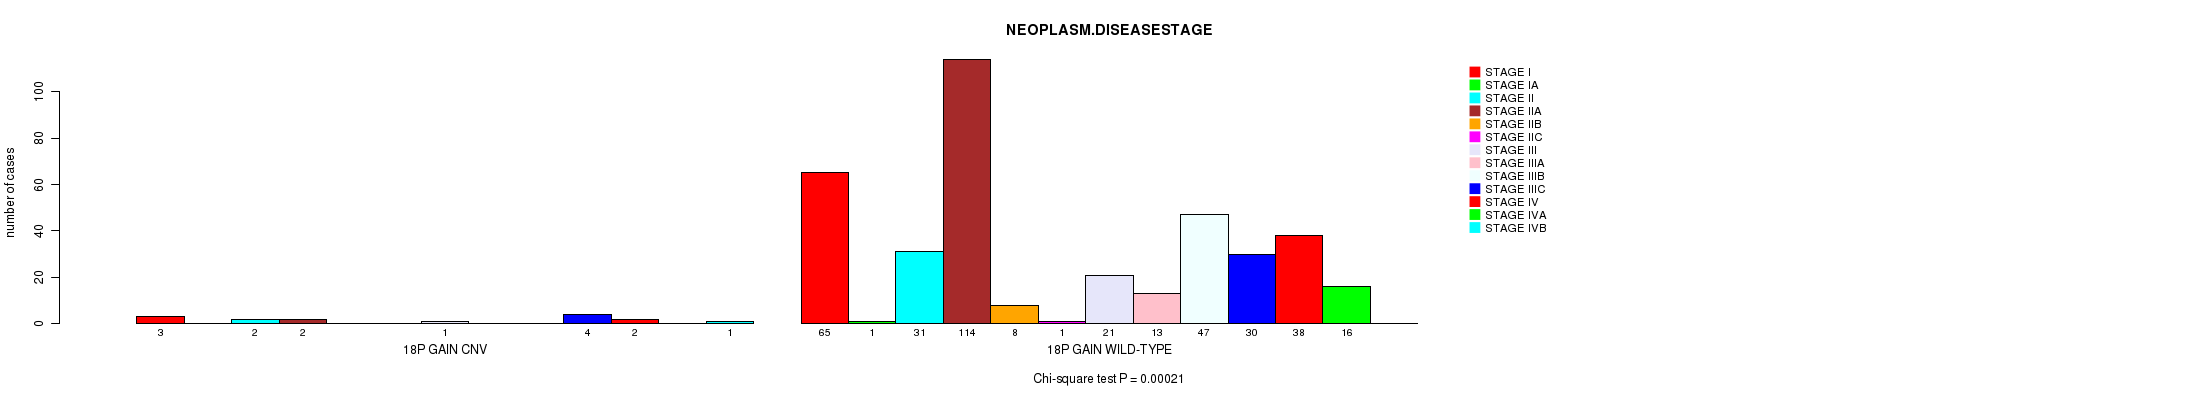
18p gain cnv correlated to 'DISTANT.METASTASIS' and 'NEOPLASM.DISEASESTAGE'.
-
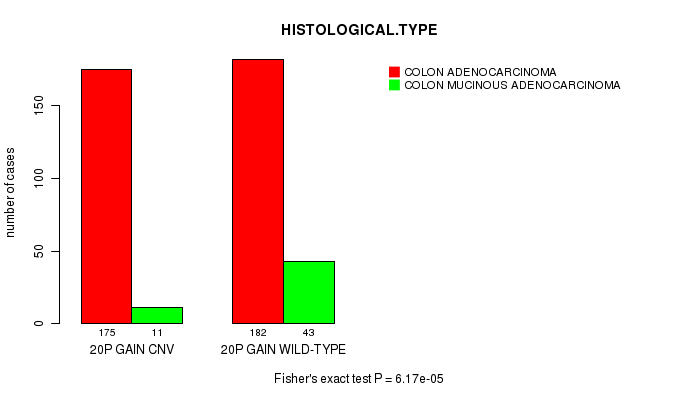
20p gain cnv correlated to 'HISTOLOGICAL.TYPE'.
-
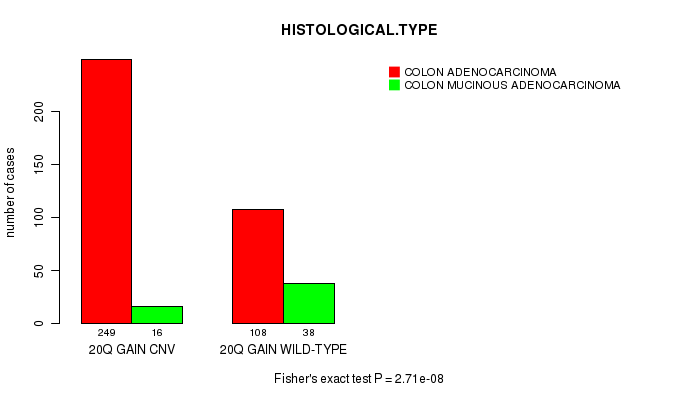
20q gain cnv correlated to 'HISTOLOGICAL.TYPE'.
-
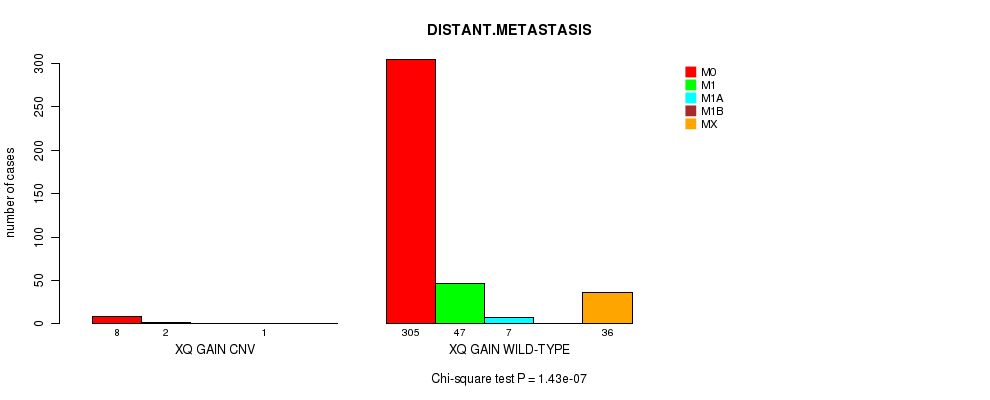
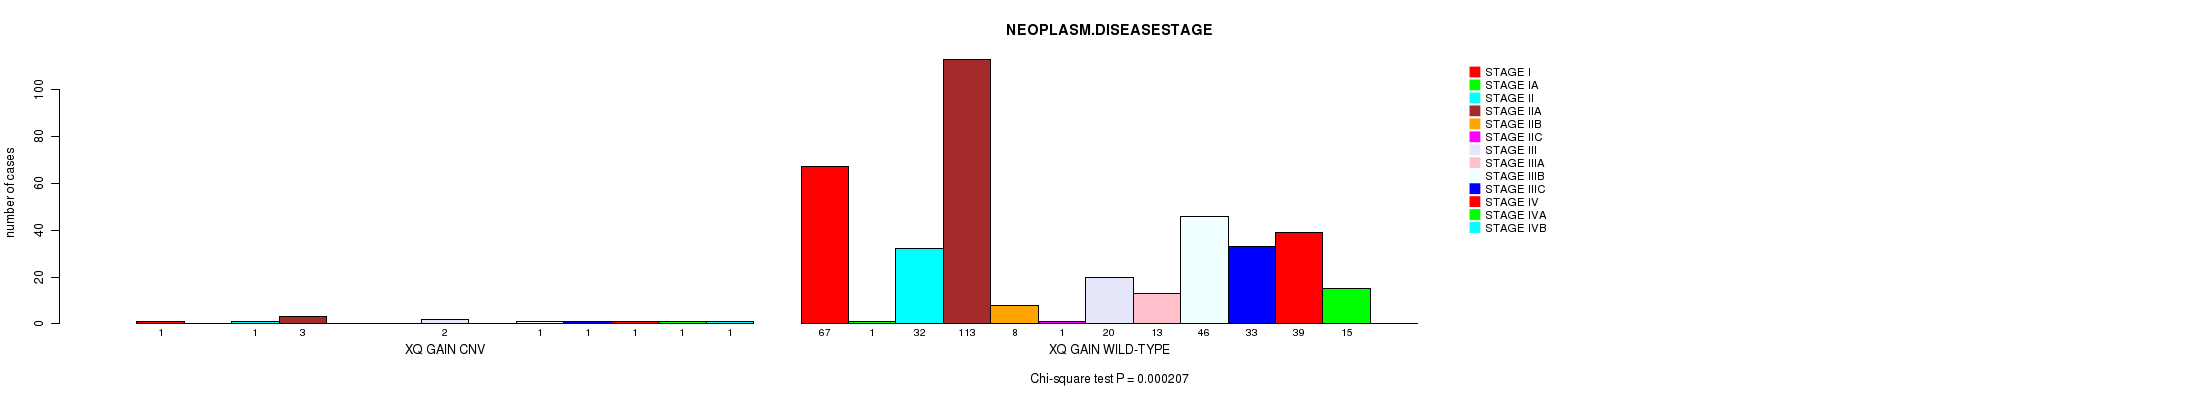
Xq gain cnv correlated to 'DISTANT.METASTASIS' and 'NEOPLASM.DISEASESTAGE'.
-
2p loss cnv correlated to 'Time to Death'.
-
2q loss cnv correlated to 'Time to Death'.
-
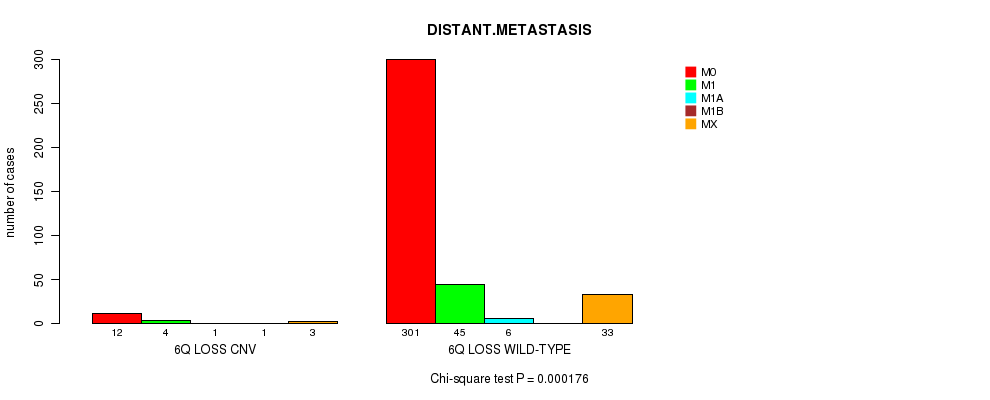
6q loss cnv correlated to 'DISTANT.METASTASIS'.
-
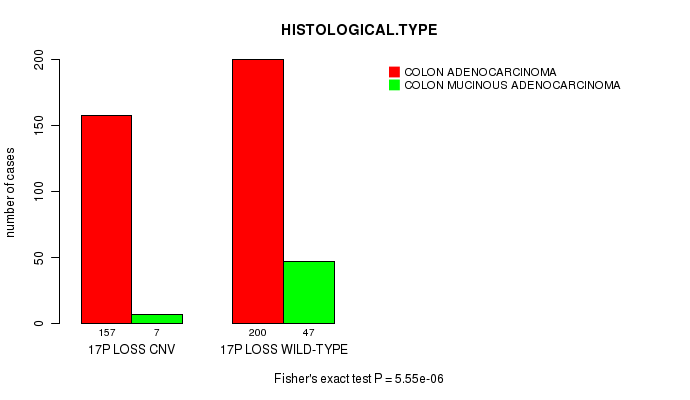
17p loss cnv correlated to 'HISTOLOGICAL.TYPE'.
-
18p loss cnv correlated to 'HISTOLOGICAL.TYPE'.
-
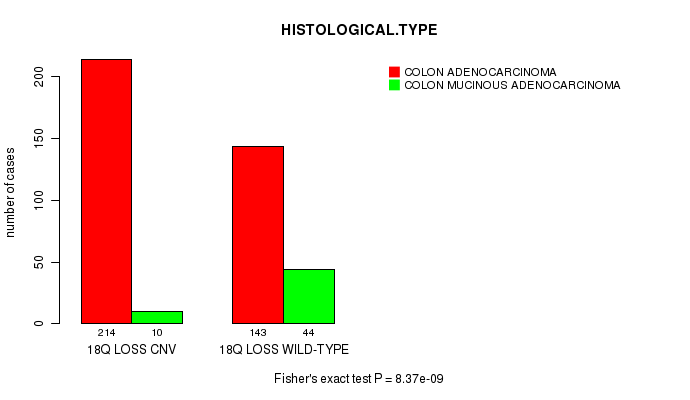
18q loss cnv correlated to 'HISTOLOGICAL.TYPE'.
-
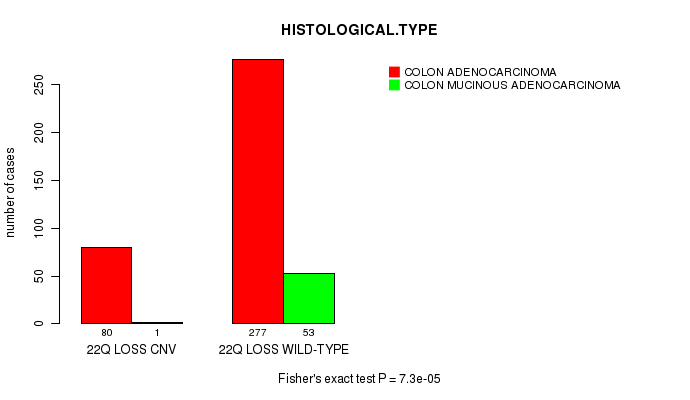
22q loss cnv correlated to 'HISTOLOGICAL.TYPE'.
Table 1. Get Full Table Overview of the association between significant copy number variation of 76 arm-level results and 11 clinical features. Shown in the table are P values (Q values). Thresholded by Q value < 0.25, 20 significant findings detected.
|
Clinical Features |
Time to Death |
AGE | GENDER |
HISTOLOGICAL TYPE |
RADIATIONS RADIATION REGIMENINDICATION |
DISTANT METASTASIS |
LYMPH NODE METASTASIS |
COMPLETENESS OF RESECTION |
NUMBER OF LYMPH NODES |
TUMOR STAGECODE |
NEOPLASM DISEASESTAGE |
||
| nCNV (%) | nWild-Type | logrank test | t-test | Fisher's exact test | Fisher's exact test | Fisher's exact test | Chi-square test | Chi-square test | Fisher's exact test | t-test | t-test | Chi-square test | |
| 17p gain | 0 (0%) | 404 |
0.209 (1.00) |
0.863 (1.00) |
0.739 (1.00) |
0.613 (1.00) |
1 (1.00) |
0.000123 (0.0914) |
3.74e-05 (0.028) |
1 (1.00) |
0.324 (1.00) |
0.00752 (1.00) |
|
| 18p gain | 0 (0%) | 398 |
0.32 (1.00) |
0.816 (1.00) |
1 (1.00) |
0.0347 (1.00) |
1 (1.00) |
5.91e-06 (0.00444) |
0.0497 (1.00) |
1 (1.00) |
0.0804 (1.00) |
0.00021 (0.155) |
|
| Xq gain | 0 (0%) | 401 |
0.0126 (1.00) |
0.315 (1.00) |
1 (1.00) |
0.663 (1.00) |
1 (1.00) |
1.43e-07 (0.000108) |
0.00922 (1.00) |
0.621 (1.00) |
0.0911 (1.00) |
0.000207 (0.154) |
|
| 1p gain | 0 (0%) | 402 |
0.443 (1.00) |
0.664 (1.00) |
1 (1.00) |
1 (1.00) |
1 (1.00) |
0.775 (1.00) |
2.42e-08 (1.83e-05) |
0.76 (1.00) |
0.573 (1.00) |
0.725 (1.00) |
|
| 3p gain | 0 (0%) | 393 |
0.00107 (0.786) |
0.152 (1.00) |
0.495 (1.00) |
1 (1.00) |
1 (1.00) |
0.000104 (0.0773) |
0.248 (1.00) |
0.513 (1.00) |
0.291 (1.00) |
0.00329 (1.00) |
|
| 3q gain | 0 (0%) | 383 |
4e-05 (0.03) |
0.588 (1.00) |
0.26 (1.00) |
1 (1.00) |
1 (1.00) |
0.000351 (0.26) |
0.00246 (1.00) |
0.839 (1.00) |
0.215 (1.00) |
0.00551 (1.00) |
|
| 11p gain | 0 (0%) | 395 |
0.401 (1.00) |
0.198 (1.00) |
0.631 (1.00) |
0.147 (1.00) |
1 (1.00) |
0.929 (1.00) |
0.000122 (0.0912) |
0.48 (1.00) |
0.223 (1.00) |
0.33 (1.00) |
|
| 13q gain | 0 (0%) | 202 |
0.742 (1.00) |
0.942 (1.00) |
0.325 (1.00) |
4.23e-06 (0.00318) |
0.249 (1.00) |
0.13 (1.00) |
0.0767 (1.00) |
0.0374 (1.00) |
0.818 (1.00) |
0.0521 (1.00) |
|
| 20p gain | 0 (0%) | 225 |
0.273 (1.00) |
0.283 (1.00) |
0.0745 (1.00) |
6.17e-05 (0.0461) |
0.594 (1.00) |
0.0401 (1.00) |
0.842 (1.00) |
0.0301 (1.00) |
0.369 (1.00) |
0.00357 (1.00) |
|
| 20q gain | 0 (0%) | 146 |
0.617 (1.00) |
0.625 (1.00) |
0.217 (1.00) |
2.71e-08 (2.05e-05) |
1 (1.00) |
0.174 (1.00) |
0.405 (1.00) |
0.201 (1.00) |
0.306 (1.00) |
0.00973 (1.00) |
|
| 2p loss | 0 (0%) | 409 |
2.2e-07 (0.000166) |
0.693 (1.00) |
0.627 (1.00) |
1 (1.00) |
1 (1.00) |
0.878 (1.00) |
0.998 (1.00) |
1 (1.00) |
0.854 (1.00) |
0.857 (1.00) |
|
| 2q loss | 0 (0%) | 407 |
2.52e-06 (0.0019) |
0.81 (1.00) |
0.222 (1.00) |
1 (1.00) |
1 (1.00) |
0.771 (1.00) |
0.988 (1.00) |
1 (1.00) |
0.815 (1.00) |
0.666 (1.00) |
|
| 6q loss | 0 (0%) | 392 |
0.0106 (1.00) |
0.368 (1.00) |
1 (1.00) |
0.747 (1.00) |
1 (1.00) |
0.000176 (0.13) |
0.184 (1.00) |
0.102 (1.00) |
0.0243 (1.00) |
0.0167 (1.00) |
|
| 17p loss | 0 (0%) | 249 |
0.171 (1.00) |
0.339 (1.00) |
0.227 (1.00) |
5.55e-06 (0.00418) |
0.566 (1.00) |
0.000854 (0.628) |
0.0311 (1.00) |
0.0105 (1.00) |
0.00374 (1.00) |
0.00548 (1.00) |
|
| 18p loss | 0 (0%) | 204 |
0.372 (1.00) |
0.108 (1.00) |
1 (1.00) |
1.11e-09 (8.41e-07) |
1 (1.00) |
0.0279 (1.00) |
0.0454 (1.00) |
0.0597 (1.00) |
0.0435 (1.00) |
0.00696 (1.00) |
|
| 18q loss | 0 (0%) | 188 |
0.272 (1.00) |
0.119 (1.00) |
0.374 (1.00) |
8.37e-09 (6.36e-06) |
0.254 (1.00) |
0.0135 (1.00) |
0.062 (1.00) |
0.12 (1.00) |
0.0477 (1.00) |
0.00489 (1.00) |
|
| 22q loss | 0 (0%) | 332 |
0.571 (1.00) |
0.105 (1.00) |
0.536 (1.00) |
7.3e-05 (0.0545) |
0.481 (1.00) |
0.145 (1.00) |
0.0621 (1.00) |
0.0495 (1.00) |
0.095 (1.00) |
0.346 (1.00) |
|
| 1q gain | 0 (0%) | 366 |
0.897 (1.00) |
0.466 (1.00) |
0.087 (1.00) |
0.173 (1.00) |
1 (1.00) |
0.227 (1.00) |
0.152 (1.00) |
0.625 (1.00) |
0.663 (1.00) |
0.337 (1.00) |
|
| 2p gain | 0 (0%) | 373 |
0.614 (1.00) |
0.61 (1.00) |
0.869 (1.00) |
0.0446 (1.00) |
0.264 (1.00) |
0.895 (1.00) |
0.00703 (1.00) |
0.152 (1.00) |
0.616 (1.00) |
0.0121 (1.00) |
|
| 2q gain | 0 (0%) | 374 |
0.916 (1.00) |
0.781 (1.00) |
0.738 (1.00) |
0.0436 (1.00) |
0.258 (1.00) |
0.786 (1.00) |
0.00183 (1.00) |
0.288 (1.00) |
0.304 (1.00) |
0.00398 (1.00) |
|
| 4p gain | 0 (0%) | 410 |
0.449 (1.00) |
0.569 (1.00) |
1 (1.00) |
0.345 (1.00) |
1 (1.00) |
0.000367 (0.271) |
0.00156 (1.00) |
1 (1.00) |
0.478 (1.00) |
0.431 (1.00) |
|
| 4q gain | 0 (0%) | 408 |
0.448 (1.00) |
0.856 (1.00) |
0.667 (1.00) |
0.507 (1.00) |
1 (1.00) |
0.289 (1.00) |
0.212 (1.00) |
0.119 (1.00) |
0.393 (1.00) |
0.514 (1.00) |
|
| 5p gain | 0 (0%) | 374 |
0.802 (1.00) |
0.0805 (1.00) |
0.238 (1.00) |
0.453 (1.00) |
1 (1.00) |
0.346 (1.00) |
0.251 (1.00) |
0.744 (1.00) |
0.861 (1.00) |
0.332 (1.00) |
|
| 5q gain | 0 (0%) | 392 |
0.609 (1.00) |
0.285 (1.00) |
0.372 (1.00) |
0.336 (1.00) |
1 (1.00) |
0.739 (1.00) |
0.0724 (1.00) |
0.868 (1.00) |
0.234 (1.00) |
0.133 (1.00) |
|
| 6p gain | 0 (0%) | 363 |
0.754 (1.00) |
0.574 (1.00) |
0.763 (1.00) |
0.506 (1.00) |
1 (1.00) |
0.995 (1.00) |
0.113 (1.00) |
0.852 (1.00) |
0.128 (1.00) |
0.162 (1.00) |
|
| 6q gain | 0 (0%) | 368 |
0.681 (1.00) |
0.9 (1.00) |
0.874 (1.00) |
1 (1.00) |
1 (1.00) |
0.969 (1.00) |
0.0225 (1.00) |
0.702 (1.00) |
0.157 (1.00) |
0.104 (1.00) |
|
| 7p gain | 0 (0%) | 213 |
0.253 (1.00) |
0.362 (1.00) |
0.921 (1.00) |
0.00121 (0.888) |
0.113 (1.00) |
0.0308 (1.00) |
0.0623 (1.00) |
0.0927 (1.00) |
0.142 (1.00) |
0.00231 (1.00) |
|
| 7q gain | 0 (0%) | 238 |
0.3 (1.00) |
0.448 (1.00) |
0.842 (1.00) |
0.0115 (1.00) |
0.577 (1.00) |
0.0177 (1.00) |
0.418 (1.00) |
0.0879 (1.00) |
0.347 (1.00) |
0.151 (1.00) |
|
| 8p gain | 0 (0%) | 333 |
0.832 (1.00) |
0.199 (1.00) |
0.456 (1.00) |
1 (1.00) |
0.477 (1.00) |
0.936 (1.00) |
0.21 (1.00) |
0.321 (1.00) |
0.371 (1.00) |
0.469 (1.00) |
|
| 8q gain | 0 (0%) | 251 |
0.605 (1.00) |
0.0678 (1.00) |
0.226 (1.00) |
0.00677 (1.00) |
0.564 (1.00) |
0.305 (1.00) |
0.255 (1.00) |
0.421 (1.00) |
0.993 (1.00) |
0.4 (1.00) |
|
| 9p gain | 0 (0%) | 367 |
0.0763 (1.00) |
0.544 (1.00) |
0.347 (1.00) |
0.357 (1.00) |
1 (1.00) |
0.779 (1.00) |
0.93 (1.00) |
0.769 (1.00) |
0.949 (1.00) |
0.357 (1.00) |
|
| 9q gain | 0 (0%) | 374 |
0.0608 (1.00) |
0.608 (1.00) |
0.18 (1.00) |
0.621 (1.00) |
1 (1.00) |
0.773 (1.00) |
0.678 (1.00) |
0.759 (1.00) |
0.926 (1.00) |
0.681 (1.00) |
|
| 10p gain | 0 (0%) | 395 |
0.0108 (1.00) |
0.098 (1.00) |
0.812 (1.00) |
0.489 (1.00) |
1 (1.00) |
0.622 (1.00) |
0.0515 (1.00) |
0.19 (1.00) |
0.118 (1.00) |
0.247 (1.00) |
|
| 10q gain | 0 (0%) | 406 |
0.786 (1.00) |
0.0299 (1.00) |
1 (1.00) |
0.231 (1.00) |
1 (1.00) |
0.861 (1.00) |
0.188 (1.00) |
0.416 (1.00) |
0.115 (1.00) |
0.127 (1.00) |
|
| 11q gain | 0 (0%) | 391 |
0.194 (1.00) |
0.0508 (1.00) |
0.827 (1.00) |
0.0955 (1.00) |
1 (1.00) |
0.863 (1.00) |
0.175 (1.00) |
0.198 (1.00) |
0.302 (1.00) |
0.0979 (1.00) |
|
| 12p gain | 0 (0%) | 347 |
0.642 (1.00) |
0.0837 (1.00) |
1 (1.00) |
0.69 (1.00) |
1 (1.00) |
0.447 (1.00) |
0.108 (1.00) |
0.544 (1.00) |
0.0639 (1.00) |
0.0364 (1.00) |
|
| 12q gain | 0 (0%) | 353 |
0.861 (1.00) |
0.0503 (1.00) |
0.781 (1.00) |
0.679 (1.00) |
1 (1.00) |
0.189 (1.00) |
0.35 (1.00) |
0.449 (1.00) |
0.000723 (0.532) |
0.0112 (1.00) |
|
| 14q gain | 0 (0%) | 398 |
0.512 (1.00) |
0.922 (1.00) |
0.43 (1.00) |
0.43 (1.00) |
1 (1.00) |
0.00351 (1.00) |
0.485 (1.00) |
0.847 (1.00) |
0.81 (1.00) |
0.649 (1.00) |
|
| 15q gain | 0 (0%) | 408 |
0.489 (1.00) |
0.709 (1.00) |
1 (1.00) |
1 (1.00) |
1 (1.00) |
0.826 (1.00) |
0.498 (1.00) |
1 (1.00) |
0.00881 (1.00) |
0.981 (1.00) |
|
| 16p gain | 0 (0%) | 346 |
0.929 (1.00) |
0.205 (1.00) |
0.79 (1.00) |
0.018 (1.00) |
0.413 (1.00) |
0.657 (1.00) |
0.0767 (1.00) |
0.816 (1.00) |
0.539 (1.00) |
0.0366 (1.00) |
|
| 16q gain | 0 (0%) | 347 |
0.747 (1.00) |
0.107 (1.00) |
1 (1.00) |
0.0269 (1.00) |
0.408 (1.00) |
0.63 (1.00) |
0.00873 (1.00) |
0.872 (1.00) |
0.543 (1.00) |
0.00174 (1.00) |
|
| 17q gain | 0 (0%) | 365 |
0.0555 (1.00) |
0.335 (1.00) |
0.539 (1.00) |
0.0648 (1.00) |
0.31 (1.00) |
0.00593 (1.00) |
0.0168 (1.00) |
0.955 (1.00) |
0.117 (1.00) |
0.192 (1.00) |
|
| 18q gain | 0 (0%) | 404 |
0.7 (1.00) |
0.331 (1.00) |
0.513 (1.00) |
0.101 (1.00) |
1 (1.00) |
0.91 (1.00) |
0.632 (1.00) |
1 (1.00) |
0.629 (1.00) |
0.855 (1.00) |
|
| 19p gain | 0 (0%) | 379 |
0.604 (1.00) |
0.445 (1.00) |
0.858 (1.00) |
0.0671 (1.00) |
1 (1.00) |
0.166 (1.00) |
0.695 (1.00) |
0.158 (1.00) |
0.0304 (1.00) |
0.808 (1.00) |
|
| 19q gain | 0 (0%) | 372 |
0.29 (1.00) |
0.403 (1.00) |
0.869 (1.00) |
0.631 (1.00) |
1 (1.00) |
0.588 (1.00) |
0.937 (1.00) |
0.144 (1.00) |
0.994 (1.00) |
0.983 (1.00) |
|
| 21q gain | 0 (0%) | 402 |
0.155 (1.00) |
0.00583 (1.00) |
0.761 (1.00) |
1 (1.00) |
1 (1.00) |
0.799 (1.00) |
0.451 (1.00) |
1 (1.00) |
0.782 (1.00) |
0.177 (1.00) |
|
| 1p loss | 0 (0%) | 362 |
0.0134 (1.00) |
0.507 (1.00) |
1 (1.00) |
0.122 (1.00) |
1 (1.00) |
0.0296 (1.00) |
0.0825 (1.00) |
0.14 (1.00) |
0.0719 (1.00) |
0.184 (1.00) |
|
| 1q loss | 0 (0%) | 395 |
0.548 (1.00) |
0.256 (1.00) |
0.631 (1.00) |
1 (1.00) |
1 (1.00) |
0.42 (1.00) |
0.804 (1.00) |
0.256 (1.00) |
0.53 (1.00) |
0.922 (1.00) |
|
| 3p loss | 0 (0%) | 386 |
0.00037 (0.273) |
0.754 (1.00) |
0.327 (1.00) |
0.232 (1.00) |
1 (1.00) |
0.0256 (1.00) |
0.399 (1.00) |
0.211 (1.00) |
0.204 (1.00) |
0.446 (1.00) |
|
| 3q loss | 0 (0%) | 401 |
0.0356 (1.00) |
0.0171 (1.00) |
0.0414 (1.00) |
0.38 (1.00) |
1 (1.00) |
0.188 (1.00) |
0.971 (1.00) |
0.219 (1.00) |
0.475 (1.00) |
0.524 (1.00) |
|
| 4p loss | 0 (0%) | 329 |
0.00181 (1.00) |
0.764 (1.00) |
0.808 (1.00) |
0.0104 (1.00) |
0.495 (1.00) |
0.0021 (1.00) |
0.114 (1.00) |
0.0621 (1.00) |
0.0143 (1.00) |
0.0457 (1.00) |
|
| 4q loss | 0 (0%) | 345 |
0.0268 (1.00) |
0.478 (1.00) |
0.595 (1.00) |
0.018 (1.00) |
0.418 (1.00) |
0.123 (1.00) |
0.29 (1.00) |
0.172 (1.00) |
0.0607 (1.00) |
0.401 (1.00) |
|
| 5p loss | 0 (0%) | 388 |
0.764 (1.00) |
0.819 (1.00) |
1 (1.00) |
0.227 (1.00) |
0.171 (1.00) |
0.821 (1.00) |
0.355 (1.00) |
0.651 (1.00) |
0.22 (1.00) |
0.00114 (0.832) |
|
| 5q loss | 0 (0%) | 375 |
0.34 (1.00) |
0.867 (1.00) |
0.0609 (1.00) |
0.0434 (1.00) |
0.252 (1.00) |
0.724 (1.00) |
0.0543 (1.00) |
0.521 (1.00) |
0.0202 (1.00) |
0.189 (1.00) |
|
| 6p loss | 0 (0%) | 401 |
0.736 (1.00) |
0.625 (1.00) |
0.778 (1.00) |
1 (1.00) |
1 (1.00) |
0.363 (1.00) |
0.961 (1.00) |
0.0139 (1.00) |
0.927 (1.00) |
0.98 (1.00) |
|
| 8p loss | 0 (0%) | 320 |
0.601 (1.00) |
0.641 (1.00) |
0.239 (1.00) |
0.0813 (1.00) |
0.536 (1.00) |
0.117 (1.00) |
0.124 (1.00) |
0.187 (1.00) |
0.0337 (1.00) |
0.336 (1.00) |
|
| 8q loss | 0 (0%) | 405 |
0.881 (1.00) |
0.21 (1.00) |
0.294 (1.00) |
1 (1.00) |
1 (1.00) |
0.671 (1.00) |
0.569 (1.00) |
0.612 (1.00) |
0.811 (1.00) |
0.341 (1.00) |
|
| 9p loss | 0 (0%) | 386 |
0.203 (1.00) |
0.0653 (1.00) |
1 (1.00) |
0.556 (1.00) |
1 (1.00) |
0.917 (1.00) |
0.0125 (1.00) |
0.816 (1.00) |
0.702 (1.00) |
0.949 (1.00) |
|
| 9q loss | 0 (0%) | 387 |
0.802 (1.00) |
0.0045 (1.00) |
0.31 (1.00) |
0.227 (1.00) |
1 (1.00) |
0.926 (1.00) |
0.489 (1.00) |
0.816 (1.00) |
0.736 (1.00) |
0.947 (1.00) |
|
| 10p loss | 0 (0%) | 391 |
0.812 (1.00) |
0.321 (1.00) |
0.512 (1.00) |
1 (1.00) |
1 (1.00) |
0.103 (1.00) |
0.876 (1.00) |
0.0603 (1.00) |
0.526 (1.00) |
0.546 (1.00) |
|
| 10q loss | 0 (0%) | 389 |
0.28 (1.00) |
0.178 (1.00) |
0.528 (1.00) |
1 (1.00) |
1 (1.00) |
0.197 (1.00) |
0.812 (1.00) |
0.0384 (1.00) |
0.772 (1.00) |
0.839 (1.00) |
|
| 11p loss | 0 (0%) | 391 |
0.297 (1.00) |
0.207 (1.00) |
1 (1.00) |
0.335 (1.00) |
1 (1.00) |
0.733 (1.00) |
0.857 (1.00) |
0.147 (1.00) |
0.348 (1.00) |
0.966 (1.00) |
|
| 11q loss | 0 (0%) | 386 |
0.799 (1.00) |
0.285 (1.00) |
0.425 (1.00) |
0.556 (1.00) |
1 (1.00) |
0.452 (1.00) |
0.726 (1.00) |
0.109 (1.00) |
0.485 (1.00) |
0.905 (1.00) |
|
| 12p loss | 0 (0%) | 392 |
0.29 (1.00) |
0.775 (1.00) |
0.372 (1.00) |
0.0918 (1.00) |
0.145 (1.00) |
0.795 (1.00) |
0.287 (1.00) |
0.886 (1.00) |
0.396 (1.00) |
0.764 (1.00) |
|
| 12q loss | 0 (0%) | 393 |
0.474 (1.00) |
0.941 (1.00) |
0.254 (1.00) |
0.0904 (1.00) |
1 (1.00) |
0.739 (1.00) |
0.428 (1.00) |
0.793 (1.00) |
0.484 (1.00) |
0.858 (1.00) |
|
| 13q loss | 0 (0%) | 407 |
0.232 (1.00) |
0.627 (1.00) |
1 (1.00) |
0.573 (1.00) |
1 (1.00) |
0.493 (1.00) |
0.505 (1.00) |
0.288 (1.00) |
0.282 (1.00) |
0.842 (1.00) |
|
| 14q loss | 0 (0%) | 319 |
0.373 (1.00) |
0.939 (1.00) |
0.638 (1.00) |
0.000718 (0.529) |
1 (1.00) |
0.264 (1.00) |
0.194 (1.00) |
0.489 (1.00) |
0.739 (1.00) |
0.327 (1.00) |
|
| 15q loss | 0 (0%) | 314 |
0.371 (1.00) |
0.424 (1.00) |
0.908 (1.00) |
0.00172 (1.00) |
0.562 (1.00) |
0.211 (1.00) |
0.856 (1.00) |
0.428 (1.00) |
0.524 (1.00) |
0.54 (1.00) |
|
| 16p loss | 0 (0%) | 404 |
0.88 (1.00) |
0.999 (1.00) |
0.314 (1.00) |
0.336 (1.00) |
1 (1.00) |
0.993 (1.00) |
0.928 (1.00) |
0.527 (1.00) |
0.486 (1.00) |
0.957 (1.00) |
|
| 16q loss | 0 (0%) | 406 |
0.478 (1.00) |
0.612 (1.00) |
0.709 (1.00) |
0.231 (1.00) |
1 (1.00) |
0.98 (1.00) |
0.999 (1.00) |
0.235 (1.00) |
0.351 (1.00) |
0.997 (1.00) |
|
| 17q loss | 0 (0%) | 381 |
0.763 (1.00) |
0.544 (1.00) |
0.715 (1.00) |
0.101 (1.00) |
1 (1.00) |
0.366 (1.00) |
0.167 (1.00) |
0.0531 (1.00) |
0.204 (1.00) |
0.238 (1.00) |
|
| 19p loss | 0 (0%) | 399 |
0.289 (1.00) |
0.5 (1.00) |
0.187 (1.00) |
0.232 (1.00) |
1 (1.00) |
0.224 (1.00) |
0.943 (1.00) |
0.0642 (1.00) |
0.261 (1.00) |
0.27 (1.00) |
|
| 19q loss | 0 (0%) | 400 |
0.289 (1.00) |
0.73 (1.00) |
0.155 (1.00) |
0.233 (1.00) |
1 (1.00) |
0.165 (1.00) |
0.966 (1.00) |
0.049 (1.00) |
0.543 (1.00) |
0.366 (1.00) |
|
| 20p loss | 0 (0%) | 380 |
0.562 (1.00) |
0.806 (1.00) |
0.857 (1.00) |
0.599 (1.00) |
1 (1.00) |
0.709 (1.00) |
0.908 (1.00) |
0.678 (1.00) |
0.509 (1.00) |
0.224 (1.00) |
|
| 21q loss | 0 (0%) | 342 |
0.666 (1.00) |
0.675 (1.00) |
0.795 (1.00) |
0.0513 (1.00) |
1 (1.00) |
0.928 (1.00) |
0.713 (1.00) |
0.947 (1.00) |
0.144 (1.00) |
0.761 (1.00) |
|
| Xq loss | 0 (0%) | 408 |
0.718 (1.00) |
0.78 (1.00) |
0.667 (1.00) |
0.507 (1.00) |
1 (1.00) |
0.868 (1.00) |
0.0925 (1.00) |
1 (1.00) |
0.466 (1.00) |
0.764 (1.00) |
P value = 2.42e-08 (Chi-square test), Q value = 1.8e-05
Table S1. Gene #1: '1p gain' versus Clinical Feature #7: 'LYMPH.NODE.METASTASIS'
| nPatients | N0 | N1 | N1A | N1B | N1C | N2 | N2A | N2B | NX |
|---|---|---|---|---|---|---|---|---|---|
| ALL | 244 | 69 | 13 | 12 | 2 | 58 | 4 | 9 | 1 |
| 1P GAIN CNV | 6 | 1 | 0 | 0 | 0 | 1 | 0 | 2 | 1 |
| 1P GAIN WILD-TYPE | 238 | 68 | 13 | 12 | 2 | 57 | 4 | 7 | 0 |
Figure S1. Get High-res Image Gene #1: '1p gain' versus Clinical Feature #7: 'LYMPH.NODE.METASTASIS'
P value = 0.000104 (Chi-square test), Q value = 0.077
Table S2. Gene #5: '3p gain' versus Clinical Feature #6: 'DISTANT.METASTASIS'
| nPatients | M0 | M1 | M1A | M1B | MX |
|---|---|---|---|---|---|
| ALL | 313 | 49 | 7 | 1 | 36 |
| 3P GAIN CNV | 12 | 2 | 1 | 1 | 3 |
| 3P GAIN WILD-TYPE | 301 | 47 | 6 | 0 | 33 |
Figure S2. Get High-res Image Gene #5: '3p gain' versus Clinical Feature #6: 'DISTANT.METASTASIS'

P value = 4e-05 (logrank test), Q value = 0.03
Table S3. Gene #6: '3q gain' versus Clinical Feature #1: 'Time to Death'
| nPatients | nDeath | Duration Range (Median), Month | |
|---|---|---|---|
| ALL | 321 | 49 | 0.1 - 135.5 (7.7) |
| 3Q GAIN CNV | 23 | 8 | 0.2 - 46.8 (5.0) |
| 3Q GAIN WILD-TYPE | 298 | 41 | 0.1 - 135.5 (8.0) |
Figure S3. Get High-res Image Gene #6: '3q gain' versus Clinical Feature #1: 'Time to Death'

P value = 0.000122 (Chi-square test), Q value = 0.091
Table S4. Gene #21: '11p gain' versus Clinical Feature #7: 'LYMPH.NODE.METASTASIS'
| nPatients | N0 | N1 | N1A | N1B | N1C | N2 | N2A | N2B | NX |
|---|---|---|---|---|---|---|---|---|---|
| ALL | 244 | 69 | 13 | 12 | 2 | 58 | 4 | 9 | 1 |
| 11P GAIN CNV | 7 | 3 | 0 | 1 | 0 | 5 | 1 | 0 | 1 |
| 11P GAIN WILD-TYPE | 237 | 66 | 13 | 11 | 2 | 53 | 3 | 9 | 0 |
Figure S4. Get High-res Image Gene #21: '11p gain' versus Clinical Feature #7: 'LYMPH.NODE.METASTASIS'
P value = 4.23e-06 (Fisher's exact test), Q value = 0.0032
Table S5. Gene #25: '13q gain' versus Clinical Feature #4: 'HISTOLOGICAL.TYPE'
| nPatients | COLON ADENOCARCINOMA | COLON MUCINOUS ADENOCARCINOMA |
|---|---|---|
| ALL | 357 | 54 |
| 13Q GAIN CNV | 198 | 12 |
| 13Q GAIN WILD-TYPE | 159 | 42 |
Figure S5. Get High-res Image Gene #25: '13q gain' versus Clinical Feature #4: 'HISTOLOGICAL.TYPE'
P value = 0.000123 (Chi-square test), Q value = 0.091
Table S6. Gene #30: '17p gain' versus Clinical Feature #6: 'DISTANT.METASTASIS'
| nPatients | M0 | M1 | M1A | M1B | MX |
|---|---|---|---|---|---|
| ALL | 313 | 49 | 7 | 1 | 36 |
| 17P GAIN CNV | 5 | 1 | 2 | 0 | 1 |
| 17P GAIN WILD-TYPE | 308 | 48 | 5 | 1 | 35 |
Figure S6. Get High-res Image Gene #30: '17p gain' versus Clinical Feature #6: 'DISTANT.METASTASIS'

P value = 3.74e-05 (Chi-square test), Q value = 0.028
Table S7. Gene #30: '17p gain' versus Clinical Feature #7: 'LYMPH.NODE.METASTASIS'
| nPatients | N0 | N1 | N1A | N1B | N1C | N2 | N2A | N2B | NX |
|---|---|---|---|---|---|---|---|---|---|
| ALL | 244 | 69 | 13 | 12 | 2 | 58 | 4 | 9 | 1 |
| 17P GAIN CNV | 5 | 0 | 2 | 0 | 1 | 1 | 0 | 0 | 0 |
| 17P GAIN WILD-TYPE | 239 | 69 | 11 | 12 | 1 | 57 | 4 | 9 | 1 |
Figure S7. Get High-res Image Gene #30: '17p gain' versus Clinical Feature #7: 'LYMPH.NODE.METASTASIS'

P value = 5.91e-06 (Chi-square test), Q value = 0.0044
Table S8. Gene #32: '18p gain' versus Clinical Feature #6: 'DISTANT.METASTASIS'
| nPatients | M0 | M1 | M1A | M1B | MX |
|---|---|---|---|---|---|
| ALL | 313 | 49 | 7 | 1 | 36 |
| 18P GAIN CNV | 11 | 2 | 0 | 1 | 0 |
| 18P GAIN WILD-TYPE | 302 | 47 | 7 | 0 | 36 |
Figure S8. Get High-res Image Gene #32: '18p gain' versus Clinical Feature #6: 'DISTANT.METASTASIS'
P value = 0.00021 (Chi-square test), Q value = 0.16
Table S9. Gene #32: '18p gain' versus Clinical Feature #11: 'NEOPLASM.DISEASESTAGE'
| nPatients | STAGE I | STAGE IA | STAGE II | STAGE IIA | STAGE IIB | STAGE IIC | STAGE III | STAGE IIIA | STAGE IIIB | STAGE IIIC | STAGE IV | STAGE IVA | STAGE IVB |
|---|---|---|---|---|---|---|---|---|---|---|---|---|---|
| ALL | 68 | 1 | 33 | 116 | 8 | 1 | 22 | 13 | 47 | 34 | 40 | 16 | 1 |
| 18P GAIN CNV | 3 | 0 | 2 | 2 | 0 | 0 | 1 | 0 | 0 | 4 | 2 | 0 | 1 |
| 18P GAIN WILD-TYPE | 65 | 1 | 31 | 114 | 8 | 1 | 21 | 13 | 47 | 30 | 38 | 16 | 0 |
Figure S9. Get High-res Image Gene #32: '18p gain' versus Clinical Feature #11: 'NEOPLASM.DISEASESTAGE'
P value = 6.17e-05 (Fisher's exact test), Q value = 0.046
Table S10. Gene #36: '20p gain' versus Clinical Feature #4: 'HISTOLOGICAL.TYPE'
| nPatients | COLON ADENOCARCINOMA | COLON MUCINOUS ADENOCARCINOMA |
|---|---|---|
| ALL | 357 | 54 |
| 20P GAIN CNV | 175 | 11 |
| 20P GAIN WILD-TYPE | 182 | 43 |
Figure S10. Get High-res Image Gene #36: '20p gain' versus Clinical Feature #4: 'HISTOLOGICAL.TYPE'
P value = 2.71e-08 (Fisher's exact test), Q value = 2.1e-05
Table S11. Gene #37: '20q gain' versus Clinical Feature #4: 'HISTOLOGICAL.TYPE'
| nPatients | COLON ADENOCARCINOMA | COLON MUCINOUS ADENOCARCINOMA |
|---|---|---|
| ALL | 357 | 54 |
| 20Q GAIN CNV | 249 | 16 |
| 20Q GAIN WILD-TYPE | 108 | 38 |
Figure S11. Get High-res Image Gene #37: '20q gain' versus Clinical Feature #4: 'HISTOLOGICAL.TYPE'
P value = 1.43e-07 (Chi-square test), Q value = 0.00011
Table S12. Gene #39: 'Xq gain' versus Clinical Feature #6: 'DISTANT.METASTASIS'
| nPatients | M0 | M1 | M1A | M1B | MX |
|---|---|---|---|---|---|
| ALL | 313 | 49 | 7 | 1 | 36 |
| XQ GAIN CNV | 8 | 2 | 0 | 1 | 0 |
| XQ GAIN WILD-TYPE | 305 | 47 | 7 | 0 | 36 |
Figure S12. Get High-res Image Gene #39: 'Xq gain' versus Clinical Feature #6: 'DISTANT.METASTASIS'
P value = 0.000207 (Chi-square test), Q value = 0.15
Table S13. Gene #39: 'Xq gain' versus Clinical Feature #11: 'NEOPLASM.DISEASESTAGE'
| nPatients | STAGE I | STAGE IA | STAGE II | STAGE IIA | STAGE IIB | STAGE IIC | STAGE III | STAGE IIIA | STAGE IIIB | STAGE IIIC | STAGE IV | STAGE IVA | STAGE IVB |
|---|---|---|---|---|---|---|---|---|---|---|---|---|---|
| ALL | 68 | 1 | 33 | 116 | 8 | 1 | 22 | 13 | 47 | 34 | 40 | 16 | 1 |
| XQ GAIN CNV | 1 | 0 | 1 | 3 | 0 | 0 | 2 | 0 | 1 | 1 | 1 | 1 | 1 |
| XQ GAIN WILD-TYPE | 67 | 1 | 32 | 113 | 8 | 1 | 20 | 13 | 46 | 33 | 39 | 15 | 0 |
Figure S13. Get High-res Image Gene #39: 'Xq gain' versus Clinical Feature #11: 'NEOPLASM.DISEASESTAGE'
P value = 2.2e-07 (logrank test), Q value = 0.00017
Table S14. Gene #42: '2p loss' versus Clinical Feature #1: 'Time to Death'
| nPatients | nDeath | Duration Range (Median), Month | |
|---|---|---|---|
| ALL | 321 | 49 | 0.1 - 135.5 (7.7) |
| 2P LOSS CNV | 3 | 1 | 0.3 - 2.0 (1.0) |
| 2P LOSS WILD-TYPE | 318 | 48 | 0.1 - 135.5 (7.9) |
Figure S14. Get High-res Image Gene #42: '2p loss' versus Clinical Feature #1: 'Time to Death'

P value = 2.52e-06 (logrank test), Q value = 0.0019
Table S15. Gene #43: '2q loss' versus Clinical Feature #1: 'Time to Death'
| nPatients | nDeath | Duration Range (Median), Month | |
|---|---|---|---|
| ALL | 321 | 49 | 0.1 - 135.5 (7.7) |
| 2Q LOSS CNV | 4 | 1 | 0.3 - 2.0 (1.0) |
| 2Q LOSS WILD-TYPE | 317 | 48 | 0.1 - 135.5 (8.0) |
Figure S15. Get High-res Image Gene #43: '2q loss' versus Clinical Feature #1: 'Time to Death'
P value = 0.000176 (Chi-square test), Q value = 0.13
Table S16. Gene #51: '6q loss' versus Clinical Feature #6: 'DISTANT.METASTASIS'
| nPatients | M0 | M1 | M1A | M1B | MX |
|---|---|---|---|---|---|
| ALL | 313 | 49 | 7 | 1 | 36 |
| 6Q LOSS CNV | 12 | 4 | 1 | 1 | 3 |
| 6Q LOSS WILD-TYPE | 301 | 45 | 6 | 0 | 33 |
Figure S16. Get High-res Image Gene #51: '6q loss' versus Clinical Feature #6: 'DISTANT.METASTASIS'
P value = 5.55e-06 (Fisher's exact test), Q value = 0.0042
Table S17. Gene #67: '17p loss' versus Clinical Feature #4: 'HISTOLOGICAL.TYPE'
| nPatients | COLON ADENOCARCINOMA | COLON MUCINOUS ADENOCARCINOMA |
|---|---|---|
| ALL | 357 | 54 |
| 17P LOSS CNV | 157 | 7 |
| 17P LOSS WILD-TYPE | 200 | 47 |
Figure S17. Get High-res Image Gene #67: '17p loss' versus Clinical Feature #4: 'HISTOLOGICAL.TYPE'
P value = 1.11e-09 (Fisher's exact test), Q value = 8.4e-07
Table S18. Gene #69: '18p loss' versus Clinical Feature #4: 'HISTOLOGICAL.TYPE'
| nPatients | COLON ADENOCARCINOMA | COLON MUCINOUS ADENOCARCINOMA |
|---|---|---|
| ALL | 357 | 54 |
| 18P LOSS CNV | 200 | 7 |
| 18P LOSS WILD-TYPE | 157 | 47 |
Figure S18. Get High-res Image Gene #69: '18p loss' versus Clinical Feature #4: 'HISTOLOGICAL.TYPE'

P value = 8.37e-09 (Fisher's exact test), Q value = 6.4e-06
Table S19. Gene #70: '18q loss' versus Clinical Feature #4: 'HISTOLOGICAL.TYPE'
| nPatients | COLON ADENOCARCINOMA | COLON MUCINOUS ADENOCARCINOMA |
|---|---|---|
| ALL | 357 | 54 |
| 18Q LOSS CNV | 214 | 10 |
| 18Q LOSS WILD-TYPE | 143 | 44 |
Figure S19. Get High-res Image Gene #70: '18q loss' versus Clinical Feature #4: 'HISTOLOGICAL.TYPE'
P value = 7.3e-05 (Fisher's exact test), Q value = 0.054
Table S20. Gene #75: '22q loss' versus Clinical Feature #4: 'HISTOLOGICAL.TYPE'
| nPatients | COLON ADENOCARCINOMA | COLON MUCINOUS ADENOCARCINOMA |
|---|---|---|
| ALL | 357 | 54 |
| 22Q LOSS CNV | 80 | 1 |
| 22Q LOSS WILD-TYPE | 277 | 53 |
Figure S20. Get High-res Image Gene #75: '22q loss' versus Clinical Feature #4: 'HISTOLOGICAL.TYPE'
-
Mutation data file = broad_values_by_arm.mutsig.cluster.txt
-
Clinical data file = COAD-TP.clin.merged.picked.txt
-
Number of patients = 413
-
Number of significantly arm-level cnvs = 76
-
Number of selected clinical features = 11
-
Exclude genes that fewer than K tumors have mutations, K = 3
For survival clinical features, the Kaplan-Meier survival curves of tumors with and without gene mutations were plotted and the statistical significance P values were estimated by logrank test (Bland and Altman 2004) using the 'survdiff' function in R
For continuous numerical clinical features, two-tailed Student's t test with unequal variance (Lehmann and Romano 2005) was applied to compare the clinical values between tumors with and without gene mutations using 't.test' function in R
For binary or multi-class clinical features (nominal or ordinal), two-tailed Fisher's exact tests (Fisher 1922) were used to estimate the P values using the 'fisher.test' function in R
For multi-class clinical features (nominal or ordinal), Chi-square tests (Greenwood and Nikulin 1996) were used to estimate the P values using the 'chisq.test' function in R
For multiple hypothesis correction, Q value is the False Discovery Rate (FDR) analogue of the P value (Benjamini and Hochberg 1995), defined as the minimum FDR at which the test may be called significant. We used the 'Benjamini and Hochberg' method of 'p.adjust' function in R to convert P values into Q values.
This is an experimental feature. The full results of the analysis summarized in this report can be downloaded from the TCGA Data Coordination Center.