This pipeline computes the correlation between significantly recurrent gene mutations and selected clinical features.
Testing the association between mutation status of 15 genes and 10 clinical features across 155 patients, 6 significant findings detected with Q value < 0.25.
-
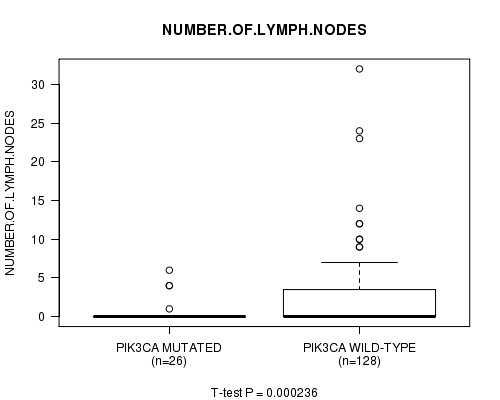
PIK3CA mutation correlated to 'NUMBER.OF.LYMPH.NODES'.
-
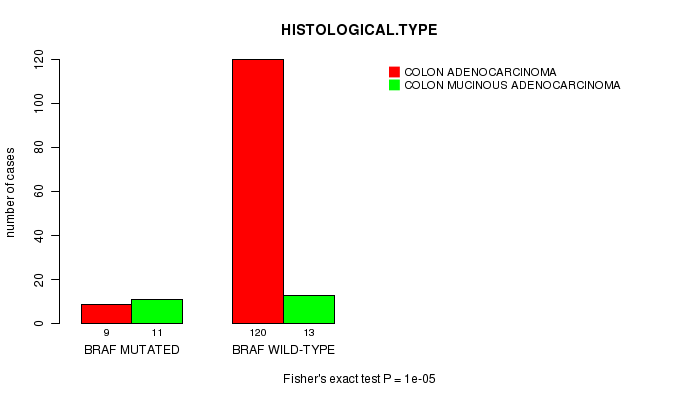
BRAF mutation correlated to 'HISTOLOGICAL.TYPE'.
-
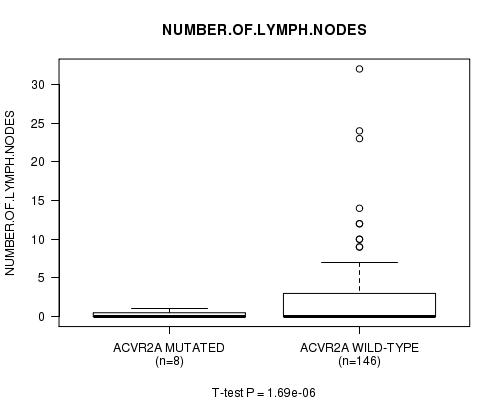
ACVR2A mutation correlated to 'NUMBER.OF.LYMPH.NODES'.
-
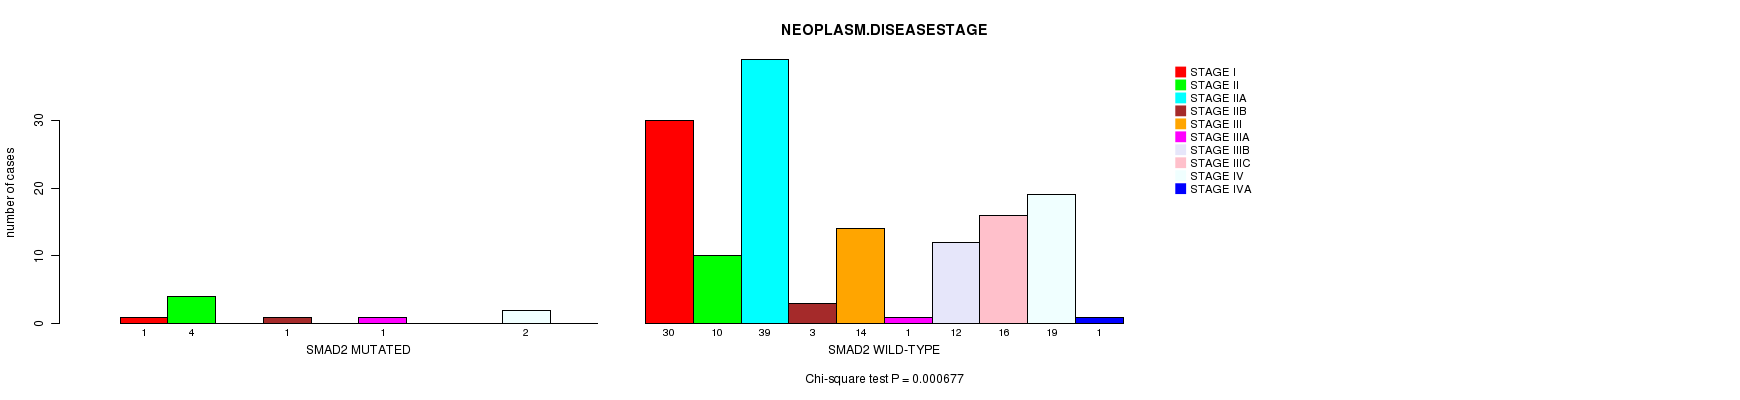
SMAD2 mutation correlated to 'NEOPLASM.DISEASESTAGE'.
-
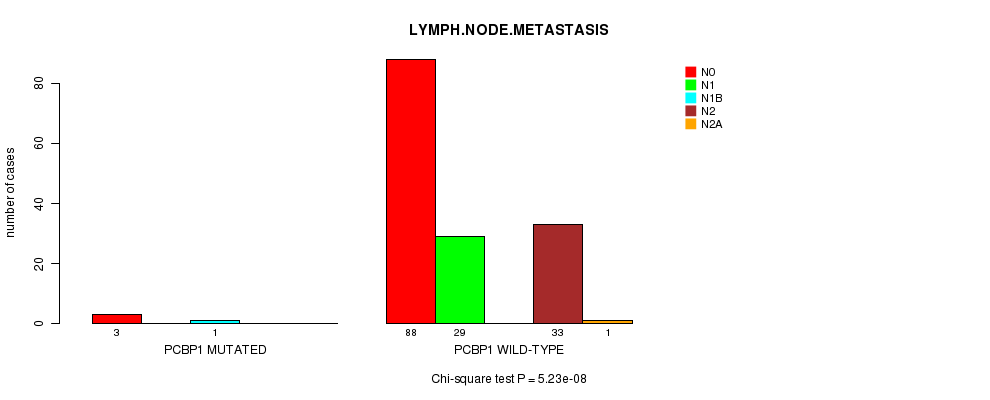
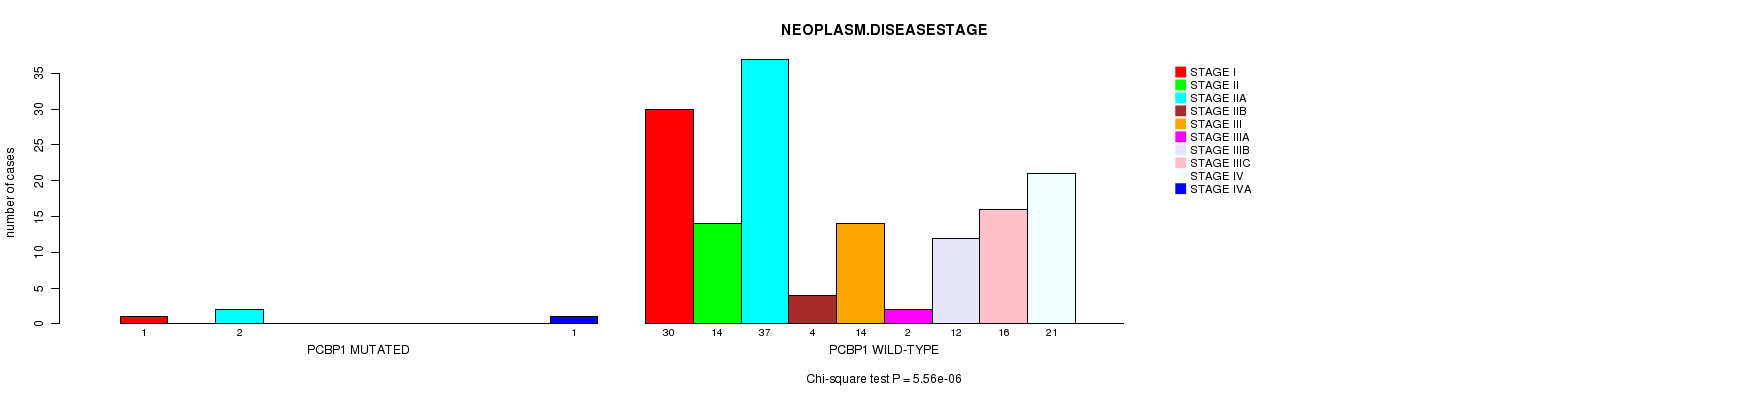
PCBP1 mutation correlated to 'LYMPH.NODE.METASTASIS' and 'NEOPLASM.DISEASESTAGE'.
Table 1. Get Full Table Overview of the association between mutation status of 15 genes and 10 clinical features. Shown in the table are P values (Q values). Thresholded by Q value < 0.25, 6 significant findings detected.
|
Clinical Features |
Time to Death |
AGE | GENDER |
HISTOLOGICAL TYPE |
DISTANT METASTASIS |
LYMPH NODE METASTASIS |
COMPLETENESS OF RESECTION |
NUMBER OF LYMPH NODES |
TUMOR STAGECODE |
NEOPLASM DISEASESTAGE |
||
| nMutated (%) | nWild-Type | logrank test | t-test | Fisher's exact test | Fisher's exact test | Fisher's exact test | Chi-square test | Fisher's exact test | t-test | t-test | Chi-square test | |
| PCBP1 | 4 (3%) | 151 |
0.00453 (0.557) |
1 (1.00) |
1 (1.00) |
0.0344 (1.00) |
5.23e-08 (6.85e-06) |
1 (1.00) |
0.135 (1.00) |
5.56e-06 (0.000717) |
||
| PIK3CA | 26 (17%) | 129 |
0.646 (1.00) |
0.198 (1.00) |
0.83 (1.00) |
0.134 (1.00) |
0.332 (1.00) |
0.0597 (1.00) |
0.445 (1.00) |
0.000236 (0.03) |
0.028 (1.00) |
|
| BRAF | 20 (13%) | 135 |
0.785 (1.00) |
0.0257 (1.00) |
0.0586 (1.00) |
1e-05 (0.00128) |
0.401 (1.00) |
0.931 (1.00) |
0.59 (1.00) |
0.822 (1.00) |
0.123 (1.00) |
|
| ACVR2A | 8 (5%) | 147 |
0.237 (1.00) |
0.703 (1.00) |
0.0337 (1.00) |
1 (1.00) |
1 (1.00) |
0.651 (1.00) |
1 (1.00) |
1.69e-06 (0.00022) |
0.506 (1.00) |
|
| SMAD2 | 10 (6%) | 145 |
0.58 (1.00) |
0.805 (1.00) |
0.327 (1.00) |
0.192 (1.00) |
0.398 (1.00) |
0.907 (1.00) |
0.404 (1.00) |
0.281 (1.00) |
0.000677 (0.0853) |
|
| APC | 103 (66%) | 52 |
0.28 (1.00) |
0.627 (1.00) |
0.042 (1.00) |
0.815 (1.00) |
0.165 (1.00) |
0.574 (1.00) |
0.0378 (1.00) |
0.561 (1.00) |
0.82 (1.00) |
|
| KRAS | 58 (37%) | 97 |
0.241 (1.00) |
0.00304 (0.38) |
0.246 (1.00) |
0.651 (1.00) |
0.317 (1.00) |
0.35 (1.00) |
0.315 (1.00) |
0.4 (1.00) |
0.694 (1.00) |
|
| TP53 | 75 (48%) | 80 |
0.688 (1.00) |
0.0728 (1.00) |
0.336 (1.00) |
0.00663 (0.809) |
0.56 (1.00) |
0.343 (1.00) |
0.803 (1.00) |
0.122 (1.00) |
0.171 (1.00) |
|
| FBXW7 | 29 (19%) | 126 |
0.869 (1.00) |
0.0362 (1.00) |
0.154 (1.00) |
0.00423 (0.524) |
0.0168 (1.00) |
0.827 (1.00) |
0.0795 (1.00) |
0.774 (1.00) |
0.0445 (1.00) |
|
| NRAS | 15 (10%) | 140 |
0.309 (1.00) |
0.168 (1.00) |
0.0269 (1.00) |
1 (1.00) |
0.493 (1.00) |
0.2 (1.00) |
0.276 (1.00) |
0.134 (1.00) |
0.468 (1.00) |
|
| SMAD4 | 18 (12%) | 137 |
0.635 (1.00) |
0.833 (1.00) |
0.625 (1.00) |
0.164 (1.00) |
1 (1.00) |
0.947 (1.00) |
0.772 (1.00) |
0.414 (1.00) |
0.95 (1.00) |
|
| FAM123B | 19 (12%) | 136 |
0.725 (1.00) |
0.527 (1.00) |
0.811 (1.00) |
0.503 (1.00) |
1 (1.00) |
0.562 (1.00) |
1 (1.00) |
0.655 (1.00) |
0.811 (1.00) |
|
| SOX9 | 9 (6%) | 146 |
0.28 (1.00) |
0.746 (1.00) |
1 (1.00) |
1 (1.00) |
0.971 (1.00) |
1 (1.00) |
0.334 (1.00) |
0.151 (1.00) |
||
| TNFRSF10C | 6 (4%) | 149 |
0.978 (1.00) |
0.681 (1.00) |
0.591 (1.00) |
0.0727 (1.00) |
0.526 (1.00) |
0.105 (1.00) |
0.178 (1.00) |
0.325 (1.00) |
||
| ACOT4 | 3 (2%) | 152 |
0.0294 (1.00) |
1 (1.00) |
0.403 (1.00) |
0.374 (1.00) |
0.931 (1.00) |
0.366 (1.00) |
0.647 (1.00) |
0.982 (1.00) |
P value = 0.000236 (t-test), Q value = 0.03
Table S1. Gene #2: 'PIK3CA MUTATION STATUS' versus Clinical Feature #8: 'NUMBER.OF.LYMPH.NODES'
| nPatients | Mean (Std.Dev) | |
|---|---|---|
| ALL | 154 | 2.2 (4.5) |
| PIK3CA MUTATED | 26 | 0.6 (1.6) |
| PIK3CA WILD-TYPE | 128 | 2.6 (4.8) |
Figure S1. Get High-res Image Gene #2: 'PIK3CA MUTATION STATUS' versus Clinical Feature #8: 'NUMBER.OF.LYMPH.NODES'
P value = 1e-05 (Fisher's exact test), Q value = 0.0013
Table S2. Gene #3: 'BRAF MUTATION STATUS' versus Clinical Feature #4: 'HISTOLOGICAL.TYPE'
| nPatients | COLON ADENOCARCINOMA | COLON MUCINOUS ADENOCARCINOMA |
|---|---|---|
| ALL | 129 | 24 |
| BRAF MUTATED | 9 | 11 |
| BRAF WILD-TYPE | 120 | 13 |
Figure S2. Get High-res Image Gene #3: 'BRAF MUTATION STATUS' versus Clinical Feature #4: 'HISTOLOGICAL.TYPE'
P value = 1.69e-06 (t-test), Q value = 0.00022
Table S3. Gene #11: 'ACVR2A MUTATION STATUS' versus Clinical Feature #8: 'NUMBER.OF.LYMPH.NODES'
| nPatients | Mean (Std.Dev) | |
|---|---|---|
| ALL | 154 | 2.2 (4.5) |
| ACVR2A MUTATED | 8 | 0.2 (0.5) |
| ACVR2A WILD-TYPE | 146 | 2.3 (4.6) |
Figure S3. Get High-res Image Gene #11: 'ACVR2A MUTATION STATUS' versus Clinical Feature #8: 'NUMBER.OF.LYMPH.NODES'
P value = 0.000677 (Chi-square test), Q value = 0.085
Table S4. Gene #13: 'SMAD2 MUTATION STATUS' versus Clinical Feature #10: 'NEOPLASM.DISEASESTAGE'
| nPatients | STAGE I | STAGE II | STAGE IIA | STAGE IIB | STAGE III | STAGE IIIA | STAGE IIIB | STAGE IIIC | STAGE IV | STAGE IVA |
|---|---|---|---|---|---|---|---|---|---|---|
| ALL | 31 | 14 | 39 | 4 | 14 | 2 | 12 | 16 | 21 | 1 |
| SMAD2 MUTATED | 1 | 4 | 0 | 1 | 0 | 1 | 0 | 0 | 2 | 0 |
| SMAD2 WILD-TYPE | 30 | 10 | 39 | 3 | 14 | 1 | 12 | 16 | 19 | 1 |
Figure S4. Get High-res Image Gene #13: 'SMAD2 MUTATION STATUS' versus Clinical Feature #10: 'NEOPLASM.DISEASESTAGE'
P value = 5.23e-08 (Chi-square test), Q value = 6.8e-06
Table S5. Gene #15: 'PCBP1 MUTATION STATUS' versus Clinical Feature #6: 'LYMPH.NODE.METASTASIS'
| nPatients | N0 | N1 | N1B | N2 | N2A |
|---|---|---|---|---|---|
| ALL | 91 | 29 | 1 | 33 | 1 |
| PCBP1 MUTATED | 3 | 0 | 1 | 0 | 0 |
| PCBP1 WILD-TYPE | 88 | 29 | 0 | 33 | 1 |
Figure S5. Get High-res Image Gene #15: 'PCBP1 MUTATION STATUS' versus Clinical Feature #6: 'LYMPH.NODE.METASTASIS'
P value = 5.56e-06 (Chi-square test), Q value = 0.00072
Table S6. Gene #15: 'PCBP1 MUTATION STATUS' versus Clinical Feature #10: 'NEOPLASM.DISEASESTAGE'
| nPatients | STAGE I | STAGE II | STAGE IIA | STAGE IIB | STAGE III | STAGE IIIA | STAGE IIIB | STAGE IIIC | STAGE IV | STAGE IVA |
|---|---|---|---|---|---|---|---|---|---|---|
| ALL | 31 | 14 | 39 | 4 | 14 | 2 | 12 | 16 | 21 | 1 |
| PCBP1 MUTATED | 1 | 0 | 2 | 0 | 0 | 0 | 0 | 0 | 0 | 1 |
| PCBP1 WILD-TYPE | 30 | 14 | 37 | 4 | 14 | 2 | 12 | 16 | 21 | 0 |
Figure S6. Get High-res Image Gene #15: 'PCBP1 MUTATION STATUS' versus Clinical Feature #10: 'NEOPLASM.DISEASESTAGE'
-
Mutation data file = COAD-TP.mutsig.cluster.txt
-
Clinical data file = COAD-TP.clin.merged.picked.txt
-
Number of patients = 155
-
Number of significantly mutated genes = 15
-
Number of selected clinical features = 10
-
Exclude genes that fewer than K tumors have mutations, K = 3
For survival clinical features, the Kaplan-Meier survival curves of tumors with and without gene mutations were plotted and the statistical significance P values were estimated by logrank test (Bland and Altman 2004) using the 'survdiff' function in R
For continuous numerical clinical features, two-tailed Student's t test with unequal variance (Lehmann and Romano 2005) was applied to compare the clinical values between tumors with and without gene mutations using 't.test' function in R
For binary or multi-class clinical features (nominal or ordinal), two-tailed Fisher's exact tests (Fisher 1922) were used to estimate the P values using the 'fisher.test' function in R
For multi-class clinical features (nominal or ordinal), Chi-square tests (Greenwood and Nikulin 1996) were used to estimate the P values using the 'chisq.test' function in R
For multiple hypothesis correction, Q value is the False Discovery Rate (FDR) analogue of the P value (Benjamini and Hochberg 1995), defined as the minimum FDR at which the test may be called significant. We used the 'Benjamini and Hochberg' method of 'p.adjust' function in R to convert P values into Q values.
This is an experimental feature. The full results of the analysis summarized in this report can be downloaded from the TCGA Data Coordination Center.