This pipeline uses various statistical tests to identify mRNAs whose expression levels correlated to selected clinical features.
Testing the association between 17814 genes and 9 clinical features across 153 samples, statistically thresholded by Q value < 0.05, 7 clinical features related to at least one genes.
-
1 gene correlated to 'AGE'.
-
ANAPC1
-
19 genes correlated to 'GENDER'.
-
DDX3Y , JARID1D , EIF1AY , RPS4Y1 , CYORF15A , ...
-
137 genes correlated to 'HISTOLOGICAL.TYPE'.
-
AGR2 , C20ORF24 , DYNLRB1 , RDHE2 , KCTD12 , ...
-
1 gene correlated to 'DISTANT.METASTASIS'.
-
KCNC2
-
3 genes correlated to 'LYMPH.NODE.METASTASIS'.
-
KCNC2 , LOC253970 , FZR1
-
49 genes correlated to 'COMPLETENESS.OF.RESECTION'.
-
CRH , CT45-6 , COX7B2 , CTAG2 , RP13-36C9.6 , ...
-
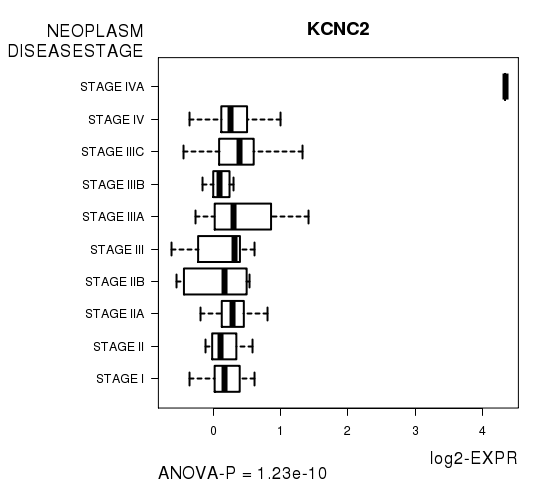
2 genes correlated to 'NEOPLASM.DISEASESTAGE'.
-
KCNC2 , ZNF234
-
No genes correlated to 'Time to Death', and 'NUMBER.OF.LYMPH.NODES'.
Complete statistical result table is provided in Supplement Table 1
Table 1. Get Full Table This table shows the clinical features, statistical methods used, and the number of genes that are significantly associated with each clinical feature at Q value < 0.05.
| Clinical feature | Statistical test | Significant genes | Associated with | Associated with | ||
|---|---|---|---|---|---|---|
| Time to Death | Cox regression test | N=0 | ||||
| AGE | Spearman correlation test | N=1 | older | N=0 | younger | N=1 |
| GENDER | t test | N=19 | male | N=13 | female | N=6 |
| HISTOLOGICAL TYPE | t test | N=137 | colon mucinous adenocarcinoma | N=64 | colon adenocarcinoma | N=73 |
| DISTANT METASTASIS | ANOVA test | N=1 | ||||
| LYMPH NODE METASTASIS | ANOVA test | N=3 | ||||
| COMPLETENESS OF RESECTION | ANOVA test | N=49 | ||||
| NUMBER OF LYMPH NODES | Spearman correlation test | N=0 | ||||
| NEOPLASM DISEASESTAGE | ANOVA test | N=2 |
Table S1. Basic characteristics of clinical feature: 'Time to Death'
| Time to Death | Duration (Months) | 0.9-52 (median=4) |
| censored | N = 64 | |
| death | N = 11 | |
| Significant markers | N = 0 |
Table S2. Basic characteristics of clinical feature: 'AGE'
| AGE | Mean (SD) | 70.77 (12) |
| Significant markers | N = 1 | |
| pos. correlated | 0 | |
| neg. correlated | 1 |
Table S3. Get Full Table List of one gene significantly correlated to 'AGE' by Spearman correlation test
| SpearmanCorr | corrP | Q | |
|---|---|---|---|
| ANAPC1 | -0.3901 | 6.195e-07 | 0.011 |
Figure S1. Get High-res Image As an example, this figure shows the association of ANAPC1 to 'AGE'. P value = 6.19e-07 with Spearman correlation analysis. The straight line presents the best linear regression.
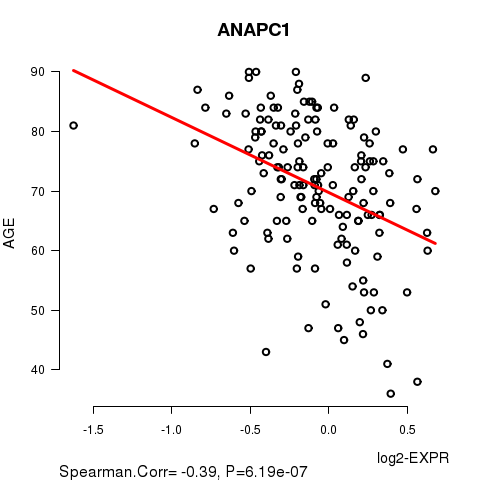
Table S4. Basic characteristics of clinical feature: 'GENDER'
| GENDER | Labels | N |
| FEMALE | 75 | |
| MALE | 78 | |
| Significant markers | N = 19 | |
| Higher in MALE | 13 | |
| Higher in FEMALE | 6 |
Table S5. Get Full Table List of top 10 genes differentially expressed by 'GENDER'
| T(pos if higher in 'MALE') | ttestP | Q | AUC | |
|---|---|---|---|---|
| DDX3Y | 22.4 | 1.044e-49 | 1.86e-45 | 0.9745 |
| JARID1D | 20.6 | 1.058e-45 | 1.89e-41 | 0.9779 |
| EIF1AY | 20.54 | 1.789e-45 | 3.19e-41 | 0.9646 |
| RPS4Y1 | 19.07 | 6.998e-42 | 1.25e-37 | 0.9491 |
| CYORF15A | 18.54 | 2.002e-40 | 3.57e-36 | 0.9554 |
| RPS4Y2 | 18.23 | 1.391e-39 | 2.48e-35 | 0.9622 |
| UTY | 17.98 | 2.603e-38 | 4.63e-34 | 0.9586 |
| CYORF15B | 15.65 | 6.536e-33 | 1.16e-28 | 0.9462 |
| ZFY | 15.45 | 6.937e-33 | 1.24e-28 | 0.9489 |
| USP9Y | 10.76 | 2.866e-20 | 5.1e-16 | 0.8926 |
Figure S2. Get High-res Image As an example, this figure shows the association of DDX3Y to 'GENDER'. P value = 1.04e-49 with T-test analysis.
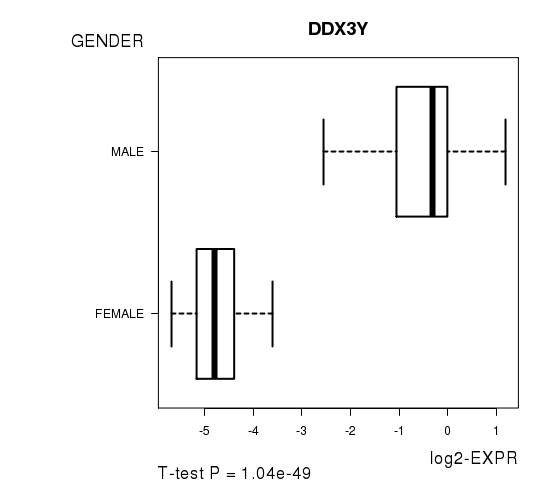
Table S6. Basic characteristics of clinical feature: 'HISTOLOGICAL.TYPE'
| HISTOLOGICAL.TYPE | Labels | N |
| COLON ADENOCARCINOMA | 127 | |
| COLON MUCINOUS ADENOCARCINOMA | 24 | |
| Significant markers | N = 137 | |
| Higher in COLON MUCINOUS ADENOCARCINOMA | 64 | |
| Higher in COLON ADENOCARCINOMA | 73 |
Table S7. Get Full Table List of top 10 genes differentially expressed by 'HISTOLOGICAL.TYPE'
| T(pos if higher in 'COLON MUCINOUS ADENOCARCINOMA') | ttestP | Q | AUC | |
|---|---|---|---|---|
| AGR2 | 8.44 | 3.37e-11 | 6e-07 | 0.8799 |
| C20ORF24 | -7.91 | 1.815e-10 | 3.23e-06 | 0.8425 |
| DYNLRB1 | -7.72 | 2.222e-10 | 3.96e-06 | 0.8323 |
| RDHE2 | 7.43 | 1.388e-09 | 2.47e-05 | 0.8179 |
| KCTD12 | 7.3 | 2.401e-09 | 4.28e-05 | 0.8356 |
| C10ORF65 | -7.03 | 2.472e-09 | 4.4e-05 | 0.7977 |
| PLA2G12B | -7.25 | 2.766e-09 | 4.93e-05 | 0.8186 |
| C20ORF4 | -7.1 | 4.685e-09 | 8.34e-05 | 0.8255 |
| ASXL1 | -7.07 | 8.628e-09 | 0.000154 | 0.8378 |
| HSPA4L | 6.57 | 1.125e-08 | 2e-04 | 0.7641 |
Figure S3. Get High-res Image As an example, this figure shows the association of AGR2 to 'HISTOLOGICAL.TYPE'. P value = 3.37e-11 with T-test analysis.
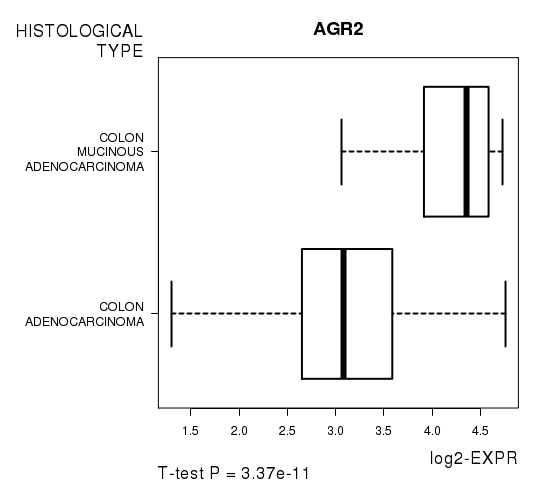
Table S8. Basic characteristics of clinical feature: 'DISTANT.METASTASIS'
| DISTANT.METASTASIS | Labels | N |
| M0 | 129 | |
| M1 | 21 | |
| M1A | 1 | |
| Significant markers | N = 1 |
Table S9. Get Full Table List of one gene differentially expressed by 'DISTANT.METASTASIS'
| ANOVA_P | Q | |
|---|---|---|
| KCNC2 | 4.483e-14 | 7.99e-10 |
Figure S4. Get High-res Image As an example, this figure shows the association of KCNC2 to 'DISTANT.METASTASIS'. P value = 4.48e-14 with ANOVA analysis.
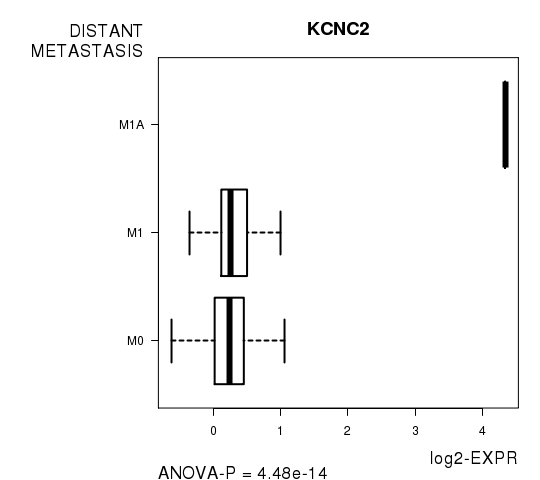
Table S10. Basic characteristics of clinical feature: 'LYMPH.NODE.METASTASIS'
| LYMPH.NODE.METASTASIS | Labels | N |
| N0 | 94 | |
| N1 | 27 | |
| N1B | 1 | |
| N2 | 30 | |
| N2A | 1 | |
| Significant markers | N = 3 |
Table S11. Get Full Table List of 3 genes differentially expressed by 'LYMPH.NODE.METASTASIS'
| ANOVA_P | Q | |
|---|---|---|
| KCNC2 | 8.677e-13 | 1.55e-08 |
| LOC253970 | 3.743e-07 | 0.00667 |
| FZR1 | 3.989e-07 | 0.00711 |
Figure S5. Get High-res Image As an example, this figure shows the association of KCNC2 to 'LYMPH.NODE.METASTASIS'. P value = 8.68e-13 with ANOVA analysis.
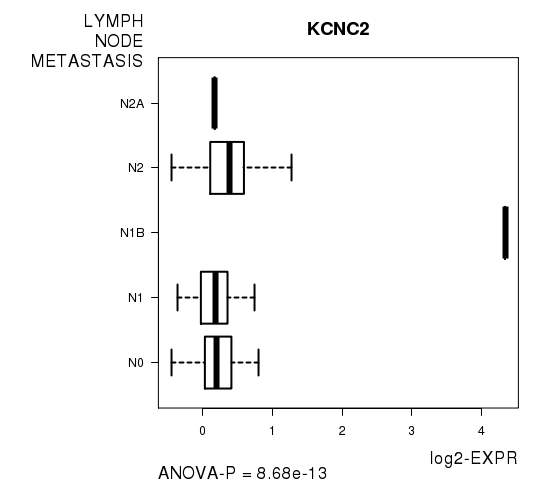
Table S12. Basic characteristics of clinical feature: 'COMPLETENESS.OF.RESECTION'
| COMPLETENESS.OF.RESECTION | Labels | N |
| R0 | 128 | |
| R1 | 1 | |
| R2 | 19 | |
| Significant markers | N = 49 |
Table S13. Get Full Table List of top 10 genes differentially expressed by 'COMPLETENESS.OF.RESECTION'
| ANOVA_P | Q | |
|---|---|---|
| CRH | 2.852e-26 | 5.08e-22 |
| CT45-6 | 3.18e-18 | 5.66e-14 |
| COX7B2 | 3.228e-18 | 5.75e-14 |
| CTAG2 | 6.913e-17 | 1.23e-12 |
| RP13-36C9.6 | 1.352e-15 | 2.41e-11 |
| PAGE4 | 8.012e-15 | 1.43e-10 |
| HOXC13 | 2.348e-14 | 4.18e-10 |
| LGALS14 | 1.18e-13 | 2.1e-09 |
| RARA | 2.993e-13 | 5.33e-09 |
| HOXC12 | 3.207e-13 | 5.71e-09 |
Figure S6. Get High-res Image As an example, this figure shows the association of CRH to 'COMPLETENESS.OF.RESECTION'. P value = 2.85e-26 with ANOVA analysis.

Table S14. Basic characteristics of clinical feature: 'NUMBER.OF.LYMPH.NODES'
| NUMBER.OF.LYMPH.NODES | Mean (SD) | 2.14 (4.5) |
| Significant markers | N = 0 |
Table S15. Basic characteristics of clinical feature: 'NEOPLASM.DISEASESTAGE'
| NEOPLASM.DISEASESTAGE | Labels | N |
| STAGE I | 29 | |
| STAGE II | 12 | |
| STAGE IIA | 45 | |
| STAGE IIB | 5 | |
| STAGE III | 8 | |
| STAGE IIIA | 3 | |
| STAGE IIIB | 12 | |
| STAGE IIIC | 16 | |
| STAGE IV | 21 | |
| STAGE IVA | 1 | |
| Significant markers | N = 2 |
Table S16. Get Full Table List of 2 genes differentially expressed by 'NEOPLASM.DISEASESTAGE'
| ANOVA_P | Q | |
|---|---|---|
| KCNC2 | 1.227e-10 | 2.19e-06 |
| ZNF234 | 1.69e-06 | 0.0301 |
Figure S7. Get High-res Image As an example, this figure shows the association of KCNC2 to 'NEOPLASM.DISEASESTAGE'. P value = 1.23e-10 with ANOVA analysis.
-
Expresson data file = COAD-TP.medianexp.txt
-
Clinical data file = COAD-TP.clin.merged.picked.txt
-
Number of patients = 153
-
Number of genes = 17814
-
Number of clinical features = 9
For survival clinical features, Wald's test in univariate Cox regression analysis with proportional hazards model (Andersen and Gill 1982) was used to estimate the P values using the 'coxph' function in R. Kaplan-Meier survival curves were plot using the four quartile subgroups of patients based on expression levels
For continuous numerical clinical features, Spearman's rank correlation coefficients (Spearman 1904) and two-tailed P values were estimated using 'cor.test' function in R
For two-class clinical features, two-tailed Student's t test with unequal variance (Lehmann and Romano 2005) was applied to compare the log2-expression levels between the two clinical classes using 't.test' function in R
For multi-class clinical features (ordinal or nominal), one-way analysis of variance (Howell 2002) was applied to compare the log2-expression levels between different clinical classes using 'anova' function in R
For multiple hypothesis correction, Q value is the False Discovery Rate (FDR) analogue of the P value (Benjamini and Hochberg 1995), defined as the minimum FDR at which the test may be called significant. We used the 'Benjamini and Hochberg' method of 'p.adjust' function in R to convert P values into Q values.
This is an experimental feature. The full results of the analysis summarized in this report can be downloaded from the TCGA Data Coordination Center.