This pipeline uses various statistical tests to identify mRNAs whose expression levels correlated to selected clinical features.
Testing the association between 18041 genes and 9 clinical features across 192 samples, statistically thresholded by Q value < 0.05, 7 clinical features related to at least one genes.
-
30 genes correlated to 'GENDER'.
-
XIST|7503 , ZFY|7544 , KDM5D|8284 , RPS4Y1|6192 , PRKY|5616 , ...
-
33 genes correlated to 'HISTOLOGICAL.TYPE'.
-
SETD7|80854 , OSR2|116039 , RNF125|54941 , PAFAH1B1|5048 , MAP3K6|9064 , ...
-
14 genes correlated to 'DISTANT.METASTASIS'.
-
RB1|5925 , TDRD12|91646 , S100Z|170591 , FAM171A1|221061 , ZNF845|91664 , ...
-
11 genes correlated to 'LYMPH.NODE.METASTASIS'.
-
TICAM2|353376 , AATF|26574 , MED24|9862 , PSMD3|5709 , PGAP3|93210 , ...
-
3 genes correlated to 'COMPLETENESS.OF.RESECTION'.
-
ZNHIT2|741 , OVCH1|341350 , PAIP2B|400961
-
2 genes correlated to 'NUMBER.OF.LYMPH.NODES'.
-
NIPAL4|348938 , RTN4RL1|146760
-
4 genes correlated to 'NEOPLASM.DISEASESTAGE'.
-
TDRD12|91646 , RB1|5925 , HAP1|9001 , PDE12|201626
-
No genes correlated to 'Time to Death', and 'AGE'.
Complete statistical result table is provided in Supplement Table 1
Table 1. Get Full Table This table shows the clinical features, statistical methods used, and the number of genes that are significantly associated with each clinical feature at Q value < 0.05.
| Clinical feature | Statistical test | Significant genes | Associated with | Associated with | ||
|---|---|---|---|---|---|---|
| Time to Death | Cox regression test | N=0 | ||||
| AGE | Spearman correlation test | N=0 | ||||
| GENDER | t test | N=30 | male | N=13 | female | N=17 |
| HISTOLOGICAL TYPE | t test | N=33 | colon mucinous adenocarcinoma | N=27 | colon adenocarcinoma | N=6 |
| DISTANT METASTASIS | ANOVA test | N=14 | ||||
| LYMPH NODE METASTASIS | ANOVA test | N=11 | ||||
| COMPLETENESS OF RESECTION | ANOVA test | N=3 | ||||
| NUMBER OF LYMPH NODES | Spearman correlation test | N=2 | higher number.of.lymph.nodes | N=2 | lower number.of.lymph.nodes | N=0 |
| NEOPLASM DISEASESTAGE | ANOVA test | N=4 |
Table S1. Basic characteristics of clinical feature: 'Time to Death'
| Time to Death | Duration (Months) | 0.1-129.1 (median=6.7) |
| censored | N = 151 | |
| death | N = 25 | |
| Significant markers | N = 0 |
Table S2. Basic characteristics of clinical feature: 'AGE'
| AGE | Mean (SD) | 65.4 (14) |
| Significant markers | N = 0 |
Table S3. Basic characteristics of clinical feature: 'GENDER'
| GENDER | Labels | N |
| FEMALE | 92 | |
| MALE | 100 | |
| Significant markers | N = 30 | |
| Higher in MALE | 13 | |
| Higher in FEMALE | 17 |
Table S4. Get Full Table List of top 10 genes differentially expressed by 'GENDER'
| T(pos if higher in 'MALE') | ttestP | Q | AUC | |
|---|---|---|---|---|
| XIST|7503 | -40.35 | 1.064e-87 | 1.92e-83 | 1 |
| ZFY|7544 | 42.8 | 8.828e-84 | 1.59e-79 | 0.9991 |
| KDM5D|8284 | 54.8 | 1.049e-76 | 1.89e-72 | 1 |
| RPS4Y1|6192 | 37.74 | 1.333e-74 | 2.4e-70 | 1 |
| PRKY|5616 | 27.6 | 3.198e-65 | 5.77e-61 | 0.9949 |
| NLGN4Y|22829 | 30.73 | 3.779e-50 | 6.81e-46 | 0.9991 |
| TMSB4Y|9087 | 27.11 | 1.541e-48 | 2.78e-44 | 0.9899 |
| DDX3Y|8653 | 43.18 | 5.888e-48 | 1.06e-43 | 1 |
| EIF1AY|9086 | 39.28 | 6.612e-48 | 1.19e-43 | 1 |
| USP9Y|8287 | 38.97 | 1.278e-44 | 2.3e-40 | 1 |
Figure S1. Get High-res Image As an example, this figure shows the association of XIST|7503 to 'GENDER'. P value = 1.06e-87 with T-test analysis.
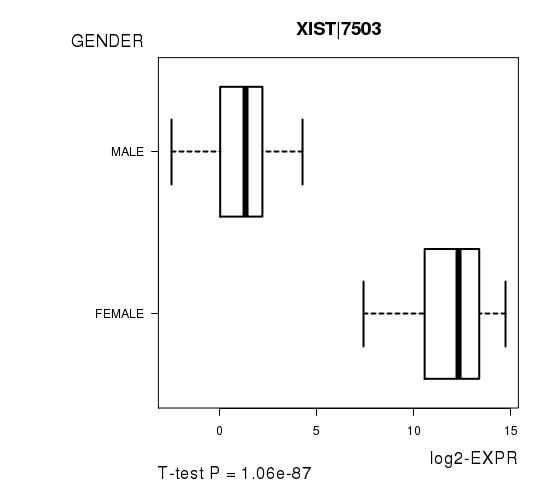
Table S5. Basic characteristics of clinical feature: 'HISTOLOGICAL.TYPE'
| HISTOLOGICAL.TYPE | Labels | N |
| COLON ADENOCARCINOMA | 168 | |
| COLON MUCINOUS ADENOCARCINOMA | 24 | |
| Significant markers | N = 33 | |
| Higher in COLON MUCINOUS ADENOCARCINOMA | 27 | |
| Higher in COLON ADENOCARCINOMA | 6 |
Table S6. Get Full Table List of top 10 genes differentially expressed by 'HISTOLOGICAL.TYPE'
| T(pos if higher in 'COLON MUCINOUS ADENOCARCINOMA') | ttestP | Q | AUC | |
|---|---|---|---|---|
| SETD7|80854 | 6.38 | 7.503e-08 | 0.00135 | 0.7748 |
| OSR2|116039 | 6.1 | 1.155e-07 | 0.00208 | 0.7393 |
| RNF125|54941 | 6.33 | 1.523e-07 | 0.00275 | 0.7847 |
| PAFAH1B1|5048 | 6.32 | 1.597e-07 | 0.00288 | 0.7914 |
| MAP3K6|9064 | 6.21 | 1.755e-07 | 0.00316 | 0.782 |
| KCTD15|79047 | 5.98 | 2.745e-07 | 0.00495 | 0.7579 |
| TOX|9760 | 6.28 | 2.935e-07 | 0.00529 | 0.8046 |
| CAMTA2|23125 | 5.92 | 3.084e-07 | 0.00556 | 0.7542 |
| MEIS2|4212 | 6.03 | 3.693e-07 | 0.00666 | 0.7862 |
| NAA20|51126 | -5.89 | 4.026e-07 | 0.00726 | 0.7527 |
Figure S2. Get High-res Image As an example, this figure shows the association of SETD7|80854 to 'HISTOLOGICAL.TYPE'. P value = 7.5e-08 with T-test analysis.

Table S7. Basic characteristics of clinical feature: 'DISTANT.METASTASIS'
| DISTANT.METASTASIS | Labels | N |
| M0 | 130 | |
| M1 | 19 | |
| M1A | 5 | |
| M1B | 1 | |
| MX | 33 | |
| Significant markers | N = 14 |
Table S8. Get Full Table List of top 10 genes differentially expressed by 'DISTANT.METASTASIS'
| ANOVA_P | Q | |
|---|---|---|
| RB1|5925 | 2.057e-11 | 3.71e-07 |
| TDRD12|91646 | 1.979e-09 | 3.57e-05 |
| S100Z|170591 | 3.505e-09 | 6.32e-05 |
| FAM171A1|221061 | 8.725e-09 | 0.000157 |
| ZNF845|91664 | 9.899e-09 | 0.000179 |
| ZNF675|171392 | 7.073e-08 | 0.00128 |
| ZNF558|148156 | 8.032e-08 | 0.00145 |
| CCDC122|160857 | 1.616e-07 | 0.00291 |
| TMEM185A|84548 | 2.397e-07 | 0.00432 |
| C13ORF31|144811 | 7.189e-07 | 0.013 |
Figure S3. Get High-res Image As an example, this figure shows the association of RB1|5925 to 'DISTANT.METASTASIS'. P value = 2.06e-11 with ANOVA analysis.
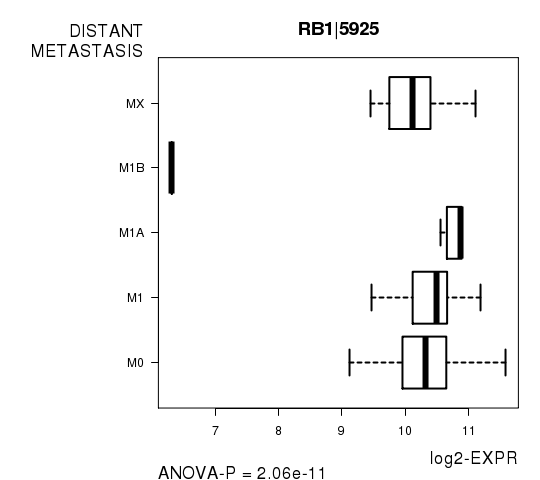
Table S9. Basic characteristics of clinical feature: 'LYMPH.NODE.METASTASIS'
| LYMPH.NODE.METASTASIS | Labels | N |
| N0 | 117 | |
| N1 | 27 | |
| N1A | 12 | |
| N1B | 7 | |
| N1C | 1 | |
| N2 | 16 | |
| N2A | 2 | |
| N2B | 9 | |
| NX | 1 | |
| Significant markers | N = 11 |
Table S10. Get Full Table List of top 10 genes differentially expressed by 'LYMPH.NODE.METASTASIS'
| ANOVA_P | Q | |
|---|---|---|
| TICAM2|353376 | 6.89e-14 | 1.24e-09 |
| AATF|26574 | 9.606e-11 | 1.73e-06 |
| MED24|9862 | 2.549e-09 | 4.6e-05 |
| PSMD3|5709 | 4.174e-09 | 7.53e-05 |
| PGAP3|93210 | 1.424e-08 | 0.000257 |
| POP4|10775 | 5.76e-08 | 0.00104 |
| STARD3|10948 | 1.205e-07 | 0.00217 |
| C17ORF37|84299 | 2.65e-07 | 0.00478 |
| PNMA5|114824 | 6.407e-07 | 0.0116 |
| ERBB2|2064 | 1.36e-06 | 0.0245 |
Figure S4. Get High-res Image As an example, this figure shows the association of TICAM2|353376 to 'LYMPH.NODE.METASTASIS'. P value = 6.89e-14 with ANOVA analysis.

Table S11. Basic characteristics of clinical feature: 'COMPLETENESS.OF.RESECTION'
| COMPLETENESS.OF.RESECTION | Labels | N |
| R0 | 116 | |
| R1 | 1 | |
| R2 | 2 | |
| RX | 22 | |
| Significant markers | N = 3 |
Table S12. Get Full Table List of 3 genes differentially expressed by 'COMPLETENESS.OF.RESECTION'
| ANOVA_P | Q | |
|---|---|---|
| ZNHIT2|741 | 2.712e-11 | 4.89e-07 |
| OVCH1|341350 | 3.741e-08 | 0.000675 |
| PAIP2B|400961 | 2.41e-07 | 0.00435 |
Figure S5. Get High-res Image As an example, this figure shows the association of ZNHIT2|741 to 'COMPLETENESS.OF.RESECTION'. P value = 2.71e-11 with ANOVA analysis.
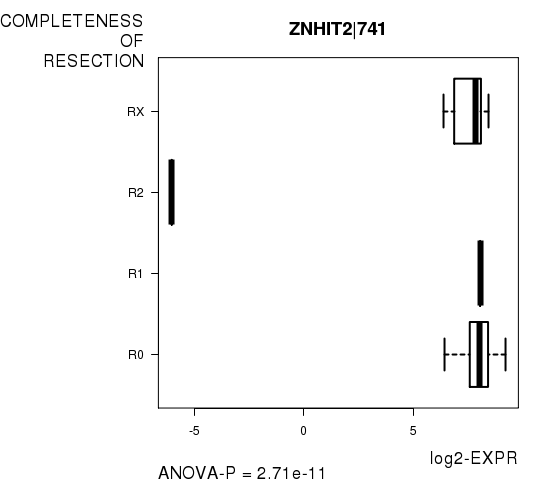
Table S13. Basic characteristics of clinical feature: 'NUMBER.OF.LYMPH.NODES'
| NUMBER.OF.LYMPH.NODES | Mean (SD) | 1.98 (4.9) |
| Significant markers | N = 2 | |
| pos. correlated | 2 | |
| neg. correlated | 0 |
Table S14. Get Full Table List of 2 genes significantly correlated to 'NUMBER.OF.LYMPH.NODES' by Spearman correlation test
| SpearmanCorr | corrP | Q | |
|---|---|---|---|
| NIPAL4|348938 | 0.3922 | 1.231e-07 | 0.00222 |
| RTN4RL1|146760 | 0.3636 | 1.831e-06 | 0.033 |
Figure S6. Get High-res Image As an example, this figure shows the association of NIPAL4|348938 to 'NUMBER.OF.LYMPH.NODES'. P value = 1.23e-07 with Spearman correlation analysis. The straight line presents the best linear regression.

Table S15. Basic characteristics of clinical feature: 'NEOPLASM.DISEASESTAGE'
| NEOPLASM.DISEASESTAGE | Labels | N |
| STAGE I | 32 | |
| STAGE II | 17 | |
| STAGE IIA | 55 | |
| STAGE IIB | 3 | |
| STAGE IIC | 1 | |
| STAGE III | 9 | |
| STAGE IIIA | 5 | |
| STAGE IIIB | 24 | |
| STAGE IIIC | 12 | |
| STAGE IV | 12 | |
| STAGE IVA | 13 | |
| STAGE IVB | 1 | |
| Significant markers | N = 4 |
Table S16. Get Full Table List of 4 genes differentially expressed by 'NEOPLASM.DISEASESTAGE'
| ANOVA_P | Q | |
|---|---|---|
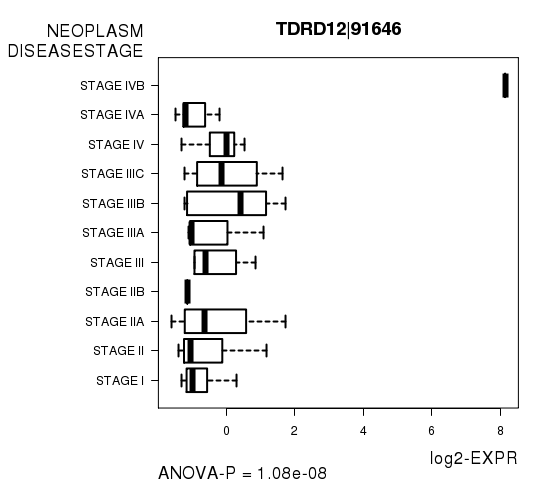
| TDRD12|91646 | 1.083e-08 | 0.000195 |
| RB1|5925 | 1.949e-08 | 0.000352 |
| HAP1|9001 | 8.102e-08 | 0.00146 |
| PDE12|201626 | 1.338e-06 | 0.0241 |
Figure S7. Get High-res Image As an example, this figure shows the association of TDRD12|91646 to 'NEOPLASM.DISEASESTAGE'. P value = 1.08e-08 with ANOVA analysis.
-
Expresson data file = COAD-TP.uncv2.mRNAseq_RSEM_normalized_log2.txt
-
Clinical data file = COAD-TP.clin.merged.picked.txt
-
Number of patients = 192
-
Number of genes = 18041
-
Number of clinical features = 9
For survival clinical features, Wald's test in univariate Cox regression analysis with proportional hazards model (Andersen and Gill 1982) was used to estimate the P values using the 'coxph' function in R. Kaplan-Meier survival curves were plot using the four quartile subgroups of patients based on expression levels
For continuous numerical clinical features, Spearman's rank correlation coefficients (Spearman 1904) and two-tailed P values were estimated using 'cor.test' function in R
For two-class clinical features, two-tailed Student's t test with unequal variance (Lehmann and Romano 2005) was applied to compare the log2-expression levels between the two clinical classes using 't.test' function in R
For multi-class clinical features (ordinal or nominal), one-way analysis of variance (Howell 2002) was applied to compare the log2-expression levels between different clinical classes using 'anova' function in R
For multiple hypothesis correction, Q value is the False Discovery Rate (FDR) analogue of the P value (Benjamini and Hochberg 1995), defined as the minimum FDR at which the test may be called significant. We used the 'Benjamini and Hochberg' method of 'p.adjust' function in R to convert P values into Q values.
This is an experimental feature. The full results of the analysis summarized in this report can be downloaded from the TCGA Data Coordination Center.