This pipeline computes the correlation between significantly recurrent gene mutations and selected clinical features.
Testing the association between mutation status of 21 genes and 11 clinical features across 224 patients, 6 significant findings detected with Q value < 0.25.
-
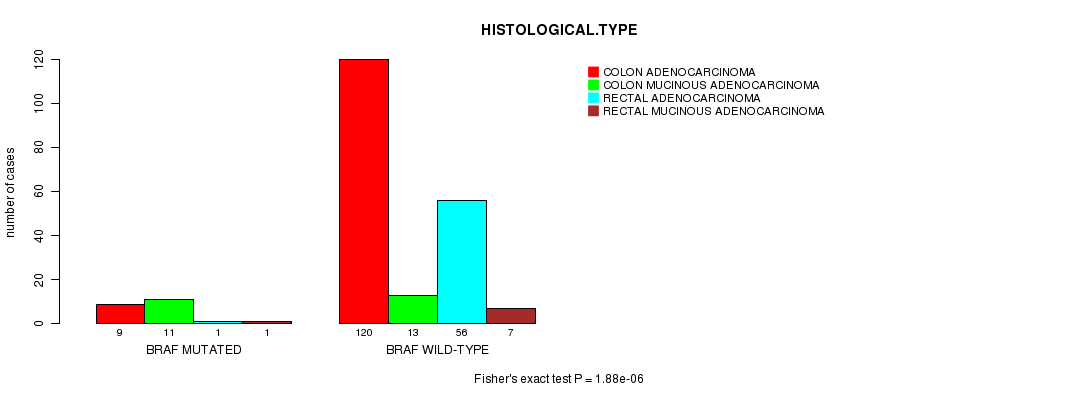
BRAF mutation correlated to 'HISTOLOGICAL.TYPE'.
-
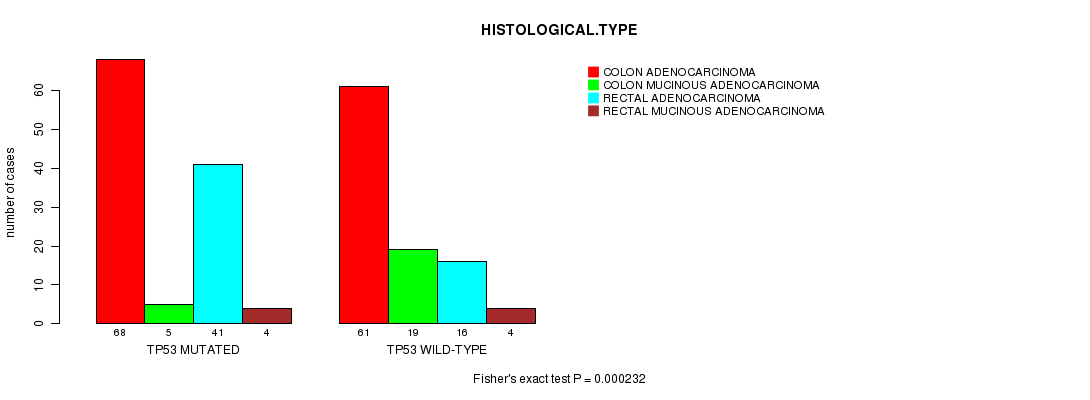
TP53 mutation correlated to 'HISTOLOGICAL.TYPE'.
-
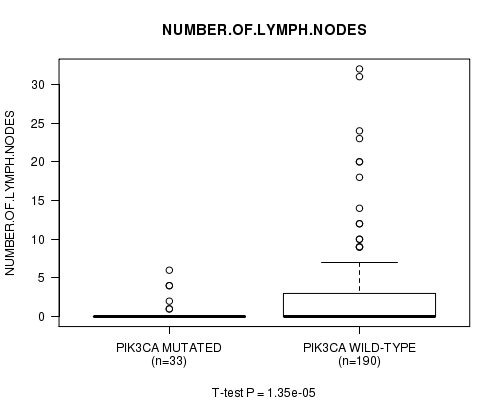
PIK3CA mutation correlated to 'NUMBER.OF.LYMPH.NODES'.
-
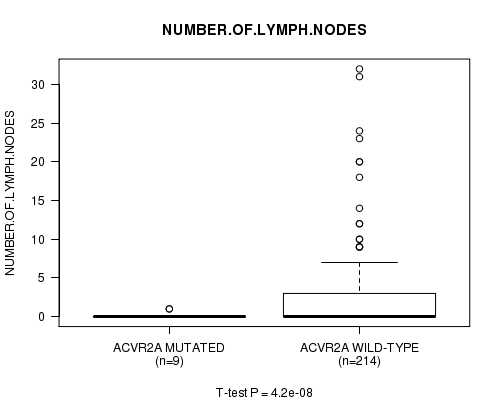
ACVR2A mutation correlated to 'NUMBER.OF.LYMPH.NODES'.
-
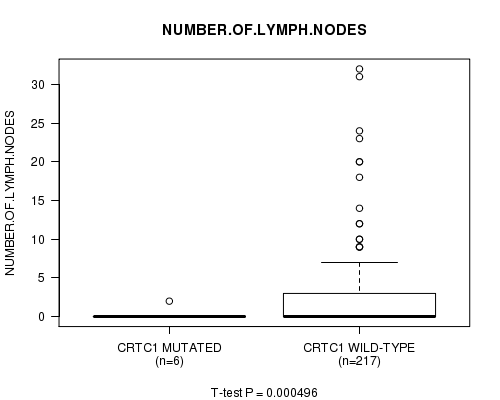
CRTC1 mutation correlated to 'NUMBER.OF.LYMPH.NODES'.
-
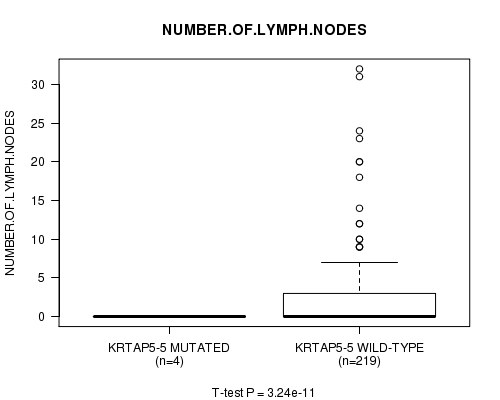
KRTAP5-5 mutation correlated to 'NUMBER.OF.LYMPH.NODES'.
Table 1. Get Full Table Overview of the association between mutation status of 21 genes and 11 clinical features. Shown in the table are P values (Q values). Thresholded by Q value < 0.25, 6 significant findings detected.
|
Clinical Features |
Time to Death |
AGE |
PRIMARY SITE OF DISEASE |
GENDER |
HISTOLOGICAL TYPE |
DISTANT METASTASIS |
LYMPH NODE METASTASIS |
COMPLETENESS OF RESECTION |
NUMBER OF LYMPH NODES |
TUMOR STAGECODE |
NEOPLASM DISEASESTAGE |
||
| nMutated (%) | nWild-Type | logrank test | t-test | Fisher's exact test | Fisher's exact test | Fisher's exact test | Fisher's exact test | Chi-square test | Fisher's exact test | t-test | t-test | Chi-square test | |
| BRAF | 22 (10%) | 202 |
0.885 (1.00) |
0.0839 (1.00) |
0.0261 (1.00) |
0.0702 (1.00) |
1.88e-06 (0.000383) |
0.394 (1.00) |
0.989 (1.00) |
0.611 (1.00) |
0.599 (1.00) |
0.148 (1.00) |
|
| TP53 | 120 (54%) | 104 |
0.486 (1.00) |
0.0605 (1.00) |
0.0135 (1.00) |
0.284 (1.00) |
0.000232 (0.0468) |
0.919 (1.00) |
0.471 (1.00) |
0.559 (1.00) |
0.447 (1.00) |
0.366 (1.00) |
|
| PIK3CA | 33 (15%) | 191 |
0.749 (1.00) |
0.0855 (1.00) |
0.227 (1.00) |
0.851 (1.00) |
0.0168 (1.00) |
0.133 (1.00) |
0.162 (1.00) |
0.303 (1.00) |
1.35e-05 (0.00274) |
0.0203 (1.00) |
|
| ACVR2A | 9 (4%) | 215 |
0.266 (1.00) |
0.454 (1.00) |
0.282 (1.00) |
0.0902 (1.00) |
0.716 (1.00) |
1 (1.00) |
0.765 (1.00) |
1 (1.00) |
4.2e-08 (8.62e-06) |
0.496 (1.00) |
|
| CRTC1 | 6 (3%) | 218 |
0.0365 (1.00) |
0.669 (1.00) |
0.429 (1.00) |
0.761 (1.00) |
0.609 (1.00) |
0.862 (1.00) |
1 (1.00) |
0.000496 (0.0996) |
0.264 (1.00) |
||
| KRTAP5-5 | 4 (2%) | 220 |
0.882 (1.00) |
0.588 (1.00) |
1 (1.00) |
0.303 (1.00) |
1 (1.00) |
0.741 (1.00) |
1 (1.00) |
3.24e-11 (6.68e-09) |
0.0267 (1.00) |
||
| APC | 160 (71%) | 64 |
0.351 (1.00) |
0.404 (1.00) |
0.0159 (1.00) |
0.0753 (1.00) |
0.108 (1.00) |
0.66 (1.00) |
0.627 (1.00) |
0.191 (1.00) |
0.938 (1.00) |
0.949 (1.00) |
|
| FBXW7 | 38 (17%) | 186 |
0.729 (1.00) |
0.0555 (1.00) |
0.341 (1.00) |
0.374 (1.00) |
0.0159 (1.00) |
0.00407 (0.809) |
0.952 (1.00) |
0.0342 (1.00) |
0.845 (1.00) |
0.0568 (1.00) |
|
| NRAS | 20 (9%) | 204 |
0.0728 (1.00) |
0.0434 (1.00) |
0.8 (1.00) |
0.0365 (1.00) |
1 (1.00) |
0.541 (1.00) |
0.00667 (1.00) |
0.469 (1.00) |
0.0262 (1.00) |
0.404 (1.00) |
|
| KRAS | 96 (43%) | 128 |
0.0211 (1.00) |
0.113 (1.00) |
0.027 (1.00) |
0.685 (1.00) |
0.0731 (1.00) |
0.171 (1.00) |
0.4 (1.00) |
0.0373 (1.00) |
0.204 (1.00) |
0.741 (1.00) |
|
| SMAD4 | 26 (12%) | 198 |
0.784 (1.00) |
0.987 (1.00) |
1 (1.00) |
0.837 (1.00) |
0.00657 (1.00) |
0.795 (1.00) |
0.995 (1.00) |
0.83 (1.00) |
0.326 (1.00) |
0.97 (1.00) |
|
| FAM123B | 25 (11%) | 199 |
0.641 (1.00) |
0.863 (1.00) |
0.5 (1.00) |
1 (1.00) |
0.736 (1.00) |
0.781 (1.00) |
0.755 (1.00) |
0.645 (1.00) |
0.492 (1.00) |
0.89 (1.00) |
|
| SMAD2 | 15 (7%) | 209 |
0.863 (1.00) |
0.713 (1.00) |
0.779 (1.00) |
0.293 (1.00) |
0.465 (1.00) |
1 (1.00) |
0.7 (1.00) |
0.746 (1.00) |
0.0351 (1.00) |
0.00252 (0.504) |
|
| TCF7L2 | 18 (8%) | 206 |
0.28 (1.00) |
0.404 (1.00) |
0.785 (1.00) |
0.624 (1.00) |
0.439 (1.00) |
0.736 (1.00) |
0.0281 (1.00) |
0.573 (1.00) |
0.112 (1.00) |
0.862 (1.00) |
|
| SOX9 | 10 (4%) | 214 |
0.575 (1.00) |
0.266 (1.00) |
0.29 (1.00) |
0.525 (1.00) |
0.58 (1.00) |
1 (1.00) |
0.98 (1.00) |
1 (1.00) |
0.208 (1.00) |
0.321 (1.00) |
|
| ELF3 | 6 (3%) | 218 |
0.698 (1.00) |
0.202 (1.00) |
0.374 (1.00) |
0.685 (1.00) |
0.84 (1.00) |
1 (1.00) |
0.999 (1.00) |
0.593 (1.00) |
0.624 (1.00) |
0.974 (1.00) |
|
| TNFRSF10C | 6 (3%) | 218 |
0.838 (1.00) |
0.181 (1.00) |
0.685 (1.00) |
0.394 (1.00) |
0.0634 (1.00) |
0.614 (1.00) |
0.0793 (1.00) |
0.183 (1.00) |
0.331 (1.00) |
||
| KIAA1804 | 15 (7%) | 209 |
0.279 (1.00) |
0.799 (1.00) |
0.0177 (1.00) |
0.425 (1.00) |
0.0245 (1.00) |
1 (1.00) |
0.803 (1.00) |
0.746 (1.00) |
0.0135 (1.00) |
0.846 (1.00) |
|
| ACOT4 | 3 (1%) | 221 |
0.0265 (1.00) |
0.555 (1.00) |
1 (1.00) |
0.398 (1.00) |
0.375 (1.00) |
0.97 (1.00) |
0.36 (1.00) |
0.651 (1.00) |
0.986 (1.00) |
||
| PTEN | 7 (3%) | 217 |
0.535 (1.00) |
0.0301 (1.00) |
0.44 (1.00) |
0.712 (1.00) |
0.26 (1.00) |
1 (1.00) |
0.994 (1.00) |
0.593 (1.00) |
0.142 (1.00) |
0.242 (1.00) |
|
| MYO1B | 13 (6%) | 211 |
0.354 (1.00) |
0.632 (1.00) |
1 (1.00) |
0.777 (1.00) |
0.364 (1.00) |
0.267 (1.00) |
0.861 (1.00) |
0.458 (1.00) |
0.126 (1.00) |
0.258 (1.00) |
P value = 1.88e-06 (Fisher's exact test), Q value = 0.00038
Table S1. Gene #4: 'BRAF MUTATION STATUS' versus Clinical Feature #5: 'HISTOLOGICAL.TYPE'
| nPatients | COLON ADENOCARCINOMA | COLON MUCINOUS ADENOCARCINOMA | RECTAL ADENOCARCINOMA | RECTAL MUCINOUS ADENOCARCINOMA |
|---|---|---|---|---|
| ALL | 129 | 24 | 57 | 8 |
| BRAF MUTATED | 9 | 11 | 1 | 1 |
| BRAF WILD-TYPE | 120 | 13 | 56 | 7 |
Figure S1. Get High-res Image Gene #4: 'BRAF MUTATION STATUS' versus Clinical Feature #5: 'HISTOLOGICAL.TYPE'
P value = 0.000232 (Fisher's exact test), Q value = 0.047
Table S2. Gene #6: 'TP53 MUTATION STATUS' versus Clinical Feature #5: 'HISTOLOGICAL.TYPE'
| nPatients | COLON ADENOCARCINOMA | COLON MUCINOUS ADENOCARCINOMA | RECTAL ADENOCARCINOMA | RECTAL MUCINOUS ADENOCARCINOMA |
|---|---|---|---|---|
| ALL | 129 | 24 | 57 | 8 |
| TP53 MUTATED | 68 | 5 | 41 | 4 |
| TP53 WILD-TYPE | 61 | 19 | 16 | 4 |
Figure S2. Get High-res Image Gene #6: 'TP53 MUTATION STATUS' versus Clinical Feature #5: 'HISTOLOGICAL.TYPE'
P value = 1.35e-05 (t-test), Q value = 0.0027
Table S3. Gene #9: 'PIK3CA MUTATION STATUS' versus Clinical Feature #9: 'NUMBER.OF.LYMPH.NODES'
| nPatients | Mean (Std.Dev) | |
|---|---|---|
| ALL | 223 | 2.2 (4.8) |
| PIK3CA MUTATED | 33 | 0.5 (1.4) |
| PIK3CA WILD-TYPE | 190 | 2.5 (5.1) |
Figure S3. Get High-res Image Gene #9: 'PIK3CA MUTATION STATUS' versus Clinical Feature #9: 'NUMBER.OF.LYMPH.NODES'
P value = 4.2e-08 (t-test), Q value = 8.6e-06
Table S4. Gene #12: 'ACVR2A MUTATION STATUS' versus Clinical Feature #9: 'NUMBER.OF.LYMPH.NODES'
| nPatients | Mean (Std.Dev) | |
|---|---|---|
| ALL | 223 | 2.2 (4.8) |
| ACVR2A MUTATED | 9 | 0.2 (0.4) |
| ACVR2A WILD-TYPE | 214 | 2.3 (4.9) |
Figure S4. Get High-res Image Gene #12: 'ACVR2A MUTATION STATUS' versus Clinical Feature #9: 'NUMBER.OF.LYMPH.NODES'
P value = 0.000496 (t-test), Q value = 0.1
Table S5. Gene #15: 'CRTC1 MUTATION STATUS' versus Clinical Feature #9: 'NUMBER.OF.LYMPH.NODES'
| nPatients | Mean (Std.Dev) | |
|---|---|---|
| ALL | 223 | 2.2 (4.8) |
| CRTC1 MUTATED | 6 | 0.3 (0.8) |
| CRTC1 WILD-TYPE | 217 | 2.3 (4.9) |
Figure S5. Get High-res Image Gene #15: 'CRTC1 MUTATION STATUS' versus Clinical Feature #9: 'NUMBER.OF.LYMPH.NODES'
P value = 3.24e-11 (t-test), Q value = 6.7e-09
Table S6. Gene #17: 'KRTAP5-5 MUTATION STATUS' versus Clinical Feature #9: 'NUMBER.OF.LYMPH.NODES'
| nPatients | Mean (Std.Dev) | |
|---|---|---|
| ALL | 223 | 2.2 (4.8) |
| KRTAP5-5 MUTATED | 4 | 0.0 (0.0) |
| KRTAP5-5 WILD-TYPE | 219 | 2.3 (4.8) |
Figure S6. Get High-res Image Gene #17: 'KRTAP5-5 MUTATION STATUS' versus Clinical Feature #9: 'NUMBER.OF.LYMPH.NODES'
-
Mutation data file = COADREAD-TP.mutsig.cluster.txt
-
Clinical data file = COADREAD-TP.clin.merged.picked.txt
-
Number of patients = 224
-
Number of significantly mutated genes = 21
-
Number of selected clinical features = 11
-
Exclude genes that fewer than K tumors have mutations, K = 3
For survival clinical features, the Kaplan-Meier survival curves of tumors with and without gene mutations were plotted and the statistical significance P values were estimated by logrank test (Bland and Altman 2004) using the 'survdiff' function in R
For continuous numerical clinical features, two-tailed Student's t test with unequal variance (Lehmann and Romano 2005) was applied to compare the clinical values between tumors with and without gene mutations using 't.test' function in R
For binary or multi-class clinical features (nominal or ordinal), two-tailed Fisher's exact tests (Fisher 1922) were used to estimate the P values using the 'fisher.test' function in R
For multi-class clinical features (nominal or ordinal), Chi-square tests (Greenwood and Nikulin 1996) were used to estimate the P values using the 'chisq.test' function in R
For multiple hypothesis correction, Q value is the False Discovery Rate (FDR) analogue of the P value (Benjamini and Hochberg 1995), defined as the minimum FDR at which the test may be called significant. We used the 'Benjamini and Hochberg' method of 'p.adjust' function in R to convert P values into Q values.
This is an experimental feature. The full results of the analysis summarized in this report can be downloaded from the TCGA Data Coordination Center.