This report serves to describe the mutational landscape and properties of a given individual set, as well as rank genes and genesets according to mutational significance. MutSig v1.5 was used to generate the results found in this report.
-
Working with individual set: COADREAD-TP
-
Number of patients in set: 224
The input for this pipeline is a set of individuals with the following files associated for each:
-
An annotated .maf file describing the mutations called for the respective individual, and their properties.
-
A .wig file that contains information about the coverage of the sample.
-
MAF used for this analysis:COADREAD-TP.final_analysis_set.maf
-
Significantly mutated genes (q ≤ 0.1): 227
-
Mutations seen in COSMIC: 739
-
Significantly mutated genes in COSMIC territory: 29
-
Genes with clustered mutations (≤ 3 aa apart): 1746
-
Significantly mutated genesets: 146
-
Significantly mutated genesets: (excluding sig. mutated genes):0
-
Read 140 MAFs of type "Broad"
-
Read 88 MAFs of type "Baylor-SOLiD"
-
Total number of mutations in input MAFs: 91973
-
After removing 1369 invalidated mutations: 90604
-
After removing 1176 noncoding mutations: 89428
-
After collapsing adjacent/redundant mutations: 82149
-
Number of mutations before filtering: 82149
-
After removing 855 mutations outside gene set: 81294
-
After removing 343 mutations outside category set: 80951
-
After removing 11 "impossible" mutations in
-
gene-patient-category bins of zero coverage: 79742
Table 1. Get Full Table Table representing breakdown of mutations by type.
| type | count |
|---|---|
| De_novo_Start_InFrame | 20 |
| De_novo_Start_OutOfFrame | 156 |
| Frame_Shift_Del | 1289 |
| Frame_Shift_Ins | 810 |
| In_Frame_Del | 166 |
| In_Frame_Ins | 26 |
| Missense_Mutation | 54081 |
| Nonsense_Mutation | 5053 |
| Nonstop_Mutation | 36 |
| Read-through | 10 |
| Silent | 19116 |
| Splice_Site | 186 |
| Translation_Start_Site | 2 |
| Total | 80951 |
Table 2. Get Full Table A breakdown of mutation rates per category discovered for this individual set.
| category | n | N | rate | rate_per_mb | relative_rate |
|---|---|---|---|---|---|
| *CpG->T | 20381 | 335477044 | 0.000061 | 61 | 6 |
| *Cp(A/C/T)->mut | 21021 | 2775898083 | 7.6e-06 | 7.6 | 0.75 |
| A->mut | 12112 | 3017613932 | 4e-06 | 4 | 0.4 |
| *CpG->(G/A) | 562 | 335477044 | 1.7e-06 | 1.7 | 0.17 |
| indel+null | 7447 | 6128989199 | 1.2e-06 | 1.2 | 0.12 |
| double_null | 304 | 6128989199 | 5e-08 | 0.05 | 0.0049 |
| Total | 61827 | 6128989199 | 1e-05 | 10 | 1 |
The x axis represents the samples. The y axis represents the exons, one row per exon, and they are sorted by average coverage across samples. For exons with exactly the same average coverage, they are sorted next by the %GC of the exon. (The secondary sort is especially useful for the zero-coverage exons at the bottom).
Figure 1.
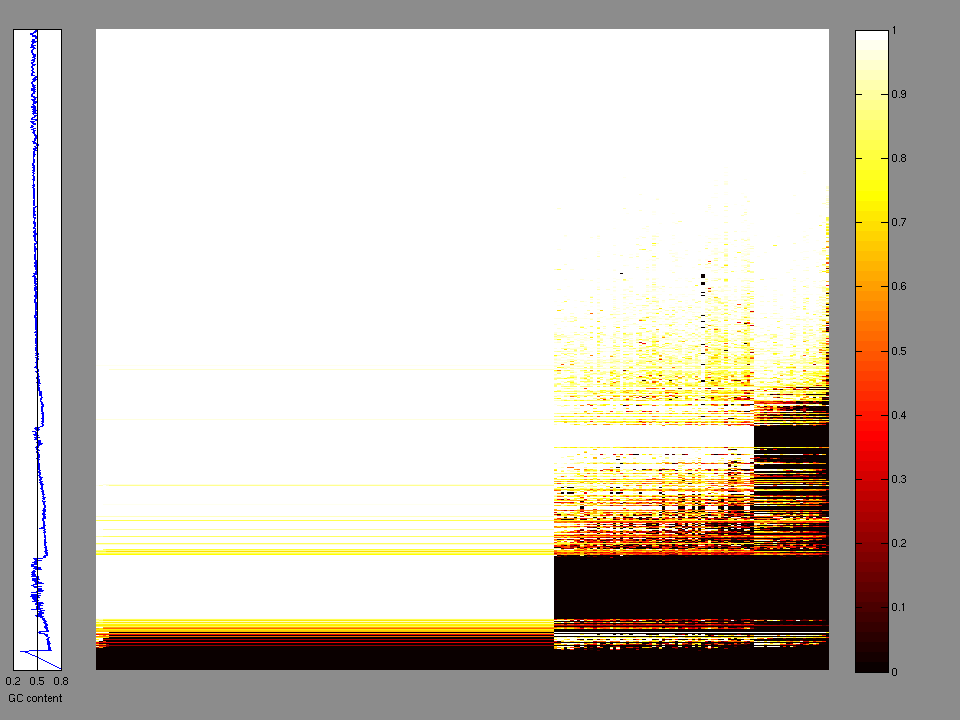
Figure 2. Patients counts and rates file used to generate this plot: COADREAD-TP.patients.counts_and_rates.txt
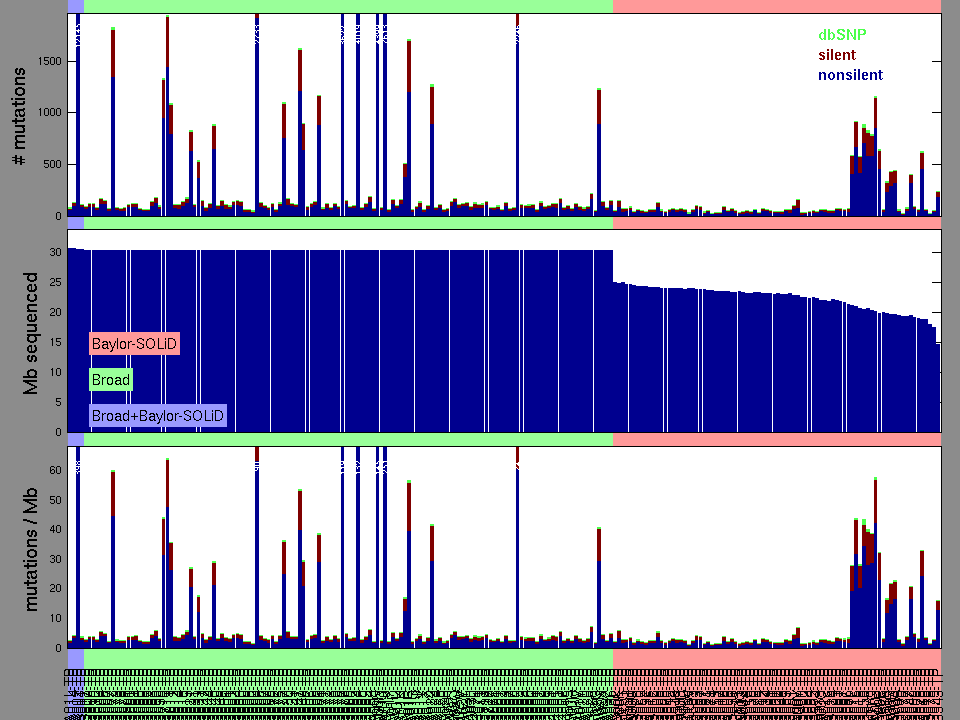
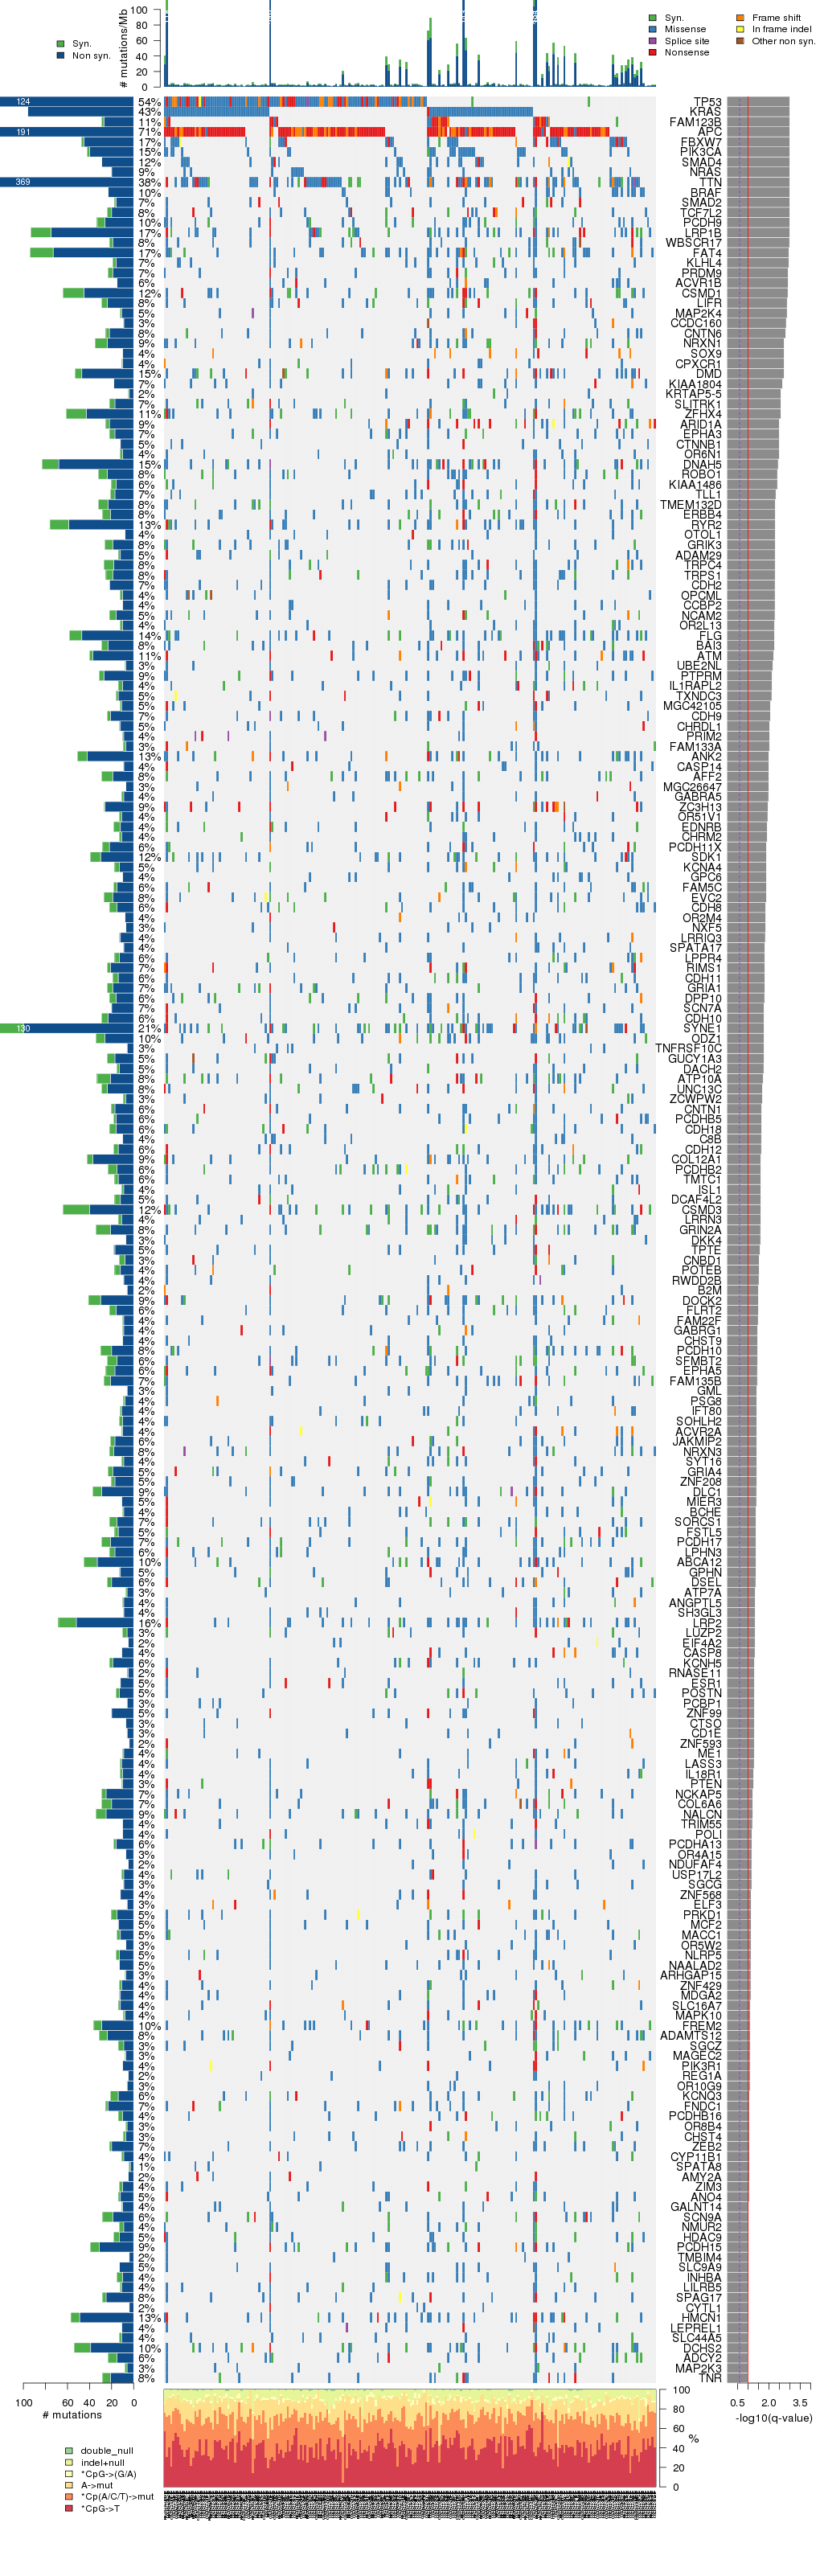
Figure 3. Get High-res Image The matrix in the center of the figure represents individual mutations in patient samples, color-coded by type of mutation, for the significantly mutated genes. The rate of synonymous and non-synonymous mutations is displayed at the top of the matrix. The barplot on the left of the matrix shows the number of mutations in each gene. The percentages represent the fraction of tumors with at least one mutation in the specified gene. The barplot to the right of the matrix displays the q-values for the most significantly mutated genes. The purple boxplots below the matrix (only displayed if required columns are present in the provided MAF) represent the distributions of allelic fractions observed in each sample. The plot at the bottom represents the base substitution distribution of individual samples, using the same categories that were used to calculate significance.
Column Descriptions:
-
N = number of sequenced bases in this gene across the individual set
-
n = number of (nonsilent) mutations in this gene across the individual set
-
npat = number of patients (individuals) with at least one nonsilent mutation
-
nsite = number of unique sites having a non-silent mutation
-
nsil = number of silent mutations in this gene across the individual set
-
n1 = number of nonsilent mutations of type: *CpG->T
-
n2 = number of nonsilent mutations of type: *Cp(A/C/T)->mut
-
n3 = number of nonsilent mutations of type: A->mut
-
n4 = number of nonsilent mutations of type: *CpG->(G/A)
-
n5 = number of nonsilent mutations of type: indel+null
-
n6 = number of nonsilent mutations of type: double_null
-
p = p-value (overall)
-
q = q-value, False Discovery Rate (Benjamini-Hochberg procedure)
Table 3. Get Full Table A Ranked List of Significantly Mutated Genes. Number of significant genes found: 227. Number of genes displayed: 35. Click on a gene name to display its stick figure depicting the distribution of mutations and mutation types across the chosen gene (this feature may not be available for all significant genes).
| rank | gene | description | N | n | npat | nsite | nsil | n1 | n2 | n3 | n4 | n5 | n6 | p | q |
|---|---|---|---|---|---|---|---|---|---|---|---|---|---|---|---|
| 1 | TP53 | tumor protein p53 | 267736 | 122 | 120 | 69 | 2 | 48 | 22 | 12 | 2 | 38 | 0 | <1.00e-15 | <1.69e-11 |
| 2 | KRAS | v-Ki-ras2 Kirsten rat sarcoma viral oncogene homolog | 158010 | 96 | 96 | 11 | 0 | 0 | 91 | 4 | 0 | 1 | 0 | 2.11e-15 | 1.69e-11 |
| 3 | FAM123B | family with sequence similarity 123B | 641973 | 27 | 25 | 24 | 2 | 1 | 3 | 4 | 0 | 19 | 0 | 3.66e-15 | 1.69e-11 |
| 4 | APC | adenomatous polyposis coli | 1891000 | 187 | 160 | 128 | 4 | 6 | 15 | 11 | 0 | 103 | 52 | 3.77e-15 | 1.69e-11 |
| 5 | FBXW7 | F-box and WD repeat domain containing 7 | 577918 | 45 | 38 | 28 | 2 | 23 | 6 | 5 | 2 | 9 | 0 | 5.88e-15 | 1.79e-11 |
| 6 | PIK3CA | phosphoinositide-3-kinase, catalytic, alpha polypeptide | 618889 | 40 | 33 | 21 | 2 | 6 | 20 | 14 | 0 | 0 | 0 | 6.99e-15 | 1.79e-11 |
| 7 | SMAD4 | SMAD family member 4 | 377497 | 29 | 26 | 22 | 0 | 10 | 6 | 9 | 0 | 3 | 1 | 7.55e-15 | 1.79e-11 |
| 8 | NRAS | neuroblastoma RAS viral (v-ras) oncogene homolog | 131263 | 20 | 20 | 8 | 0 | 2 | 14 | 4 | 0 | 0 | 0 | 7.99e-15 | 1.79e-11 |
| 9 | TTN | titin | 16863591 | 290 | 85 | 286 | 79 | 82 | 114 | 72 | 2 | 13 | 7 | 2.11e-13 | 4.20e-10 |
| 10 | BRAF | v-raf murine sarcoma viral oncogene homolog B1 | 493213 | 23 | 22 | 4 | 0 | 0 | 0 | 23 | 0 | 0 | 0 | 8.54e-12 | 1.53e-08 |
| 11 | SMAD2 | SMAD family member 2 | 322425 | 16 | 15 | 12 | 1 | 3 | 5 | 3 | 0 | 5 | 0 | 4.63e-11 | 7.55e-08 |
| 12 | TCF7L2 | transcription factor 7-like 2 (T-cell specific, HMG-box) | 400503 | 20 | 18 | 18 | 4 | 5 | 5 | 3 | 0 | 7 | 0 | 9.40e-11 | 1.41e-07 |
| 13 | PCDH9 | protocadherin 9 | 823363 | 26 | 22 | 26 | 7 | 3 | 11 | 11 | 0 | 1 | 0 | 4.66e-09 | 6.44e-06 |
| 14 | LRP1B | low density lipoprotein-related protein 1B (deleted in tumors) | 3162768 | 75 | 39 | 73 | 18 | 11 | 34 | 22 | 0 | 5 | 3 | 5.27e-09 | 6.76e-06 |
| 15 | WBSCR17 | Williams-Beuren syndrome chromosome region 17 | 400400 | 19 | 19 | 18 | 3 | 10 | 5 | 1 | 0 | 3 | 0 | 1.30e-08 | 1.56e-05 |
| 16 | FAT4 | FAT tumor suppressor homolog 4 (Drosophila) | 3144726 | 73 | 39 | 73 | 21 | 19 | 30 | 19 | 1 | 4 | 0 | 3.76e-08 | 4.22e-05 |
| 17 | KLHL4 | kelch-like 4 (Drosophila) | 494271 | 16 | 16 | 16 | 3 | 6 | 8 | 2 | 0 | 0 | 0 | 4.58e-08 | 4.84e-05 |
| 18 | PRDM9 | PR domain containing 9 | 448274 | 19 | 16 | 19 | 4 | 6 | 7 | 4 | 0 | 1 | 1 | 1.41e-07 | 0.000141 |
| 19 | ACVR1B | activin A receptor, type IB | 339499 | 15 | 14 | 15 | 0 | 4 | 7 | 2 | 0 | 2 | 0 | 1.57e-07 | 0.000148 |
| 20 | CSMD1 | CUB and Sushi multiple domains 1 | 1444240 | 45 | 26 | 44 | 19 | 9 | 21 | 9 | 1 | 3 | 2 | 2.45e-07 | 0.000220 |
| 21 | LIFR | leukemia inhibitory factor receptor alpha | 744473 | 24 | 18 | 24 | 5 | 4 | 6 | 9 | 1 | 4 | 0 | 3.77e-07 | 0.000323 |
| 22 | MAP2K4 | mitogen-activated protein kinase kinase 4 | 246117 | 11 | 11 | 10 | 1 | 3 | 4 | 2 | 0 | 2 | 0 | 4.09e-07 | 0.000333 |
| 23 | CCDC160 | coiled-coil domain containing 160 | 85540 | 9 | 7 | 9 | 0 | 0 | 4 | 0 | 1 | 3 | 1 | 6.02e-07 | 0.000470 |
| 24 | CNTN6 | contactin 6 | 708576 | 22 | 17 | 22 | 3 | 5 | 13 | 2 | 0 | 2 | 0 | 6.93e-07 | 0.000519 |
| 25 | NRXN1 | neurexin 1 | 761168 | 24 | 20 | 24 | 11 | 10 | 7 | 4 | 1 | 2 | 0 | 1.12e-06 | 0.000801 |
| 26 | SOX9 | SRY (sex determining region Y)-box 9 (campomelic dysplasia, autosomal sex-reversal) | 256689 | 10 | 10 | 10 | 0 | 0 | 0 | 1 | 0 | 8 | 1 | 1.21e-06 | 0.000812 |
| 27 | CPXCR1 | CPX chromosome region, candidate 1 | 186322 | 10 | 9 | 10 | 1 | 2 | 5 | 2 | 0 | 1 | 0 | 1.22e-06 | 0.000812 |
| 28 | DMD | dystrophin (muscular dystrophy, Duchenne and Becker types) | 2565596 | 47 | 33 | 46 | 6 | 10 | 14 | 14 | 0 | 9 | 0 | 1.27e-06 | 0.000812 |
| 29 | KIAA1804 | 532518 | 18 | 15 | 16 | 0 | 8 | 7 | 1 | 0 | 2 | 0 | 1.89e-06 | 0.00117 | |
| 30 | KRTAP5-5 | keratin associated protein 5-5 | 119310 | 4 | 4 | 1 | 1 | 0 | 0 | 0 | 4 | 0 | 0 | 2.66e-06 | 0.00159 |
| 31 | SLITRK1 | SLIT and NTRK-like family, member 1 | 448459 | 17 | 15 | 16 | 5 | 6 | 2 | 6 | 0 | 3 | 0 | 2.95e-06 | 0.00166 |
| 32 | ZFHX4 | zinc finger homeobox 4 | 1373120 | 43 | 24 | 42 | 18 | 11 | 22 | 7 | 0 | 3 | 0 | 2.96e-06 | 0.00166 |
| 33 | ARID1A | AT rich interactive domain 1A (SWI-like) | 1266553 | 22 | 21 | 20 | 3 | 2 | 5 | 1 | 1 | 13 | 0 | 3.70e-06 | 0.00201 |
| 34 | EPHA3 | EPH receptor A3 | 678203 | 17 | 16 | 17 | 5 | 5 | 6 | 5 | 1 | 0 | 0 | 3.83e-06 | 0.00202 |
| 35 | CTNNB1 | catenin (cadherin-associated protein), beta 1, 88kDa | 528618 | 12 | 11 | 12 | 0 | 3 | 4 | 3 | 1 | 1 | 0 | 3.98e-06 | 0.00204 |
In this analysis, COSMIC is used as a filter to increase power by restricting the territory of each gene. Cosmic version: v48.
Table 4. Get Full Table Significantly mutated genes (COSMIC territory only). To access the database please go to: COSMIC. Number of significant genes found: 29. Number of genes displayed: 10
| rank | gene | description | n | cos | n_cos | N_cos | cos_ev | p | q |
|---|---|---|---|---|---|---|---|---|---|
| 1 | APC | adenomatous polyposis coli | 187 | 839 | 137 | 187936 | 2584 | 0 | 0 |
| 2 | TP53 | tumor protein p53 | 122 | 824 | 122 | 184576 | 45406 | 0 | 0 |
| 3 | ERBB3 | v-erb-b2 erythroblastic leukemia viral oncogene homolog 3 (avian) | 14 | 6 | 6 | 1344 | 6 | 7.9e-14 | 1.2e-10 |
| 4 | NRAS | neuroblastoma RAS viral (v-ras) oncogene homolog | 20 | 33 | 18 | 7392 | 17998 | 3.7e-13 | 4.1e-10 |
| 5 | KRAS | v-Ki-ras2 Kirsten rat sarcoma viral oncogene homolog | 96 | 52 | 95 | 11648 | 1013913 | 5.5e-13 | 5e-10 |
| 6 | BRAF | v-raf murine sarcoma viral oncogene homolog B1 | 23 | 89 | 20 | 19936 | 287480 | 8.7e-13 | 5.7e-10 |
| 7 | FBXW7 | F-box and WD repeat domain containing 7 | 45 | 91 | 31 | 20384 | 1228 | 8.9e-13 | 5.7e-10 |
| 8 | KRTAP5-5 | keratin associated protein 5-5 | 4 | 1 | 4 | 224 | 4 | 1.1e-12 | 6e-10 |
| 9 | SMAD4 | SMAD family member 4 | 29 | 159 | 19 | 35616 | 90 | 1.3e-12 | 6.7e-10 |
| 10 | PIK3CA | phosphoinositide-3-kinase, catalytic, alpha polypeptide | 40 | 220 | 34 | 49280 | 13256 | 1.6e-12 | 7.2e-10 |
Note:
n - number of (nonsilent) mutations in this gene across the individual set.
cos = number of unique mutated sites in this gene in COSMIC
n_cos = overlap between n and cos.
N_cos = number of individuals times cos.
cos_ev = total evidence: number of reports in COSMIC for mutations seen in this gene.
p = p-value for seeing the observed amount of overlap in this gene)
q = q-value, False Discovery Rate (Benjamini-Hochberg procedure)
Table 5. Get Full Table Genes with Clustered Mutations
| num | gene | desc | n | mindist | nmuts0 | nmuts3 | nmuts12 | npairs0 | npairs3 | npairs12 |
|---|---|---|---|---|---|---|---|---|---|---|
| 6654 | KRAS | v-Ki-ras2 Kirsten rat sarcoma viral oncogene homolog | 96 | 0 | 2294 | 2964 | 3043 | 2294 | 2964 | 3043 |
| 13035 | TP53 | tumor protein p53 | 122 | 0 | 280 | 459 | 747 | 280 | 459 | 747 |
| 1255 | BRAF | v-raf murine sarcoma viral oncogene homolog B1 | 23 | 0 | 190 | 190 | 190 | 190 | 190 | 190 |
| 645 | APC | adenomatous polyposis coli | 187 | 0 | 166 | 221 | 326 | 166 | 221 | 326 |
| 4535 | FBXW7 | F-box and WD repeat domain containing 7 | 45 | 0 | 81 | 87 | 105 | 81 | 87 | 105 |
| 9463 | PIK3CA | phosphoinositide-3-kinase, catalytic, alpha polypeptide | 40 | 0 | 74 | 111 | 136 | 74 | 111 | 136 |
| 8399 | NRAS | neuroblastoma RAS viral (v-ras) oncogene homolog | 20 | 0 | 61 | 73 | 73 | 61 | 73 | 73 |
| 11751 | SMAD4 | SMAD family member 4 | 29 | 0 | 24 | 30 | 56 | 24 | 30 | 56 |
| 4110 | ERBB3 | v-erb-b2 erythroblastic leukemia viral oncogene homolog 3 (avian) | 14 | 0 | 10 | 15 | 15 | 10 | 15 | 15 |
| 4362 | FAM22F | family with sequence similarity 22, member F | 9 | 0 | 10 | 10 | 10 | 10 | 10 | 10 |
Note:
n - number of mutations in this gene in the individual set.
mindist - distance (in aa) between closest pair of mutations in this gene
npairs3 - how many pairs of mutations are within 3 aa of each other.
npairs12 - how many pairs of mutations are within 12 aa of each other.
Table 6. Get Full Table A Ranked List of Significantly Mutated Genesets. (Source: MSigDB GSEA Cannonical Pathway Set).Number of significant genesets found: 146. Number of genesets displayed: 10
| rank | geneset | description | genes | N_genes | mut_tally | N | n | npat | nsite | nsil | n1 | n2 | n3 | n4 | n5 | n6 | p | q |
|---|---|---|---|---|---|---|---|---|---|---|---|---|---|---|---|---|---|---|
| 1 | HSA04310_WNT_SIGNALING_PATHWAY | Genes involved in Wnt signaling pathway | APC, APC2, AXIN1, AXIN2, BTRC, CACYBP, CAMK2A, CAMK2B, CAMK2D, CAMK2G, CCND1, CCND2, CCND3, CER1, CHD8, CHP, CREBBP, CSNK1A1, CSNK1A1L, CSNK1E, CSNK2A1, CSNK2A2, CSNK2B, CTBP1, CTBP2, CTNNB1, CTNNBIP1, CUL1, CXXC4, DAAM1, DAAM2, DKK1, DKK2, DKK4, DVL1, DVL2, DVL3, EP300, FBXW11, FOSL1, FRAT1, FRAT2, FZD1, FZD10, FZD2, FZD3, FZD4, FZD5, FZD6, FZD7, FZD8, FZD9, GSK3B, JUN, LEF1, LOC652788, LRP5, LRP6, MAP3K7, MAPK10, MAPK8, MAPK9, MMP7, MYC, NFAT5, NFATC1, NFATC2, NFATC3, NFATC4, NKD1, NKD2, NLK, PLCB1, PLCB2, PLCB3, PLCB4, PORCN, PPARD, PPP2CA, PPP2CB, PPP2R1A, PPP2R1B, PPP2R2A, PPP2R2B, PPP2R2C, PPP3CA, PPP3CB, PPP3CC, PPP3R1, PPP3R2, PRICKLE1, PRICKLE2, PRKACA, PRKACB, PRKACG, PRKCA, PRKCB1, PRKCG, PRKX, PRKY, PSEN1, RAC1, RAC2, RAC3, RBX1, RHOA, ROCK1, ROCK2, RUVBL1, SENP2, SFRP1, SFRP2, SFRP4, SFRP5, SIAH1, SKP1, SMAD2, SMAD3, SMAD4, SOX17, TBL1X, TBL1XR1, TBL1Y, TCF7, TCF7L1, TCF7L2, TP53, VANGL1, VANGL2, WIF1, WNT1, WNT10A, WNT10B, WNT11, WNT16, WNT2, WNT2B, WNT3, WNT3A, WNT4, WNT5A, WNT5B, WNT6, WNT7A, WNT7B, WNT8A, WNT8B, WNT9A, WNT9B | 144 | APC(187), APC2(1), AXIN1(2), AXIN2(9), BTRC(5), CACYBP(2), CAMK2A(1), CAMK2B(2), CAMK2D(3), CAMK2G(2), CCND2(1), CCND3(1), CER1(3), CHD8(6), CREBBP(25), CSNK1A1(2), CSNK1A1L(5), CSNK2A1(4), CSNK2A2(2), CSNK2B(2), CTBP1(1), CTBP2(2), CTNNB1(12), CTNNBIP1(1), CUL1(8), CXXC4(1), DAAM1(2), DAAM2(9), DKK1(5), DKK2(6), DKK4(7), DVL2(9), DVL3(4), EP300(15), FBXW11(8), FZD1(1), FZD10(6), FZD2(2), FZD3(13), FZD4(2), FZD6(6), FZD7(3), FZD8(1), GSK3B(8), LEF1(4), LRP5(5), LRP6(17), MAP3K7(4), MAPK10(8), MAPK8(7), MAPK9(5), MMP7(5), NFAT5(5), NFATC1(2), NFATC2(5), NFATC3(5), NFATC4(5), NKD1(3), NKD2(1), NLK(1), PLCB1(8), PLCB2(3), PLCB3(4), PLCB4(10), PORCN(2), PPARD(2), PPP2CA(1), PPP2CB(2), PPP2R1A(4), PPP2R1B(2), PPP2R2A(1), PPP2R2B(3), PPP2R2C(4), PPP3CA(3), PPP3CB(5), PPP3CC(4), PPP3R1(1), PPP3R2(1), PRICKLE1(11), PRICKLE2(6), PRKACA(1), PRKACB(1), PRKACG(3), PRKCA(4), PRKCG(10), PRKX(2), PSEN1(3), RBX1(1), RHOA(5), ROCK1(15), ROCK2(6), RUVBL1(8), SENP2(3), SFRP1(3), SFRP2(3), SFRP4(4), SFRP5(1), SIAH1(1), SKP1(1), SMAD2(16), SMAD3(9), SMAD4(29), SOX17(2), TBL1X(6), TBL1XR1(6), TBL1Y(1), TCF7(6), TCF7L1(3), TCF7L2(20), TP53(122), VANGL1(2), VANGL2(5), WIF1(2), WNT1(1), WNT10B(4), WNT11(3), WNT16(2), WNT2(1), WNT2B(3), WNT3(4), WNT3A(1), WNT4(1), WNT5A(3), WNT6(1), WNT7A(2), WNT7B(2), WNT8A(2), WNT9A(2), WNT9B(2) | 50774791 | 894 | 218 | 758 | 156 | 275 | 204 | 133 | 8 | 221 | 53 | <1.00e-15 | <4.11e-14 |
| 2 | HSA04810_REGULATION_OF_ACTIN_CYTOSKELETON | Genes involved in regulation of actin cytoskeleton | ABI2, ACTN1, ACTN2, ACTN3, ACTN4, APC, APC2, ARAF, ARHGEF1, ARHGEF12, ARHGEF4, ARHGEF6, ARHGEF7, ARPC1A, ARPC1B, ARPC2, ARPC3, ARPC4, ARPC5, ARPC5L, BAIAP2, BCAR1, BDKRB1, BDKRB2, BRAF, C3orf10, CD14, CDC42, CFL1, CFL2, CHRM1, CHRM2, CHRM3, CHRM4, CHRM5, CRK, CRKL, CSK, CYFIP1, CYFIP2, DIAPH1, DIAPH2, DIAPH3, DOCK1, EGF, EGFR, EZR, F2, F2R, FGD1, FGD3, FGF1, FGF10, FGF11, FGF12, FGF13, FGF14, FGF16, FGF17, FGF18, FGF19, FGF2, FGF20, FGF21, FGF22, FGF23, FGF3, FGF4, FGF5, FGF6, FGF7, FGF8, FGF9, FGFR1, FGFR2, FGFR3, FGFR4, FN1, GIT1, GNA12, GNA13, GNG12, GRLF1, GSN, HRAS, INS, IQGAP1, IQGAP2, IQGAP3, ITGA1, ITGA10, ITGA11, ITGA2, ITGA2B, ITGA3, ITGA4, ITGA5, ITGA6, ITGA7, ITGA8, ITGA9, ITGAD, ITGAE, ITGAL, ITGAM, ITGAV, ITGAX, ITGB1, ITGB2, ITGB3, ITGB4, ITGB5, ITGB6, ITGB7, ITGB8, KRAS, LIMK1, LIMK2, LOC200025, LOC645126, LOC653888, MAP2K1, MAP2K2, MAPK1, MAPK3, MLCK, MOS, MRAS, MRCL3, MRLC2, MSN, MYH10, MYH14, MYH9, MYL2, MYL5, MYL7, MYL8P, MYL9, MYLC2PL, MYLK, MYLK2, MYLPF, NCKAP1, NCKAP1L, NRAS, PAK1, PAK2, PAK3, PAK4, PAK6, PAK7, PDGFA, PDGFB, PDGFRA, PDGFRB, PFN1, PFN2, PFN3, PFN4, PIK3CA, PIK3CB, PIK3CD, PIK3CG, PIK3R1, PIK3R2, PIK3R3, PIK3R5, PIP4K2A, PIP4K2B, PIP4K2C, PIP5K1A, PIP5K1B, PIP5K1C, PIP5K3, PPP1CA, PPP1CB, PPP1CC, PPP1R12A, PPP1R12B, PTK2, PXN, RAC1, RAC2, RAC3, RAF1, RDX, RHOA, ROCK1, ROCK2, RRAS, RRAS2, SCIN, SLC9A1, SOS1, SOS2, SSH1, SSH2, SSH3, TIAM1, TIAM2, TMSB4X, TMSB4Y, TMSL3, VAV1, VAV2, VAV3, VCL, WAS, WASF1, WASF2, WASL | 203 | ABI2(1), ACTN1(5), ACTN2(8), ACTN3(3), ACTN4(3), APC(187), APC2(1), ARAF(3), ARHGEF1(5), ARHGEF12(9), ARHGEF4(4), ARHGEF6(10), ARHGEF7(8), ARPC1A(5), ARPC1B(2), ARPC2(2), ARPC5(1), ARPC5L(2), BAIAP2(1), BDKRB2(3), BRAF(23), CD14(1), CDC42(1), CFL1(1), CHRM1(3), CHRM2(11), CHRM3(4), CHRM4(1), CHRM5(2), CRKL(2), CSK(3), CYFIP1(6), CYFIP2(5), DIAPH1(1), DIAPH2(12), DIAPH3(5), DOCK1(7), EGF(3), EGFR(11), EZR(2), F2(3), FGD1(8), FGD3(2), FGF1(2), FGF11(3), FGF12(3), FGF13(3), FGF14(5), FGF17(1), FGF19(1), FGF20(2), FGF21(1), FGF23(1), FGF3(1), FGF5(4), FGF6(3), FGF7(1), FGF8(1), FGF9(1), FGFR1(4), FGFR2(6), FGFR3(2), FGFR4(2), FN1(21), GIT1(3), GNA12(2), GNA13(2), GRLF1(12), IQGAP1(13), IQGAP2(12), IQGAP3(11), ITGA1(3), ITGA10(7), ITGA11(4), ITGA2(6), ITGA2B(4), ITGA3(4), ITGA4(8), ITGA5(7), ITGA6(4), ITGA7(6), ITGA8(8), ITGA9(6), ITGAD(8), ITGAE(7), ITGAL(8), ITGAM(8), ITGAV(5), ITGAX(6), ITGB1(6), ITGB2(5), ITGB3(9), ITGB4(3), ITGB5(6), ITGB6(6), ITGB7(4), ITGB8(5), KRAS(96), LIMK1(5), LIMK2(5), MAP2K1(4), MAP2K2(1), MAPK1(2), MAPK3(3), MOS(3), MRAS(1), MSN(6), MYH10(10), MYH14(12), MYH9(12), MYL2(1), MYL7(1), MYL9(2), MYLK(14), MYLK2(3), NCKAP1(9), NCKAP1L(11), NRAS(20), PAK1(5), PAK2(3), PAK3(5), PAK6(1), PAK7(7), PDGFA(1), PDGFRA(17), PDGFRB(6), PFN2(1), PFN4(1), PIK3CA(40), PIK3CB(2), PIK3CD(3), PIK3CG(14), PIK3R1(10), PIK3R2(1), PIK3R3(4), PIK3R5(1), PIP4K2A(2), PIP4K2B(2), PIP4K2C(3), PIP5K1A(3), PIP5K1B(2), PIP5K1C(4), PPP1CB(2), PPP1CC(2), PPP1R12A(3), PPP1R12B(9), PTK2(5), RAF1(6), RDX(3), RHOA(5), ROCK1(15), ROCK2(6), RRAS2(2), SCIN(3), SLC9A1(4), SOS1(7), SOS2(11), SSH1(6), SSH2(4), SSH3(1), TIAM1(17), TIAM2(16), TMSL3(1), VAV1(13), VAV2(4), VAV3(12), VCL(2), WAS(1), WASF1(3), WASF2(2), WASL(7) | 87387370 | 1187 | 216 | 982 | 278 | 334 | 392 | 203 | 8 | 194 | 56 | <1.00e-15 | <4.11e-14 |
| 3 | ST_ADRENERGIC | Adrenergic receptors respond to epinephrine and norepinephrine signaling. | AKT1, APC, AR, ASAH1, BF, BRAF, CAMP, CCL13, CCL15, CCL16, DAG1, EGFR, GAS, GNA11, GNA15, GNAI1, GNAQ, ITPKA, ITPKB, ITPR1, ITPR2, ITPR3, KCNJ3, KCNJ5, KCNJ9, MAPK1, MAPK10, MAPK14, PHKA2, PIK3CA, PIK3CD, PIK3R1, PITX2, PTX1, PTX3, RAF1, SRC | 34 | AKT1(2), APC(187), AR(6), ASAH1(3), BRAF(23), CCL13(1), CCL15(1), DAG1(5), EGFR(11), GNA11(1), GNA15(3), GNAI1(4), GNAQ(4), ITPKB(4), ITPR1(19), ITPR2(18), ITPR3(12), KCNJ3(6), KCNJ5(4), KCNJ9(3), MAPK1(2), MAPK10(8), MAPK14(3), PHKA2(6), PIK3CA(40), PIK3CD(3), PIK3R1(10), PITX2(2), PTX3(2), RAF1(6), SRC(3) | 16590615 | 402 | 191 | 303 | 61 | 77 | 74 | 76 | 0 | 120 | 55 | <1.00e-15 | <4.11e-14 |
| 4 | ST_WNT_BETA_CATENIN_PATHWAY | Beta-catenin is degraded in the absence of Wnt signaling; when extracellular Wnt binds Frizzled receptors, beta-catenin accumulates in the nucleus and may promote cell survival. | AKT1, AKT2, AKT3, ANKRD6, APC, AXIN1, AXIN2, C22orf2, CER1, CSNK1A1, CTNNB1, DACT1, DKK1, DKK2, DKK3, DKK4, DVL1, FRAT1, FSTL1, GSK3A, GSK3B, IDAX, LAMR1, LRP1, MVP, NKD1, NKD2, PIN1, PSEN1, PTPRA, SENP2, SFRP1, TSHB, WIF1 | 30 | AKT1(2), AKT2(6), AKT3(1), ANKRD6(5), APC(187), AXIN1(2), AXIN2(9), CER1(3), CSNK1A1(2), CTNNB1(12), DACT1(6), DKK1(5), DKK2(6), DKK3(2), DKK4(7), FSTL1(6), GSK3A(2), GSK3B(8), LRP1(17), MVP(4), NKD1(3), NKD2(1), PIN1(1), PSEN1(3), PTPRA(2), SENP2(3), SFRP1(3), TSHB(1), WIF1(2) | 12642186 | 311 | 185 | 249 | 37 | 60 | 43 | 39 | 1 | 116 | 52 | <1.00e-15 | <4.11e-14 |
| 5 | GSK3PATHWAY | Bacterial lipopolysaccharide activates AKT to promote the survival and activation of macrophages and inhibits Gsk3-beta to promote beta-catenin accumulation in the nucleus. | AKT1, APC, AXIN1, CCND1, CD14, CTNNB1, DVL1, FZD1, GJA1, GNAI1, GSK3B, IRAK1, LBP, LEF1, LY96, MYD88, NFKB1, PDPK1, PIK3CA, PIK3R1, PPP2CA, PRKR, RELA, TIRAP, TLR4, TOLLIP, WNT1 | 26 | AKT1(2), APC(187), AXIN1(2), CD14(1), CTNNB1(12), FZD1(1), GJA1(7), GNAI1(4), GSK3B(8), IRAK1(1), LBP(1), LEF1(4), LY96(2), MYD88(2), NFKB1(6), PDPK1(1), PIK3CA(40), PIK3R1(10), PPP2CA(1), RELA(2), TIRAP(1), TLR4(10), TOLLIP(1), WNT1(1) | 9451888 | 307 | 183 | 228 | 28 | 44 | 50 | 43 | 1 | 115 | 54 | <1.00e-15 | <4.11e-14 |
| 6 | PITX2PATHWAY | The bicoid-related transcription factor Pitx2 is activated by Wnt binding to the Frizzled receptor and induces tissue-specific cell proliferation. | APC, AXIN1, CREBBP, CTNNB1, DVL1, EP300, FZD1, GSK3B, HDAC1, HTATIP, LDB1, LEF1, PITX2, PPARBP, TRRAP, WNT1 | 14 | APC(187), AXIN1(2), CREBBP(25), CTNNB1(12), EP300(15), FZD1(1), GSK3B(8), HDAC1(2), LDB1(5), LEF1(4), PITX2(2), TRRAP(21), WNT1(1) | 10494881 | 285 | 180 | 225 | 29 | 46 | 36 | 32 | 2 | 117 | 52 | <1.00e-15 | <4.11e-14 |
| 7 | CELL_CYCLE_KEGG | ABL1, ASK, ATM, BUB1, BUB1B, BUB3, CCNA1, CCNA2, CCNB1, CCNB2, CCNB3, CCND2, CCND3, CCNE1, CCNE2, CCNH, CDAN1, CDC14A, CDC14B, CDC14B, CDC14C, CDC2, CDC20, CDC25A, CDC25B, CDC25C, CDC45L, CDC6, CDC7, CDH1, CDK2, CDK4, CDKN1A, CDKN2A, CHEK1, CHEK2, DTX4, E2F1, E2F2, E2F3, E2F4, E2F5, E2F6, EP300, ESPL1, FLJ14001, GADD45A, GSK3B, HDAC1, HDAC2, HDAC3, HDAC4, HDAC5, HDAC6, HDAC7A, HDAC8, MAD1L1, MAD2L1, MAD2L2, MCM2, MCM3, MCM4, MCM5, MCM6, MCM7, MDM2, MPEG1, MPL, ORC1L, ORC2L, ORC3L, ORC4L, ORC5L, ORC6L, PCNA, PLK1, PRKDC, PTPRA, PTTG1, PTTG2, PTTG3, RB1, RBL1, SKP2, SMAD4, SMC1L1, TBC1D8, TFDP1, TGFB1, TP53, WEE1 | 82 | ABL1(4), ATM(37), BUB1(6), BUB1B(6), BUB3(2), CCNA1(6), CCNA2(3), CCNB1(2), CCNB2(2), CCNB3(7), CCND2(1), CCND3(1), CCNE1(3), CCNE2(2), CCNH(2), CDAN1(3), CDC14A(4), CDC14B(4), CDC20(3), CDC25A(2), CDC25B(5), CDC25C(4), CDC6(1), CDC7(3), CDH1(5), CDK2(2), CDK4(3), CDKN1A(1), CDKN2A(1), CHEK1(1), CHEK2(1), DTX4(3), E2F2(1), E2F3(2), E2F4(1), E2F5(2), EP300(15), ESPL1(8), GSK3B(8), HDAC1(2), HDAC2(2), HDAC3(2), HDAC4(5), HDAC5(2), HDAC6(6), MAD1L1(2), MAD2L1(1), MAD2L2(1), MCM3(3), MCM4(4), MCM5(6), MCM6(4), MCM7(3), MDM2(4), MPEG1(4), MPL(2), ORC1L(1), ORC3L(1), ORC4L(1), ORC5L(1), PCNA(3), PLK1(8), PRKDC(18), PTPRA(2), PTTG1(1), RB1(7), RBL1(5), SKP2(1), SMAD4(29), TBC1D8(5), TFDP1(4), TGFB1(1), TP53(122), WEE1(3) | 34828727 | 433 | 178 | 369 | 75 | 131 | 122 | 88 | 8 | 80 | 4 | <1.00e-15 | <4.11e-14 | |
| 8 | HSA04012_ERBB_SIGNALING_PATHWAY | Genes involved in ErbB signaling pathway | ABL1, ABL2, AKT1, AKT2, AKT3, ARAF, AREG, BAD, BRAF, BTC, CAMK2A, CAMK2B, CAMK2D, CAMK2G, CBL, CBLB, CBLC, CDKN1A, CDKN1B, CRK, CRKL, EGF, EGFR, EIF4EBP1, ELK1, ERBB2, ERBB3, ERBB4, EREG, FRAP1, GAB1, GRB2, GSK3B, HBEGF, HRAS, JUN, KRAS, MAP2K1, MAP2K2, MAP2K4, MAP2K7, MAPK1, MAPK10, MAPK3, MAPK8, MAPK9, MYC, NCK1, NCK2, NRAS, NRG1, NRG2, NRG3, NRG4, PAK1, PAK2, PAK3, PAK4, PAK6, PAK7, PIK3CA, PIK3CB, PIK3CD, PIK3CG, PIK3R1, PIK3R2, PIK3R3, PIK3R5, PLCG1, PLCG2, PRKCA, PRKCB1, PRKCG, PTK2, RAF1, RPS6KB1, RPS6KB2, SHC1, SHC2, SHC3, SHC4, SOS1, SOS2, SRC, STAT5A, STAT5B, TGFA | 85 | ABL1(4), ABL2(7), AKT1(2), AKT2(6), AKT3(1), ARAF(3), BAD(1), BRAF(23), BTC(2), CAMK2A(1), CAMK2B(2), CAMK2D(3), CAMK2G(2), CBL(5), CBLB(8), CDKN1A(1), CDKN1B(3), CRKL(2), EGF(3), EGFR(11), ERBB2(10), ERBB3(14), ERBB4(21), EREG(1), GAB1(6), GRB2(3), GSK3B(8), HBEGF(1), KRAS(96), MAP2K1(4), MAP2K2(1), MAP2K4(11), MAPK1(2), MAPK10(8), MAPK3(3), MAPK8(7), MAPK9(5), NCK1(1), NRAS(20), NRG1(15), NRG2(6), NRG3(7), NRG4(1), PAK1(5), PAK2(3), PAK3(5), PAK6(1), PAK7(7), PIK3CA(40), PIK3CB(2), PIK3CD(3), PIK3CG(14), PIK3R1(10), PIK3R2(1), PIK3R3(4), PIK3R5(1), PLCG1(4), PLCG2(13), PRKCA(4), PRKCG(10), PTK2(5), RAF1(6), RPS6KB1(3), RPS6KB2(2), SHC1(3), SHC2(1), SHC3(1), SHC4(5), SOS1(7), SOS2(11), SRC(3), STAT5B(3) | 33296728 | 518 | 175 | 369 | 98 | 118 | 227 | 115 | 5 | 51 | 2 | <1.00e-15 | <4.11e-14 |
| 9 | TGFBPATHWAY | The TGF-beta receptor responds to ligand binding by activating the SMAD family of transcriptional regulations, commonly blocking cell growth. | APC, CDH1, CREBBP, EP300, MADH2, MADH3, MADH4, MADH7, MADHIP, MAP2K1, MAP3K7, MAP3K7IP1, MAPK3, SKIL, TGFB1, TGFB2, TGFB3, TGFBR1, TGFBR2 | 13 | APC(187), CDH1(5), CREBBP(25), EP300(15), MAP2K1(4), MAP3K7(4), MAPK3(3), SKIL(1), TGFB1(1), TGFB2(9), TGFBR1(9), TGFBR2(7) | 8403558 | 270 | 175 | 210 | 25 | 34 | 35 | 30 | 1 | 118 | 52 | <1.00e-15 | <4.11e-14 |
| 10 | HSA04662_B_CELL_RECEPTOR_SIGNALING_PATHWAY | Genes involved in B cell receptor signaling pathway | AKT1, AKT2, AKT3, BCL10, BLNK, BTK, CARD11, CD19, CD22, CD72, CD79A, CD79B, CD81, CHP, CHUK, CR2, FCGR2B, FOS, GSK3B, HRAS, IFITM1, IKBKB, IKBKG, INPP5D, JUN, KRAS, LILRB3, LYN, MALT1, NFAT5, NFATC1, NFATC2, NFATC3, NFATC4, NFKB1, NFKB2, NFKBIA, NFKBIB, NFKBIE, NRAS, PIK3CA, PIK3CB, PIK3CD, PIK3CG, PIK3R1, PIK3R2, PIK3R3, PIK3R5, PLCG2, PPP3CA, PPP3CB, PPP3CC, PPP3R1, PPP3R2, PRKCB1, PTPN6, RAC1, RAC2, RAC3, RASGRP3, SYK, VAV1, VAV2, VAV3 | 62 | AKT1(2), AKT2(6), AKT3(1), BCL10(3), BLNK(1), BTK(7), CARD11(9), CD19(3), CD22(10), CD72(4), CD79A(3), CD79B(1), CHUK(6), CR2(11), FOS(1), GSK3B(8), IFITM1(1), IKBKB(4), INPP5D(4), KRAS(96), LILRB3(2), LYN(4), MALT1(7), NFAT5(5), NFATC1(2), NFATC2(5), NFATC3(5), NFATC4(5), NFKB1(6), NFKB2(4), NFKBIB(1), NFKBIE(2), NRAS(20), PIK3CA(40), PIK3CB(2), PIK3CD(3), PIK3CG(14), PIK3R1(10), PIK3R2(1), PIK3R3(4), PIK3R5(1), PLCG2(13), PPP3CA(3), PPP3CB(5), PPP3CC(4), PPP3R1(1), PPP3R2(1), PTPN6(4), RASGRP3(7), SYK(3), VAV1(13), VAV2(4), VAV3(12) | 23448894 | 394 | 157 | 272 | 64 | 111 | 195 | 57 | 1 | 28 | 2 | <1.00e-15 | <4.11e-14 |
Table 7. Get Full Table A Ranked List of Significantly Mutated Genesets (Excluding Significantly Mutated Genes). Number of significant genesets found: 0. Number of genesets displayed: 10
| rank | geneset | description | genes | N_genes | mut_tally | N | n | npat | nsite | nsil | n1 | n2 | n3 | n4 | n5 | n6 | p | q |
|---|---|---|---|---|---|---|---|---|---|---|---|---|---|---|---|---|---|---|
| 1 | CREMPATHWAY | The transcription factor CREM activates a post-meiotic transcriptional cascade culminating in spermatogenesis. | ADCY1, CREM, FHL5, FSHB, FSHR, GNAS, XPO1 | 7 | ADCY1(8), CREM(4), FHL5(4), FSHB(2), FSHR(7), GNAS(6), XPO1(2) | 3039066 | 33 | 29 | 33 | 12 | 13 | 9 | 7 | 1 | 3 | 0 | 0.0016 | 0.99 |
| 2 | ALTERNATIVEPATHWAY | The alternative complement pathway is an antibody-independent mechanism of immune activation that results in cell lysis via the membrane attack complex. | BF, C3, C5, C6, C7, C8A, C9, DF, PFC | 6 | C3(11), C5(13), C6(13), C7(5), C8A(6), C9(5) | 4019457 | 53 | 30 | 53 | 14 | 16 | 19 | 10 | 0 | 7 | 1 | 0.0059 | 1 |
| 3 | ERBB3PATHWAY | Neuregulins bind to the receptor tyrosine kinases ErbB3 and ErbB4, surface-localized receptors whose overexpression induces tumor formation. | EGF, EGFR, ERBB3, NRG1, UBE2D1 | 5 | EGF(3), EGFR(11), ERBB3(14), NRG1(15), UBE2D1(1) | 3378947 | 44 | 33 | 40 | 7 | 18 | 8 | 11 | 1 | 6 | 0 | 0.0071 | 1 |
| 4 | EOSINOPHILSPATHWAY | Recruitment of eosinophils in the inflammatory response observed in asthma occurs via the chemoattractant eotaxin binding to the CCR3 receptor. | CCL11, CCL5, CCR3, CSF2, HLA-DRA, HLA-DRB1, IL3, IL5 | 8 | CCR3(4), HLA-DRA(5), HLA-DRB1(2), IL3(3) | 949081 | 14 | 12 | 13 | 4 | 7 | 5 | 0 | 0 | 0 | 2 | 0.011 | 1 |
| 5 | FLUMAZENILPATHWAY | Flumazenil is a benzodiazepine receptor antagonist that may induce protective preconditioning in ischemic cardiomyocytes. | GABRA1, GABRA2, GABRA3, GABRA4, GABRA5, GABRA6, GPX1, PRKCE, SOD1 | 8 | GABRA1(4), GABRA2(9), GABRA3(5), GABRA4(8), GABRA6(5), GPX1(1), PRKCE(6) | 2175145 | 38 | 22 | 37 | 6 | 11 | 17 | 6 | 0 | 4 | 0 | 0.012 | 1 |
| 6 | 1_AND_2_METHYLNAPHTHALENE_DEGRADATION | ADH1A, ADH1A, ADH1B, ADH1C, ADH1B, ADH1C, ADH4, ADH6, ADH7, ADHFE1 | 7 | ADH1A(1), ADH1B(3), ADH1C(4), ADH4(2), ADH6(6), ADH7(2), ADHFE1(6) | 1762715 | 24 | 19 | 24 | 9 | 3 | 9 | 11 | 0 | 1 | 0 | 0.014 | 1 | |
| 7 | CCR3PATHWAY | CCR3 is a G-protein coupled receptor that recruits eosinophils to inflammation sites via chemokine ligands. | ARHA, CCL11, CCR3, CFL1, GNAQ, GNAS, GNB1, GNGT1, HRAS, LIMK1, MAP2K1, MAPK1, MAPK3, MYL2, NOX1, PIK3C2G, PLCB1, PPP1R12B, PRKCA, PRKCB1, PTK2, RAF1, ROCK2 | 21 | CCR3(4), CFL1(1), GNAQ(4), GNAS(6), GNB1(1), GNGT1(1), LIMK1(5), MAP2K1(4), MAPK1(2), MAPK3(3), MYL2(1), NOX1(1), PIK3C2G(9), PLCB1(8), PPP1R12B(9), PRKCA(4), PTK2(5), RAF1(6), ROCK2(6) | 7894259 | 80 | 47 | 78 | 16 | 30 | 21 | 13 | 1 | 15 | 0 | 0.015 | 1 |
| 8 | ACETYLCHOLINE_SYNTHESIS | ACHE, CHAT, CHKA, PCYT1A, PDHA1, PDHA2, PEMT, SLC18A3 | 8 | ACHE(2), CHAT(6), CHKA(4), PCYT1A(5), PDHA1(5), PDHA2(8), PEMT(1), SLC18A3(6) | 2214030 | 37 | 26 | 36 | 17 | 12 | 12 | 10 | 0 | 3 | 0 | 0.016 | 1 | |
| 9 | COMPLEMENT_ACTIVATION_CLASSICAL | C1QA, C1QB, C1QG, C1R, C1S, C2, C3, C4A, C4B, C5, C6, C7, C8A, C8B, C9, DAF, MASP1 | 12 | C1QB(1), C1R(3), C1S(6), C2(4), C3(11), C5(13), C6(13), C7(5), C8A(6), C9(5), MASP1(12) | 6230922 | 79 | 39 | 79 | 26 | 26 | 27 | 14 | 0 | 11 | 1 | 0.016 | 1 | |
| 10 | GPCRDB_CLASS_C_METABOTROPIC_GLUTAMATE_PHEROMONE | CASR, GABBR1, GPCR5A, GPR51, GPRC5A, GPRC5B, GPRC5C, GPRC5D, GRM1, GRM2, GRM3, GRM4, GRM5, GRM7, GRM8 | 13 | CASR(7), GABBR1(6), GPRC5A(2), GPRC5B(2), GPRC5C(2), GPRC5D(1), GRM1(12), GRM2(4), GRM3(7), GRM4(7), GRM5(11), GRM7(12), GRM8(9) | 6585022 | 82 | 48 | 80 | 47 | 35 | 23 | 14 | 1 | 9 | 0 | 0.018 | 1 |
In brief, we tabulate the number of mutations and the number of covered bases for each gene. The counts are broken down by mutation context category: four context categories that are discovered by MutSig, and one for indel and 'null' mutations, which include indels, nonsense mutations, splice-site mutations, and non-stop (read-through) mutations. For each gene, we calculate the probability of seeing the observed constellation of mutations, i.e. the product P1 x P2 x ... x Pm, or a more extreme one, given the background mutation rates calculated across the dataset. [1]
This is an experimental feature. The full results of the analysis summarized in this report can be downloaded from the TCGA Data Coordination Center.