This pipeline computes the correlation between cancer subtypes identified by different molecular patterns and selected clinical features.
Testing the association between subtypes identified by 10 different clustering approaches and 6 clinical features across 573 patients, 2 significant findings detected with P value < 0.05 and Q value < 0.25.
-
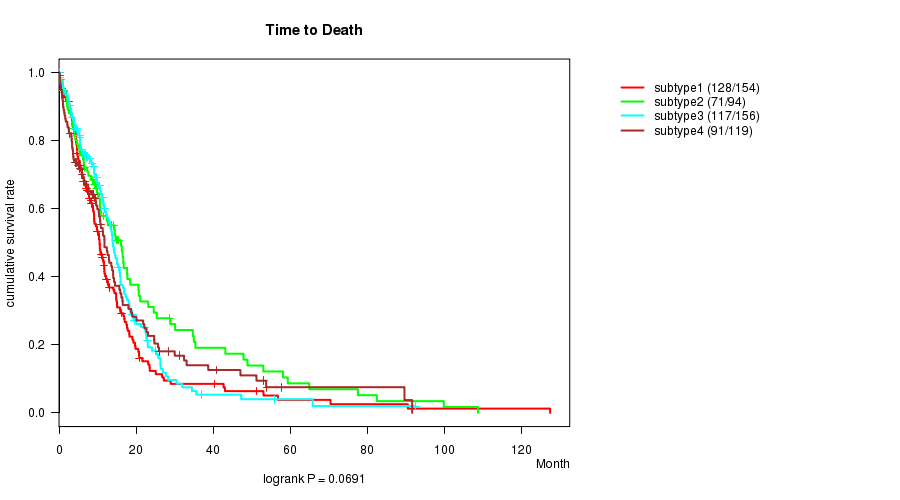
CNMF clustering analysis on array-based mRNA expression data identified 4 subtypes that do not correlate to any clinical features.
-
Consensus hierarchical clustering analysis on array-based mRNA expression data identified 3 subtypes that do not correlate to any clinical features.
-
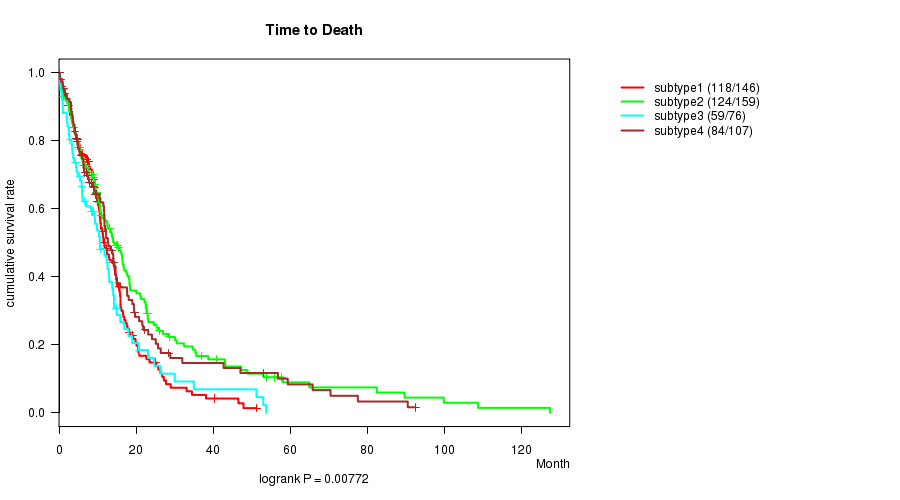
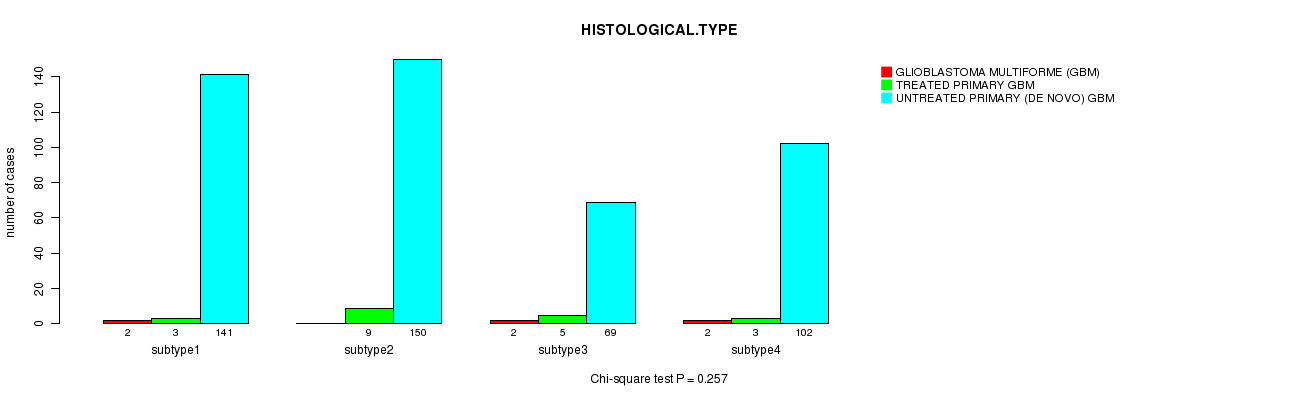
CNMF clustering analysis on array-based miR expression data identified 4 subtypes that do not correlate to any clinical features.
-
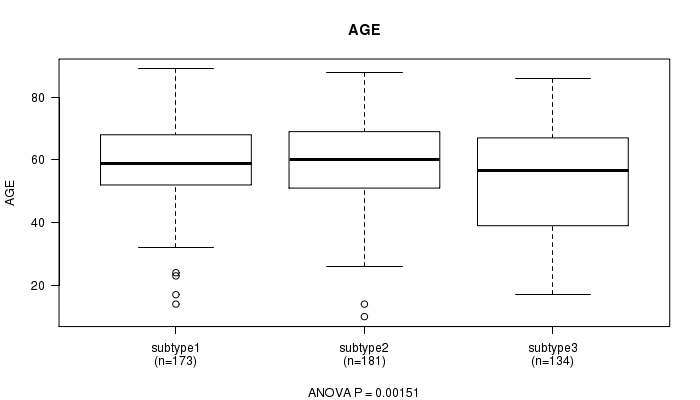
Consensus hierarchical clustering analysis on array-based miR expression data identified 3 subtypes that correlate to 'AGE'.
-
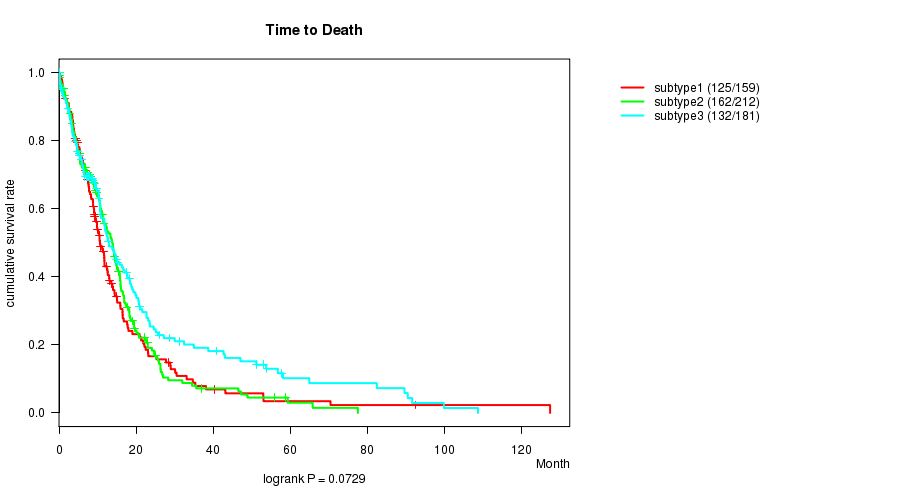
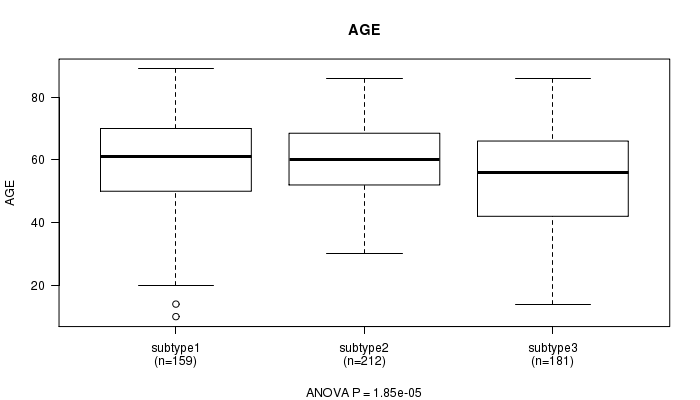
3 subtypes identified in current cancer cohort by 'Copy Number Ratio CNMF subtypes'. These subtypes correlate to 'AGE'.
-
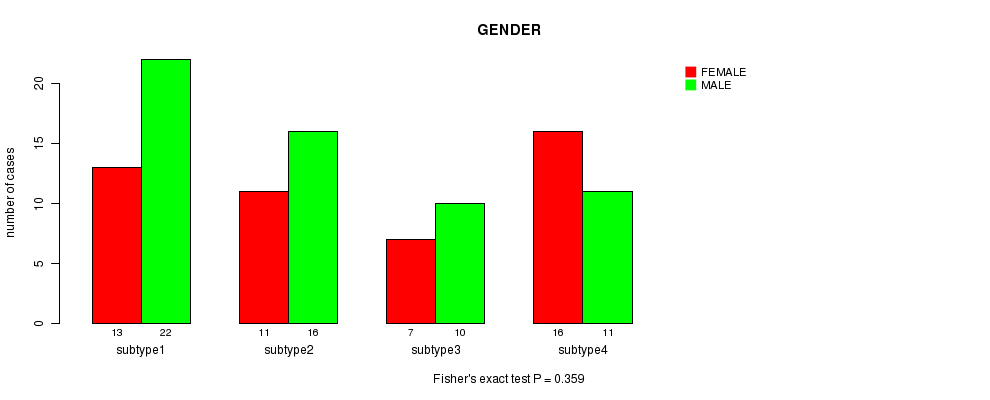
4 subtypes identified in current cancer cohort by 'METHLYATION CNMF'. These subtypes do not correlate to any clinical features.
-
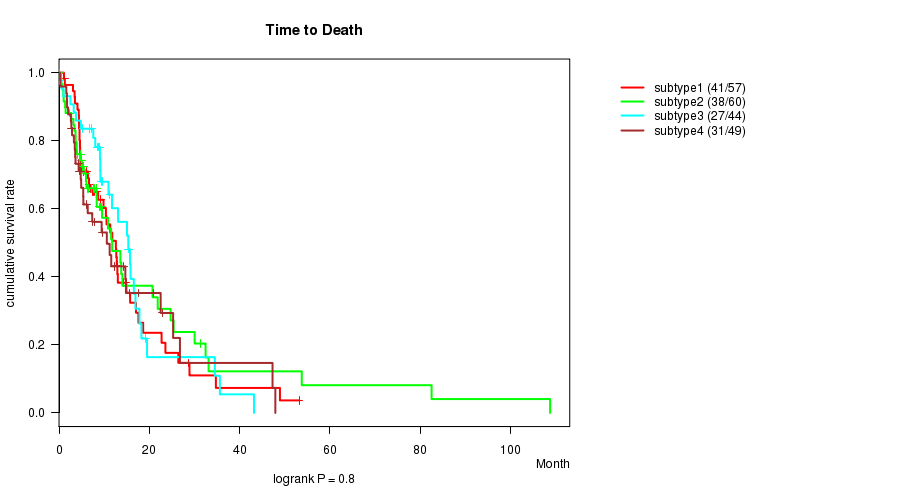
CNMF clustering analysis on RPPA data identified 4 subtypes that do not correlate to any clinical features.
-
Consensus hierarchical clustering analysis on RPPA data identified 3 subtypes that do not correlate to any clinical features.
-
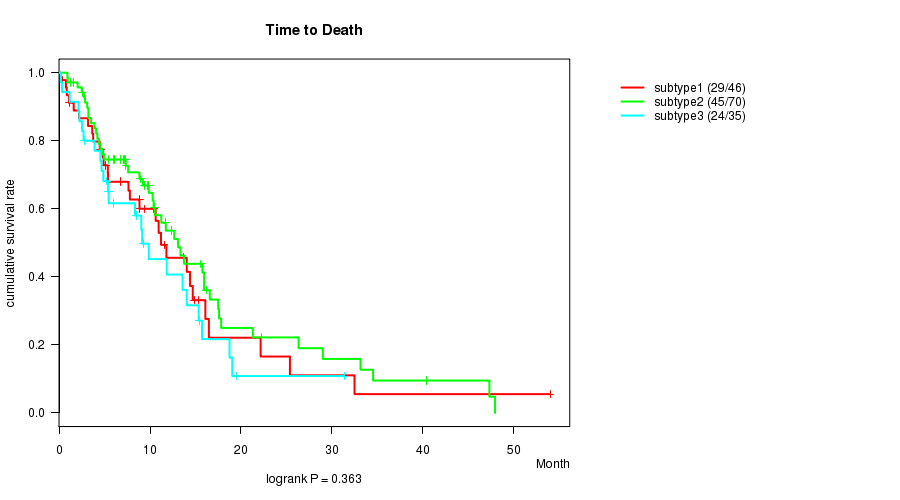
CNMF clustering analysis on sequencing-based mRNA expression data identified 3 subtypes that do not correlate to any clinical features.
-
Consensus hierarchical clustering analysis on sequencing-based mRNA expression data identified 3 subtypes that do not correlate to any clinical features.
Table 1. Get Full Table Overview of the association between subtypes identified by 10 different clustering approaches and 6 clinical features. Shown in the table are P values (Q values). Thresholded by P value < 0.05 and Q value < 0.25, 2 significant findings detected.
|
Clinical Features |
Time to Death |
AGE | GENDER |
KARNOFSKY PERFORMANCE SCORE |
HISTOLOGICAL TYPE |
RADIATIONS RADIATION REGIMENINDICATION |
| Statistical Tests | logrank test | ANOVA | Fisher's exact test | ANOVA | Fisher's exact test | Fisher's exact test |
| mRNA CNMF subtypes |
0.0691 (1.00) |
0.00554 (0.321) |
0.437 (1.00) |
0.888 (1.00) |
0.0262 (1.00) |
0.15 (1.00) |
| mRNA cHierClus subtypes |
0.133 (1.00) |
0.015 (0.84) |
0.556 (1.00) |
0.139 (1.00) |
0.0952 (1.00) |
0.112 (1.00) |
| miR CNMF subtypes |
0.00772 (0.44) |
0.11 (1.00) |
0.465 (1.00) |
0.943 (1.00) |
0.257 (1.00) |
0.355 (1.00) |
| miR cHierClus subtypes |
0.0244 (1.00) |
0.00151 (0.0892) |
0.13 (1.00) |
0.785 (1.00) |
0.515 (1.00) |
0.833 (1.00) |
| Copy Number Ratio CNMF subtypes |
0.0729 (1.00) |
1.85e-05 (0.00111) |
0.512 (1.00) |
0.871 (1.00) |
0.0729 (1.00) |
0.279 (1.00) |
| METHLYATION CNMF |
0.894 (1.00) |
0.163 (1.00) |
0.359 (1.00) |
0.954 (1.00) |
0.16 (1.00) |
0.345 (1.00) |
| RPPA CNMF subtypes |
0.8 (1.00) |
0.233 (1.00) |
0.222 (1.00) |
0.403 (1.00) |
0.439 (1.00) |
0.296 (1.00) |
| RPPA cHierClus subtypes |
0.767 (1.00) |
0.46 (1.00) |
0.622 (1.00) |
0.695 (1.00) |
0.743 (1.00) |
0.623 (1.00) |
| RNAseq CNMF subtypes |
0.363 (1.00) |
0.0725 (1.00) |
0.0767 (1.00) |
0.576 (1.00) |
1 (1.00) |
0.903 (1.00) |
| RNAseq cHierClus subtypes |
0.731 (1.00) |
0.045 (1.00) |
0.107 (1.00) |
0.32 (1.00) |
0.146 (1.00) |
0.712 (1.00) |
Table S1. Get Full Table Description of clustering approach #1: 'mRNA CNMF subtypes'
| Cluster Labels | 1 | 2 | 3 | 4 |
|---|---|---|---|---|
| Number of samples | 154 | 94 | 156 | 119 |
P value = 0.0691 (logrank test), Q value = 1
Table S2. Clustering Approach #1: 'mRNA CNMF subtypes' versus Clinical Feature #1: 'Time to Death'
| nPatients | nDeath | Duration Range (Median), Month | |
|---|---|---|---|
| ALL | 523 | 407 | 0.1 - 127.6 (9.9) |
| subtype1 | 154 | 128 | 0.1 - 127.6 (9.1) |
| subtype2 | 94 | 71 | 0.2 - 108.8 (10.5) |
| subtype3 | 156 | 117 | 0.1 - 92.6 (10.8) |
| subtype4 | 119 | 91 | 0.2 - 91.7 (9.3) |
Figure S1. Get High-res Image Clustering Approach #1: 'mRNA CNMF subtypes' versus Clinical Feature #1: 'Time to Death'
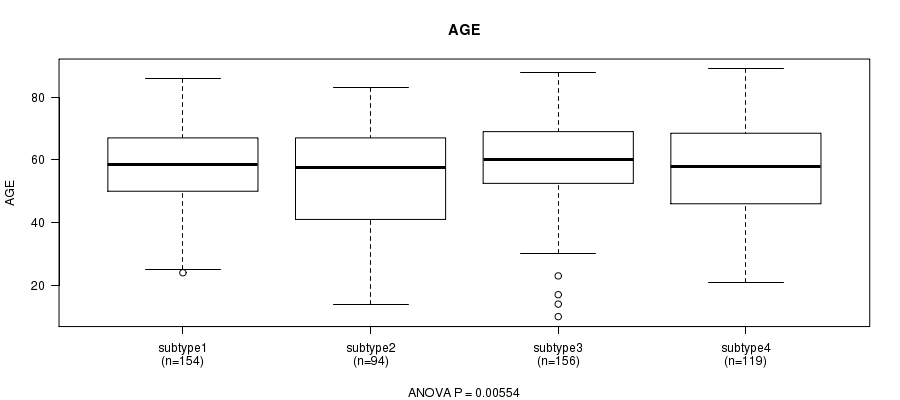
P value = 0.00554 (ANOVA), Q value = 0.32
Table S3. Clustering Approach #1: 'mRNA CNMF subtypes' versus Clinical Feature #2: 'AGE'
| nPatients | Mean (Std.Dev) | |
|---|---|---|
| ALL | 523 | 57.8 (14.5) |
| subtype1 | 154 | 58.4 (12.4) |
| subtype2 | 94 | 53.7 (17.2) |
| subtype3 | 156 | 60.2 (13.3) |
| subtype4 | 119 | 56.8 (15.5) |
Figure S2. Get High-res Image Clustering Approach #1: 'mRNA CNMF subtypes' versus Clinical Feature #2: 'AGE'
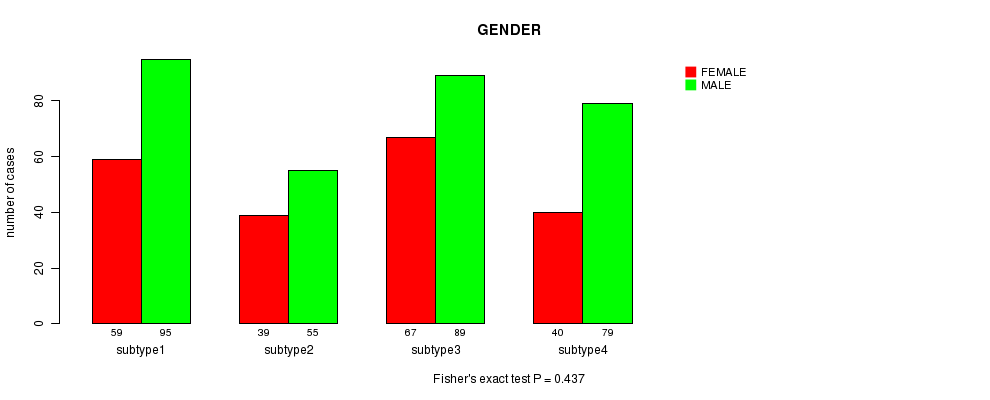
P value = 0.437 (Fisher's exact test), Q value = 1
Table S4. Clustering Approach #1: 'mRNA CNMF subtypes' versus Clinical Feature #3: 'GENDER'
| nPatients | FEMALE | MALE |
|---|---|---|
| ALL | 205 | 318 |
| subtype1 | 59 | 95 |
| subtype2 | 39 | 55 |
| subtype3 | 67 | 89 |
| subtype4 | 40 | 79 |
Figure S3. Get High-res Image Clustering Approach #1: 'mRNA CNMF subtypes' versus Clinical Feature #3: 'GENDER'
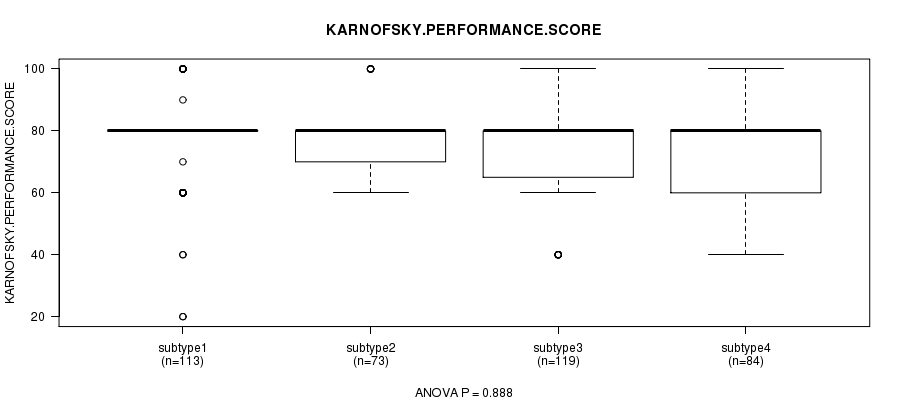
P value = 0.888 (ANOVA), Q value = 1
Table S5. Clustering Approach #1: 'mRNA CNMF subtypes' versus Clinical Feature #4: 'KARNOFSKY.PERFORMANCE.SCORE'
| nPatients | Mean (Std.Dev) | |
|---|---|---|
| ALL | 389 | 77.1 (14.4) |
| subtype1 | 113 | 77.9 (15.5) |
| subtype2 | 73 | 76.7 (10.9) |
| subtype3 | 119 | 76.5 (15.2) |
| subtype4 | 84 | 77.4 (14.5) |
Figure S4. Get High-res Image Clustering Approach #1: 'mRNA CNMF subtypes' versus Clinical Feature #4: 'KARNOFSKY.PERFORMANCE.SCORE'
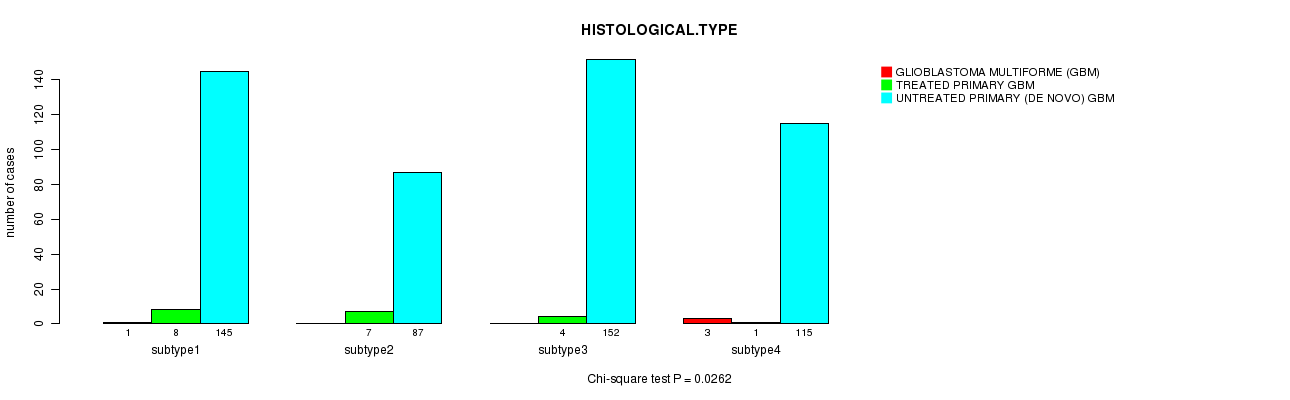
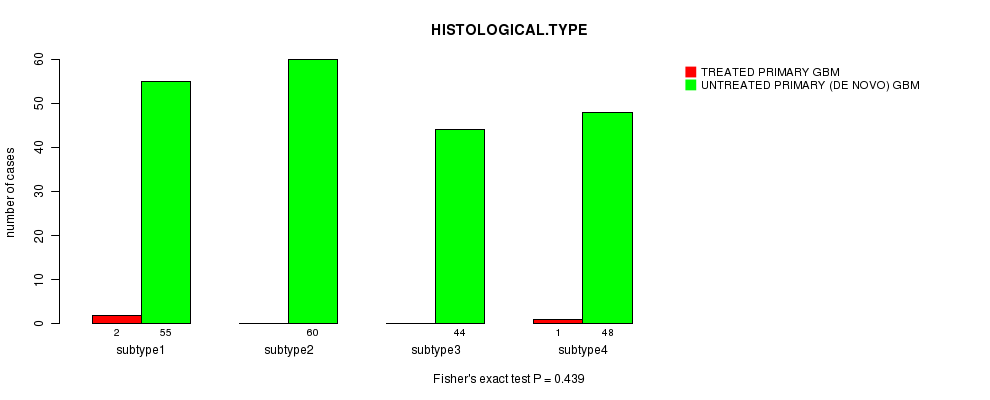
P value = 0.0262 (Chi-square test), Q value = 1
Table S6. Clustering Approach #1: 'mRNA CNMF subtypes' versus Clinical Feature #5: 'HISTOLOGICAL.TYPE'
| nPatients | GLIOBLASTOMA MULTIFORME (GBM) | TREATED PRIMARY GBM | UNTREATED PRIMARY (DE NOVO) GBM |
|---|---|---|---|
| ALL | 4 | 20 | 499 |
| subtype1 | 1 | 8 | 145 |
| subtype2 | 0 | 7 | 87 |
| subtype3 | 0 | 4 | 152 |
| subtype4 | 3 | 1 | 115 |
Figure S5. Get High-res Image Clustering Approach #1: 'mRNA CNMF subtypes' versus Clinical Feature #5: 'HISTOLOGICAL.TYPE'
P value = 0.15 (Fisher's exact test), Q value = 1
Table S7. Clustering Approach #1: 'mRNA CNMF subtypes' versus Clinical Feature #6: 'RADIATIONS.RADIATION.REGIMENINDICATION'
| nPatients | NO | YES |
|---|---|---|
| ALL | 358 | 165 |
| subtype1 | 105 | 49 |
| subtype2 | 64 | 30 |
| subtype3 | 116 | 40 |
| subtype4 | 73 | 46 |
Figure S6. Get High-res Image Clustering Approach #1: 'mRNA CNMF subtypes' versus Clinical Feature #6: 'RADIATIONS.RADIATION.REGIMENINDICATION'
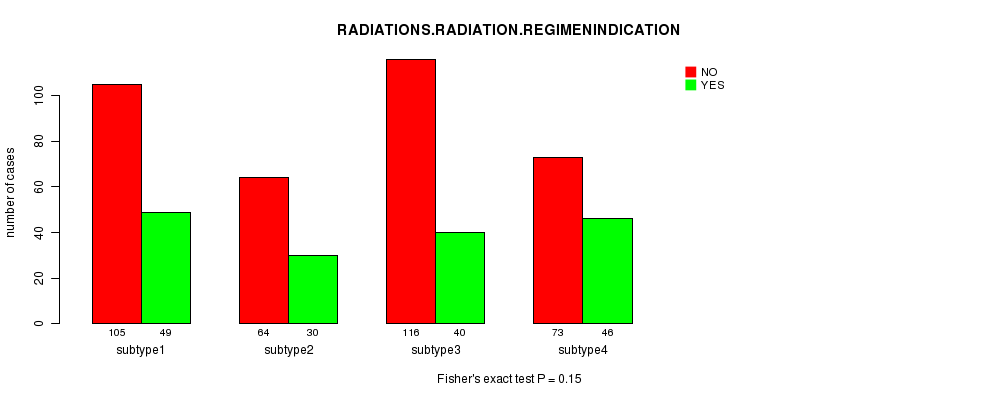
Table S8. Get Full Table Description of clustering approach #2: 'mRNA cHierClus subtypes'
| Cluster Labels | 1 | 2 | 3 |
|---|---|---|---|
| Number of samples | 131 | 172 | 220 |
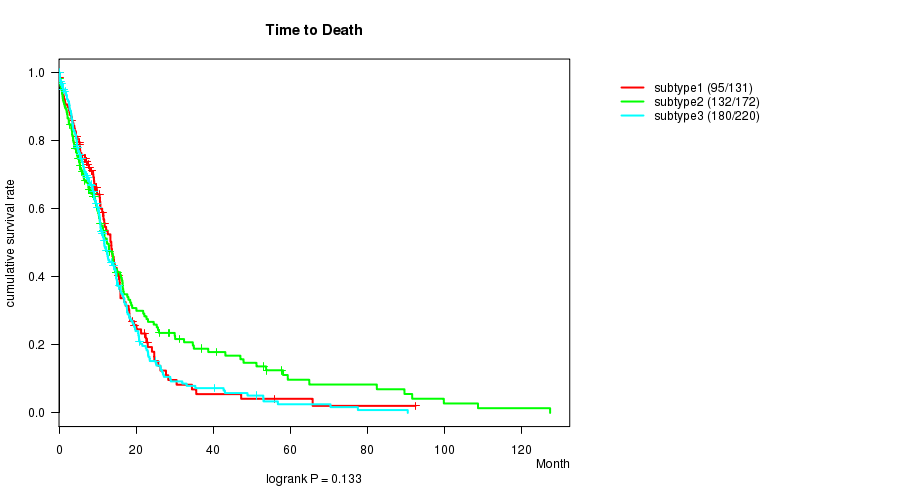
P value = 0.133 (logrank test), Q value = 1
Table S9. Clustering Approach #2: 'mRNA cHierClus subtypes' versus Clinical Feature #1: 'Time to Death'
| nPatients | nDeath | Duration Range (Median), Month | |
|---|---|---|---|
| ALL | 523 | 407 | 0.1 - 127.6 (9.9) |
| subtype1 | 131 | 95 | 0.1 - 92.6 (9.7) |
| subtype2 | 172 | 132 | 0.2 - 127.6 (9.4) |
| subtype3 | 220 | 180 | 0.1 - 90.6 (10.3) |
Figure S7. Get High-res Image Clustering Approach #2: 'mRNA cHierClus subtypes' versus Clinical Feature #1: 'Time to Death'
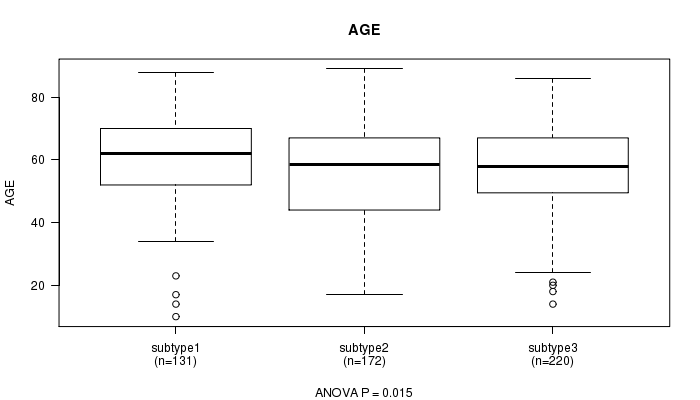
P value = 0.015 (ANOVA), Q value = 0.84
Table S10. Clustering Approach #2: 'mRNA cHierClus subtypes' versus Clinical Feature #2: 'AGE'
| nPatients | Mean (Std.Dev) | |
|---|---|---|
| ALL | 523 | 57.8 (14.5) |
| subtype1 | 131 | 60.6 (13.7) |
| subtype2 | 172 | 55.8 (16.0) |
| subtype3 | 220 | 57.6 (13.5) |
Figure S8. Get High-res Image Clustering Approach #2: 'mRNA cHierClus subtypes' versus Clinical Feature #2: 'AGE'
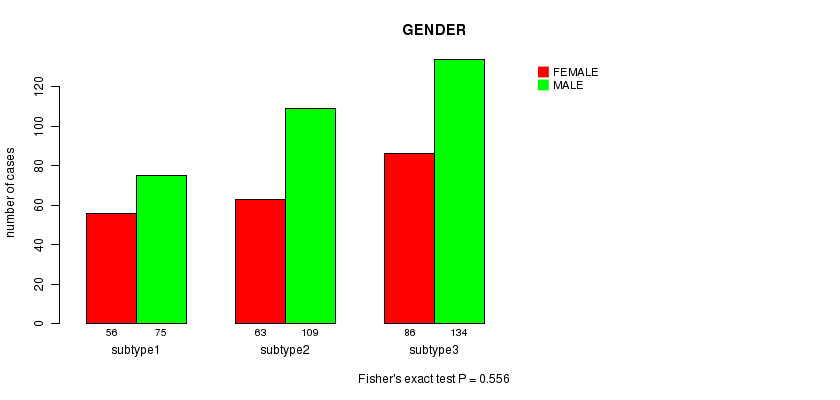
P value = 0.556 (Fisher's exact test), Q value = 1
Table S11. Clustering Approach #2: 'mRNA cHierClus subtypes' versus Clinical Feature #3: 'GENDER'
| nPatients | FEMALE | MALE |
|---|---|---|
| ALL | 205 | 318 |
| subtype1 | 56 | 75 |
| subtype2 | 63 | 109 |
| subtype3 | 86 | 134 |
Figure S9. Get High-res Image Clustering Approach #2: 'mRNA cHierClus subtypes' versus Clinical Feature #3: 'GENDER'
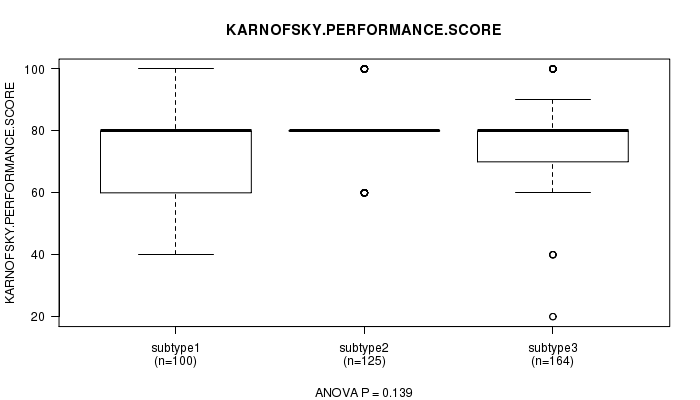
P value = 0.139 (ANOVA), Q value = 1
Table S12. Clustering Approach #2: 'mRNA cHierClus subtypes' versus Clinical Feature #4: 'KARNOFSKY.PERFORMANCE.SCORE'
| nPatients | Mean (Std.Dev) | |
|---|---|---|
| ALL | 389 | 77.1 (14.4) |
| subtype1 | 100 | 74.9 (15.8) |
| subtype2 | 125 | 78.7 (12.4) |
| subtype3 | 164 | 77.3 (14.8) |
Figure S10. Get High-res Image Clustering Approach #2: 'mRNA cHierClus subtypes' versus Clinical Feature #4: 'KARNOFSKY.PERFORMANCE.SCORE'
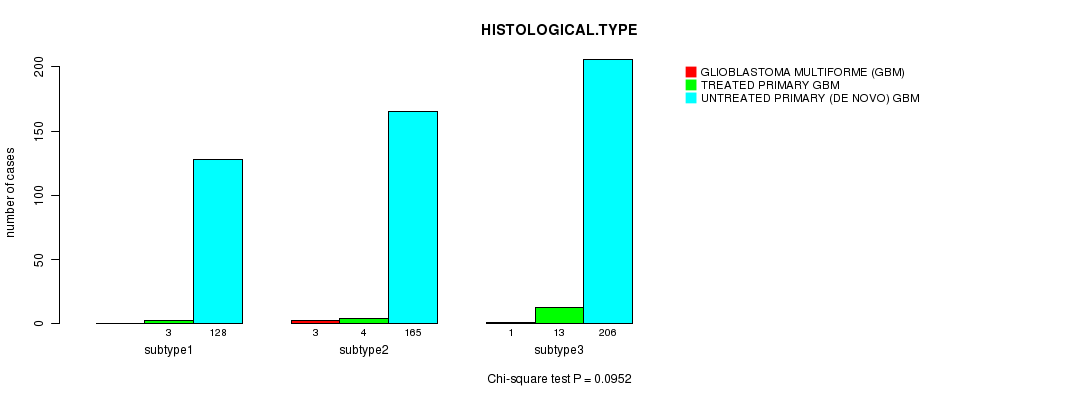
P value = 0.0952 (Chi-square test), Q value = 1
Table S13. Clustering Approach #2: 'mRNA cHierClus subtypes' versus Clinical Feature #5: 'HISTOLOGICAL.TYPE'
| nPatients | GLIOBLASTOMA MULTIFORME (GBM) | TREATED PRIMARY GBM | UNTREATED PRIMARY (DE NOVO) GBM |
|---|---|---|---|
| ALL | 4 | 20 | 499 |
| subtype1 | 0 | 3 | 128 |
| subtype2 | 3 | 4 | 165 |
| subtype3 | 1 | 13 | 206 |
Figure S11. Get High-res Image Clustering Approach #2: 'mRNA cHierClus subtypes' versus Clinical Feature #5: 'HISTOLOGICAL.TYPE'
P value = 0.112 (Fisher's exact test), Q value = 1
Table S14. Clustering Approach #2: 'mRNA cHierClus subtypes' versus Clinical Feature #6: 'RADIATIONS.RADIATION.REGIMENINDICATION'
| nPatients | NO | YES |
|---|---|---|
| ALL | 358 | 165 |
| subtype1 | 90 | 41 |
| subtype2 | 108 | 64 |
| subtype3 | 160 | 60 |
Figure S12. Get High-res Image Clustering Approach #2: 'mRNA cHierClus subtypes' versus Clinical Feature #6: 'RADIATIONS.RADIATION.REGIMENINDICATION'
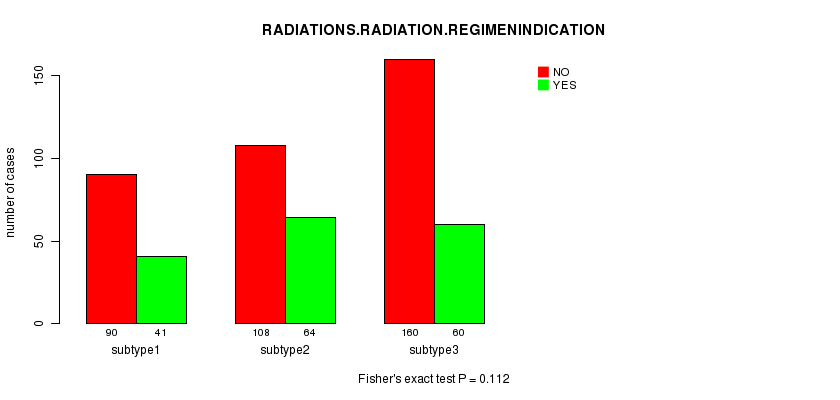
Table S15. Get Full Table Description of clustering approach #3: 'miR CNMF subtypes'
| Cluster Labels | 1 | 2 | 3 | 4 |
|---|---|---|---|---|
| Number of samples | 146 | 159 | 76 | 107 |
P value = 0.00772 (logrank test), Q value = 0.44
Table S16. Clustering Approach #3: 'miR CNMF subtypes' versus Clinical Feature #1: 'Time to Death'
| nPatients | nDeath | Duration Range (Median), Month | |
|---|---|---|---|
| ALL | 488 | 385 | 0.1 - 127.6 (10.3) |
| subtype1 | 146 | 118 | 0.1 - 51.3 (10.6) |
| subtype2 | 159 | 124 | 0.1 - 127.6 (10.6) |
| subtype3 | 76 | 59 | 0.1 - 53.8 (8.4) |
| subtype4 | 107 | 84 | 0.1 - 92.6 (10.8) |
Figure S13. Get High-res Image Clustering Approach #3: 'miR CNMF subtypes' versus Clinical Feature #1: 'Time to Death'
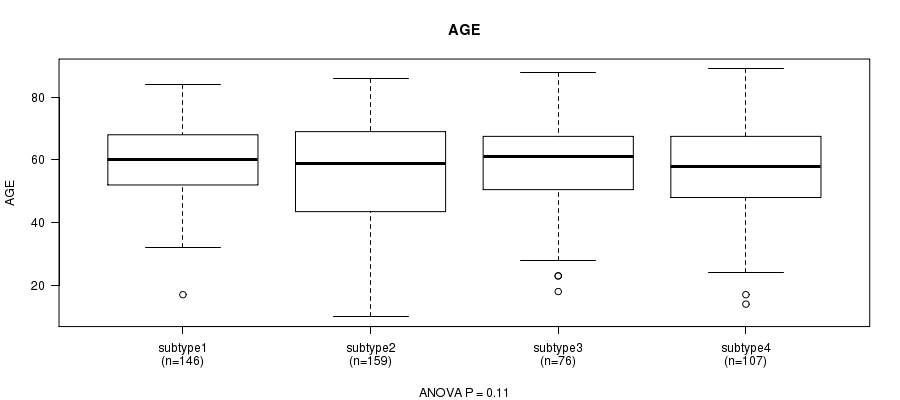
P value = 0.11 (ANOVA), Q value = 1
Table S17. Clustering Approach #3: 'miR CNMF subtypes' versus Clinical Feature #2: 'AGE'
| nPatients | Mean (Std.Dev) | |
|---|---|---|
| ALL | 488 | 57.6 (14.7) |
| subtype1 | 146 | 59.6 (11.6) |
| subtype2 | 159 | 55.5 (17.0) |
| subtype3 | 76 | 58.2 (15.4) |
| subtype4 | 107 | 57.6 (13.9) |
Figure S14. Get High-res Image Clustering Approach #3: 'miR CNMF subtypes' versus Clinical Feature #2: 'AGE'
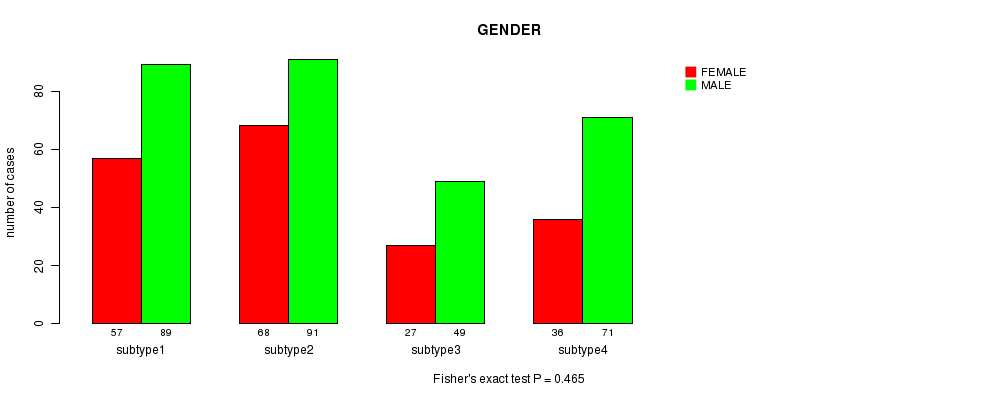
P value = 0.465 (Fisher's exact test), Q value = 1
Table S18. Clustering Approach #3: 'miR CNMF subtypes' versus Clinical Feature #3: 'GENDER'
| nPatients | FEMALE | MALE |
|---|---|---|
| ALL | 188 | 300 |
| subtype1 | 57 | 89 |
| subtype2 | 68 | 91 |
| subtype3 | 27 | 49 |
| subtype4 | 36 | 71 |
Figure S15. Get High-res Image Clustering Approach #3: 'miR CNMF subtypes' versus Clinical Feature #3: 'GENDER'
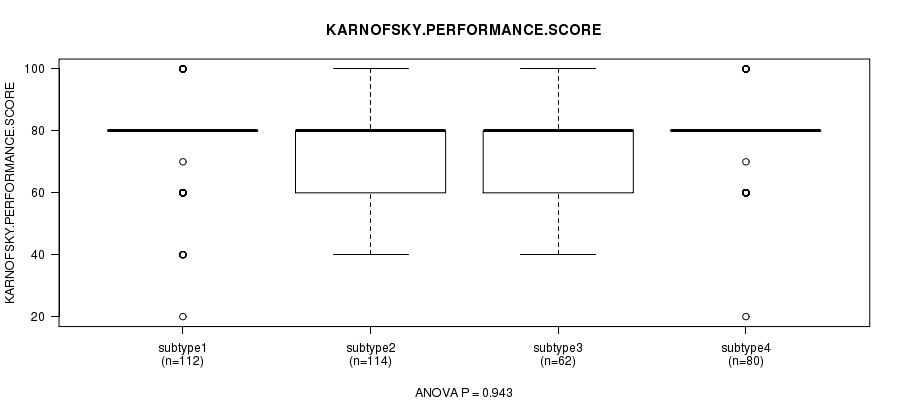
P value = 0.943 (ANOVA), Q value = 1
Table S19. Clustering Approach #3: 'miR CNMF subtypes' versus Clinical Feature #4: 'KARNOFSKY.PERFORMANCE.SCORE'
| nPatients | Mean (Std.Dev) | |
|---|---|---|
| ALL | 368 | 77.6 (14.1) |
| subtype1 | 112 | 77.6 (14.4) |
| subtype2 | 114 | 77.5 (14.1) |
| subtype3 | 62 | 76.9 (14.4) |
| subtype4 | 80 | 78.4 (13.8) |
Figure S16. Get High-res Image Clustering Approach #3: 'miR CNMF subtypes' versus Clinical Feature #4: 'KARNOFSKY.PERFORMANCE.SCORE'
P value = 0.257 (Chi-square test), Q value = 1
Table S20. Clustering Approach #3: 'miR CNMF subtypes' versus Clinical Feature #5: 'HISTOLOGICAL.TYPE'
| nPatients | GLIOBLASTOMA MULTIFORME (GBM) | TREATED PRIMARY GBM | UNTREATED PRIMARY (DE NOVO) GBM |
|---|---|---|---|
| ALL | 6 | 20 | 462 |
| subtype1 | 2 | 3 | 141 |
| subtype2 | 0 | 9 | 150 |
| subtype3 | 2 | 5 | 69 |
| subtype4 | 2 | 3 | 102 |
Figure S17. Get High-res Image Clustering Approach #3: 'miR CNMF subtypes' versus Clinical Feature #5: 'HISTOLOGICAL.TYPE'
P value = 0.355 (Fisher's exact test), Q value = 1
Table S21. Clustering Approach #3: 'miR CNMF subtypes' versus Clinical Feature #6: 'RADIATIONS.RADIATION.REGIMENINDICATION'
| nPatients | NO | YES |
|---|---|---|
| ALL | 336 | 152 |
| subtype1 | 105 | 41 |
| subtype2 | 112 | 47 |
| subtype3 | 46 | 30 |
| subtype4 | 73 | 34 |
Figure S18. Get High-res Image Clustering Approach #3: 'miR CNMF subtypes' versus Clinical Feature #6: 'RADIATIONS.RADIATION.REGIMENINDICATION'
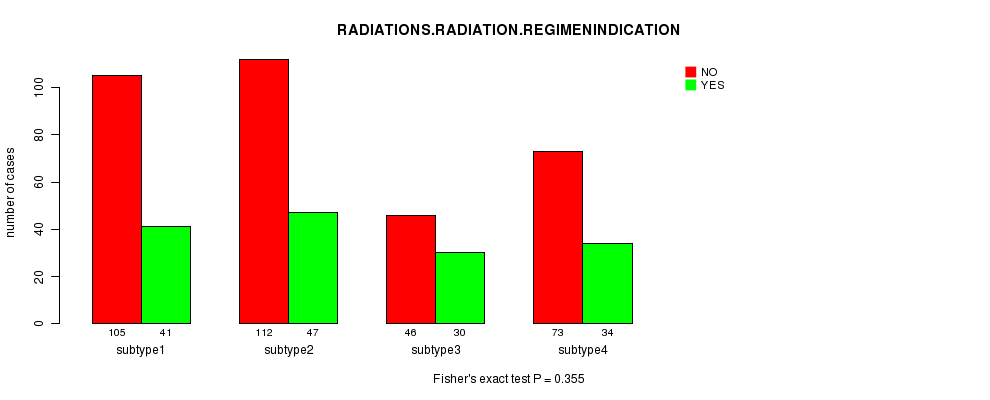
Table S22. Get Full Table Description of clustering approach #4: 'miR cHierClus subtypes'
| Cluster Labels | 1 | 2 | 3 |
|---|---|---|---|
| Number of samples | 173 | 181 | 134 |
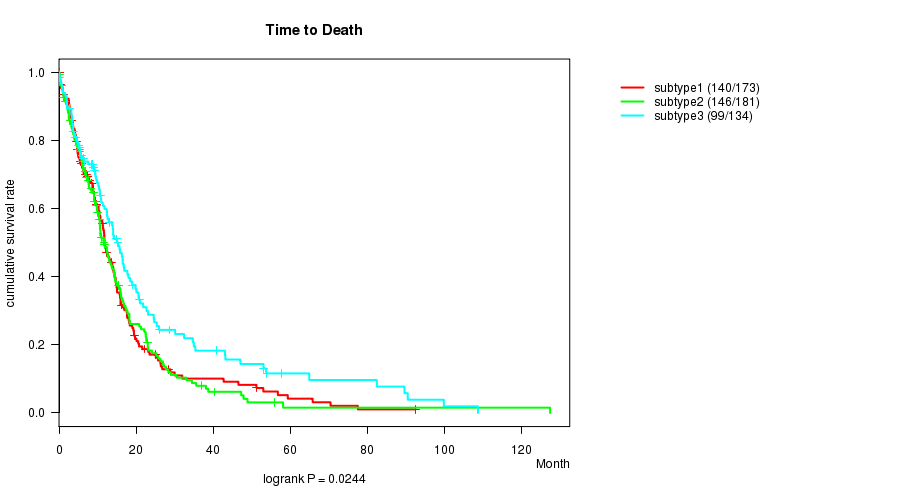
P value = 0.0244 (logrank test), Q value = 1
Table S23. Clustering Approach #4: 'miR cHierClus subtypes' versus Clinical Feature #1: 'Time to Death'
| nPatients | nDeath | Duration Range (Median), Month | |
|---|---|---|---|
| ALL | 488 | 385 | 0.1 - 127.6 (10.3) |
| subtype1 | 173 | 140 | 0.1 - 92.6 (9.9) |
| subtype2 | 181 | 146 | 0.1 - 127.6 (9.9) |
| subtype3 | 134 | 99 | 0.1 - 108.8 (10.7) |
Figure S19. Get High-res Image Clustering Approach #4: 'miR cHierClus subtypes' versus Clinical Feature #1: 'Time to Death'
P value = 0.00151 (ANOVA), Q value = 0.089
Table S24. Clustering Approach #4: 'miR cHierClus subtypes' versus Clinical Feature #2: 'AGE'
| nPatients | Mean (Std.Dev) | |
|---|---|---|
| ALL | 488 | 57.6 (14.7) |
| subtype1 | 173 | 59.1 (12.9) |
| subtype2 | 181 | 59.0 (13.4) |
| subtype3 | 134 | 53.7 (17.6) |
Figure S20. Get High-res Image Clustering Approach #4: 'miR cHierClus subtypes' versus Clinical Feature #2: 'AGE'
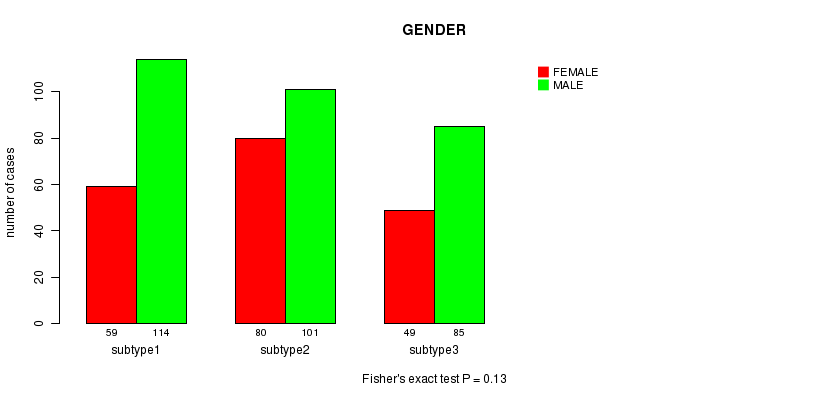
P value = 0.13 (Fisher's exact test), Q value = 1
Table S25. Clustering Approach #4: 'miR cHierClus subtypes' versus Clinical Feature #3: 'GENDER'
| nPatients | FEMALE | MALE |
|---|---|---|
| ALL | 188 | 300 |
| subtype1 | 59 | 114 |
| subtype2 | 80 | 101 |
| subtype3 | 49 | 85 |
Figure S21. Get High-res Image Clustering Approach #4: 'miR cHierClus subtypes' versus Clinical Feature #3: 'GENDER'
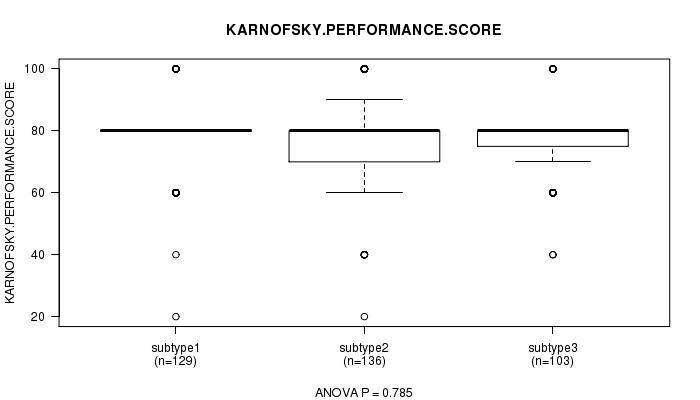
P value = 0.785 (ANOVA), Q value = 1
Table S26. Clustering Approach #4: 'miR cHierClus subtypes' versus Clinical Feature #4: 'KARNOFSKY.PERFORMANCE.SCORE'
| nPatients | Mean (Std.Dev) | |
|---|---|---|
| ALL | 368 | 77.6 (14.1) |
| subtype1 | 129 | 78.3 (13.5) |
| subtype2 | 136 | 77.1 (15.5) |
| subtype3 | 103 | 77.4 (13.1) |
Figure S22. Get High-res Image Clustering Approach #4: 'miR cHierClus subtypes' versus Clinical Feature #4: 'KARNOFSKY.PERFORMANCE.SCORE'
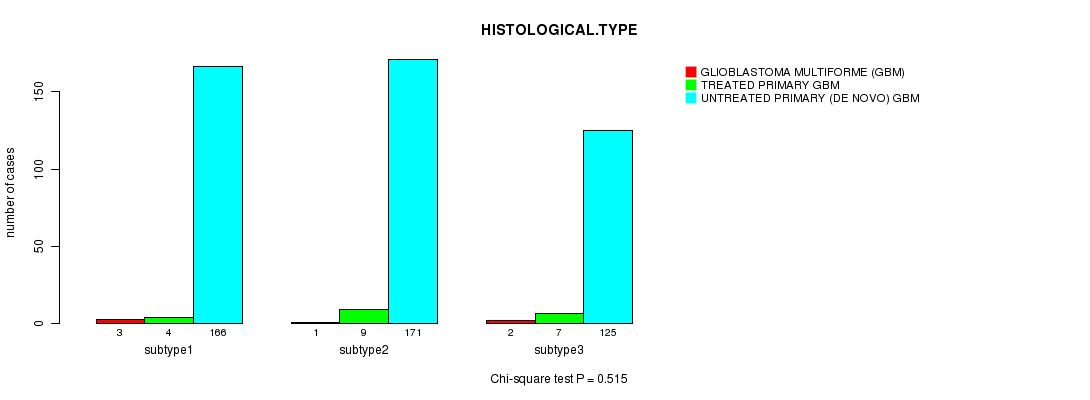
P value = 0.515 (Chi-square test), Q value = 1
Table S27. Clustering Approach #4: 'miR cHierClus subtypes' versus Clinical Feature #5: 'HISTOLOGICAL.TYPE'
| nPatients | GLIOBLASTOMA MULTIFORME (GBM) | TREATED PRIMARY GBM | UNTREATED PRIMARY (DE NOVO) GBM |
|---|---|---|---|
| ALL | 6 | 20 | 462 |
| subtype1 | 3 | 4 | 166 |
| subtype2 | 1 | 9 | 171 |
| subtype3 | 2 | 7 | 125 |
Figure S23. Get High-res Image Clustering Approach #4: 'miR cHierClus subtypes' versus Clinical Feature #5: 'HISTOLOGICAL.TYPE'
P value = 0.833 (Fisher's exact test), Q value = 1
Table S28. Clustering Approach #4: 'miR cHierClus subtypes' versus Clinical Feature #6: 'RADIATIONS.RADIATION.REGIMENINDICATION'
| nPatients | NO | YES |
|---|---|---|
| ALL | 336 | 152 |
| subtype1 | 117 | 56 |
| subtype2 | 124 | 57 |
| subtype3 | 95 | 39 |
Figure S24. Get High-res Image Clustering Approach #4: 'miR cHierClus subtypes' versus Clinical Feature #6: 'RADIATIONS.RADIATION.REGIMENINDICATION'
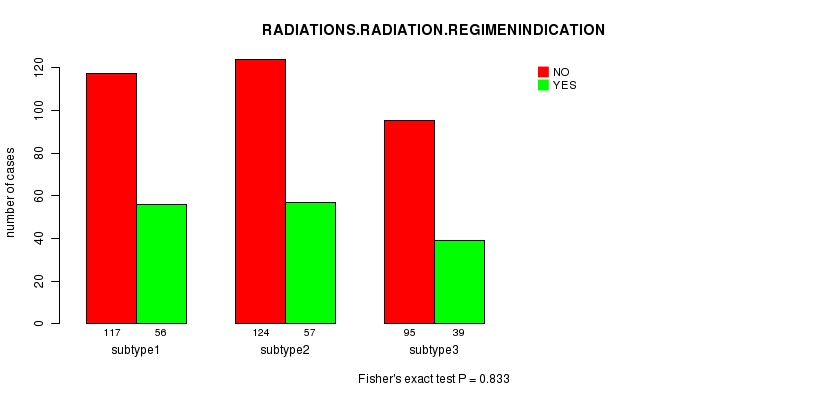
Table S29. Get Full Table Description of clustering approach #5: 'Copy Number Ratio CNMF subtypes'
| Cluster Labels | 1 | 2 | 3 |
|---|---|---|---|
| Number of samples | 159 | 212 | 181 |
P value = 0.0729 (logrank test), Q value = 1
Table S30. Clustering Approach #5: 'Copy Number Ratio CNMF subtypes' versus Clinical Feature #1: 'Time to Death'
| nPatients | nDeath | Duration Range (Median), Month | |
|---|---|---|---|
| ALL | 552 | 419 | 0.1 - 127.6 (9.6) |
| subtype1 | 159 | 125 | 0.1 - 127.6 (9.1) |
| subtype2 | 212 | 162 | 0.1 - 77.6 (10.1) |
| subtype3 | 181 | 132 | 0.1 - 108.8 (9.9) |
Figure S25. Get High-res Image Clustering Approach #5: 'Copy Number Ratio CNMF subtypes' versus Clinical Feature #1: 'Time to Death'
P value = 1.85e-05 (ANOVA), Q value = 0.0011
Table S31. Clustering Approach #5: 'Copy Number Ratio CNMF subtypes' versus Clinical Feature #2: 'AGE'
| nPatients | Mean (Std.Dev) | |
|---|---|---|
| ALL | 552 | 57.9 (14.4) |
| subtype1 | 159 | 59.1 (14.7) |
| subtype2 | 212 | 60.4 (10.8) |
| subtype3 | 181 | 53.9 (16.8) |
Figure S26. Get High-res Image Clustering Approach #5: 'Copy Number Ratio CNMF subtypes' versus Clinical Feature #2: 'AGE'
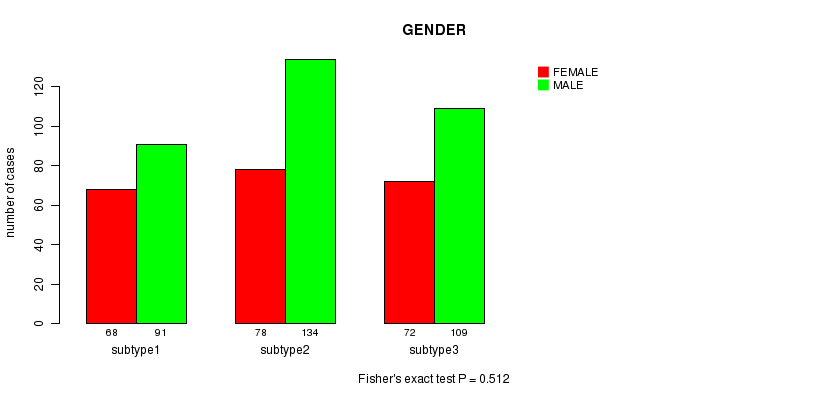
P value = 0.512 (Fisher's exact test), Q value = 1
Table S32. Clustering Approach #5: 'Copy Number Ratio CNMF subtypes' versus Clinical Feature #3: 'GENDER'
| nPatients | FEMALE | MALE |
|---|---|---|
| ALL | 218 | 334 |
| subtype1 | 68 | 91 |
| subtype2 | 78 | 134 |
| subtype3 | 72 | 109 |
Figure S27. Get High-res Image Clustering Approach #5: 'Copy Number Ratio CNMF subtypes' versus Clinical Feature #3: 'GENDER'
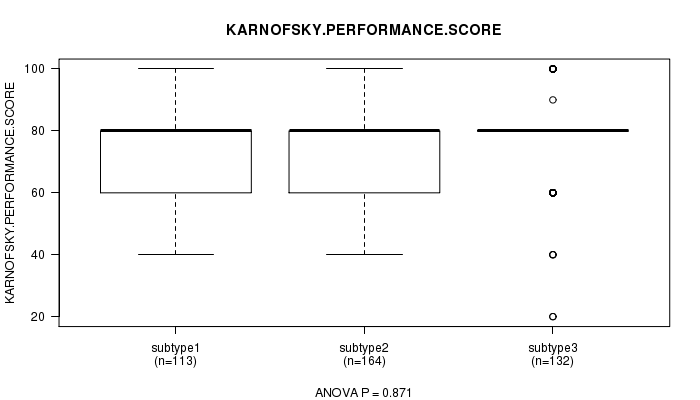
P value = 0.871 (ANOVA), Q value = 1
Table S33. Clustering Approach #5: 'Copy Number Ratio CNMF subtypes' versus Clinical Feature #4: 'KARNOFSKY.PERFORMANCE.SCORE'
| nPatients | Mean (Std.Dev) | |
|---|---|---|
| ALL | 409 | 77.3 (14.7) |
| subtype1 | 113 | 76.8 (14.0) |
| subtype2 | 164 | 77.3 (15.7) |
| subtype3 | 132 | 77.8 (14.2) |
Figure S28. Get High-res Image Clustering Approach #5: 'Copy Number Ratio CNMF subtypes' versus Clinical Feature #4: 'KARNOFSKY.PERFORMANCE.SCORE'
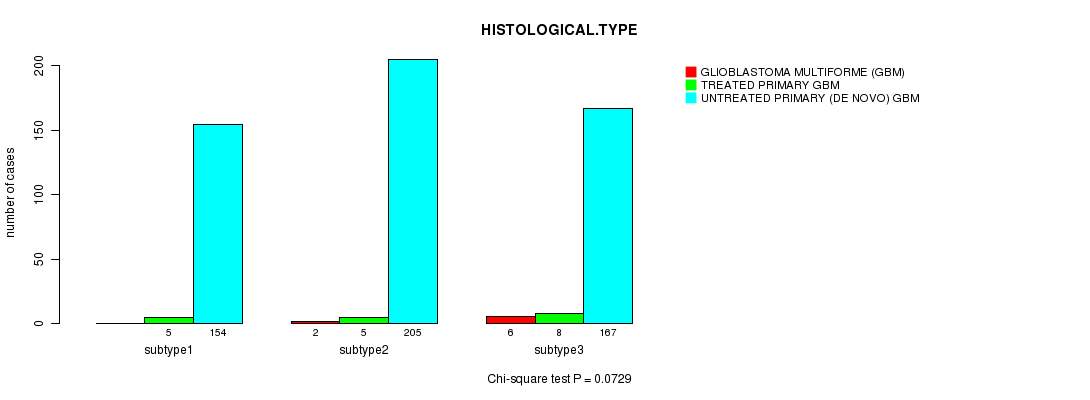
P value = 0.0729 (Chi-square test), Q value = 1
Table S34. Clustering Approach #5: 'Copy Number Ratio CNMF subtypes' versus Clinical Feature #5: 'HISTOLOGICAL.TYPE'
| nPatients | GLIOBLASTOMA MULTIFORME (GBM) | TREATED PRIMARY GBM | UNTREATED PRIMARY (DE NOVO) GBM |
|---|---|---|---|
| ALL | 8 | 18 | 526 |
| subtype1 | 0 | 5 | 154 |
| subtype2 | 2 | 5 | 205 |
| subtype3 | 6 | 8 | 167 |
Figure S29. Get High-res Image Clustering Approach #5: 'Copy Number Ratio CNMF subtypes' versus Clinical Feature #5: 'HISTOLOGICAL.TYPE'
P value = 0.279 (Fisher's exact test), Q value = 1
Table S35. Clustering Approach #5: 'Copy Number Ratio CNMF subtypes' versus Clinical Feature #6: 'RADIATIONS.RADIATION.REGIMENINDICATION'
| nPatients | NO | YES |
|---|---|---|
| ALL | 381 | 171 |
| subtype1 | 102 | 57 |
| subtype2 | 149 | 63 |
| subtype3 | 130 | 51 |
Figure S30. Get High-res Image Clustering Approach #5: 'Copy Number Ratio CNMF subtypes' versus Clinical Feature #6: 'RADIATIONS.RADIATION.REGIMENINDICATION'
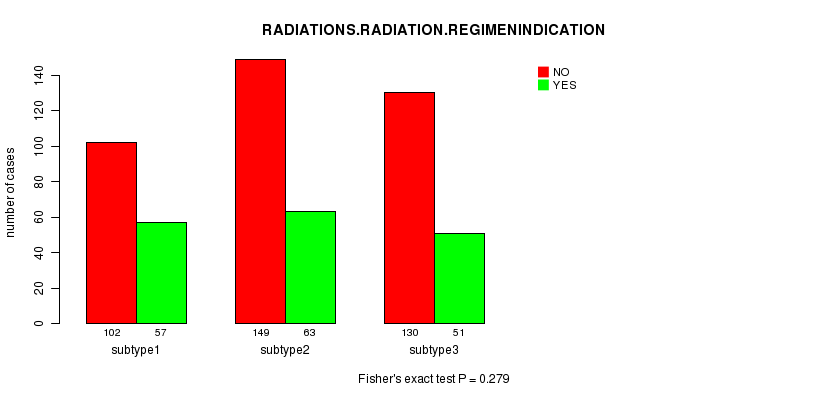
Table S36. Get Full Table Description of clustering approach #6: 'METHLYATION CNMF'
| Cluster Labels | 1 | 2 | 3 | 4 |
|---|---|---|---|---|
| Number of samples | 35 | 27 | 17 | 27 |
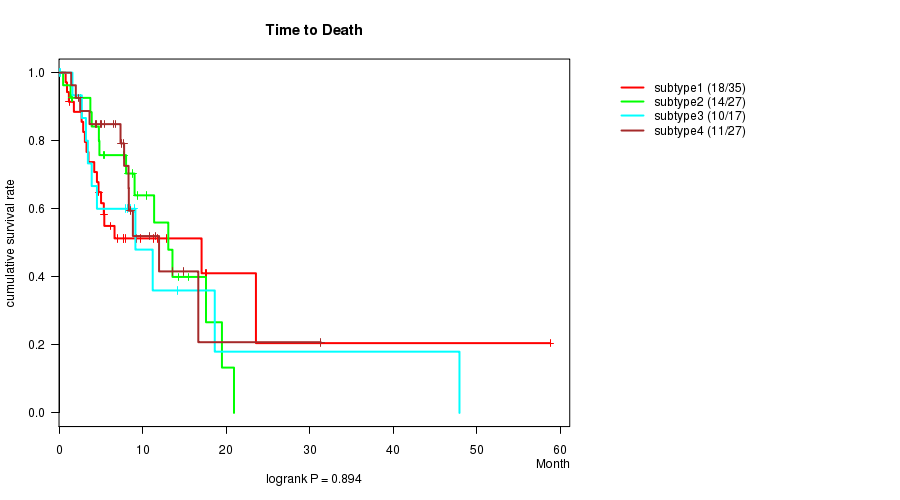
P value = 0.894 (logrank test), Q value = 1
Table S37. Clustering Approach #6: 'METHLYATION CNMF' versus Clinical Feature #1: 'Time to Death'
| nPatients | nDeath | Duration Range (Median), Month | |
|---|---|---|---|
| ALL | 106 | 53 | 0.1 - 58.8 (6.9) |
| subtype1 | 35 | 18 | 0.8 - 58.8 (5.4) |
| subtype2 | 27 | 14 | 0.5 - 20.9 (8.0) |
| subtype3 | 17 | 10 | 0.1 - 47.9 (8.0) |
| subtype4 | 27 | 11 | 1.4 - 31.3 (7.5) |
Figure S31. Get High-res Image Clustering Approach #6: 'METHLYATION CNMF' versus Clinical Feature #1: 'Time to Death'
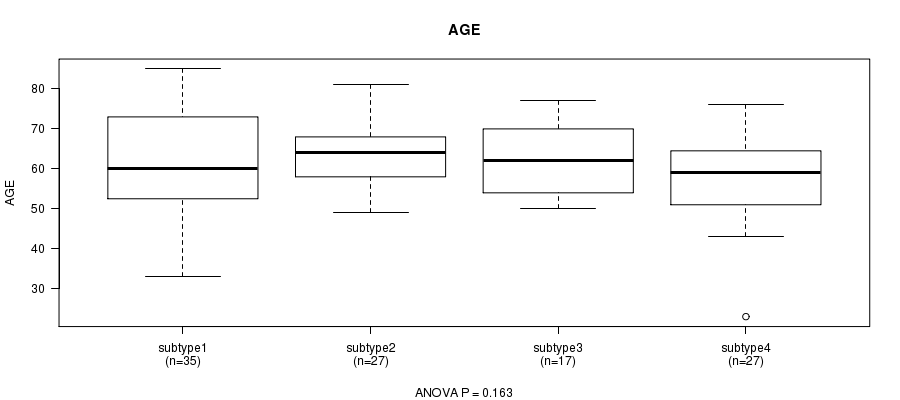
P value = 0.163 (ANOVA), Q value = 1
Table S38. Clustering Approach #6: 'METHLYATION CNMF' versus Clinical Feature #2: 'AGE'
| nPatients | Mean (Std.Dev) | |
|---|---|---|
| ALL | 106 | 61.2 (11.5) |
| subtype1 | 35 | 61.3 (13.9) |
| subtype2 | 27 | 64.1 (8.2) |
| subtype3 | 17 | 62.6 (8.9) |
| subtype4 | 27 | 57.3 (11.8) |
Figure S32. Get High-res Image Clustering Approach #6: 'METHLYATION CNMF' versus Clinical Feature #2: 'AGE'
P value = 0.359 (Fisher's exact test), Q value = 1
Table S39. Clustering Approach #6: 'METHLYATION CNMF' versus Clinical Feature #3: 'GENDER'
| nPatients | FEMALE | MALE |
|---|---|---|
| ALL | 47 | 59 |
| subtype1 | 13 | 22 |
| subtype2 | 11 | 16 |
| subtype3 | 7 | 10 |
| subtype4 | 16 | 11 |
Figure S33. Get High-res Image Clustering Approach #6: 'METHLYATION CNMF' versus Clinical Feature #3: 'GENDER'
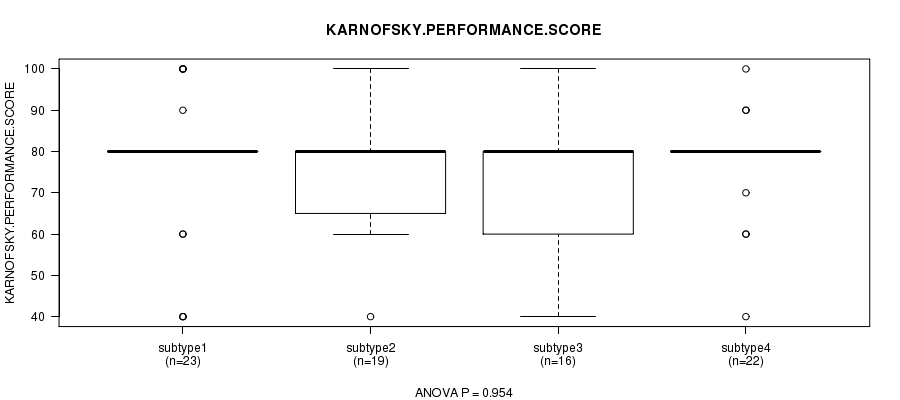
P value = 0.954 (ANOVA), Q value = 1
Table S40. Clustering Approach #6: 'METHLYATION CNMF' versus Clinical Feature #4: 'KARNOFSKY.PERFORMANCE.SCORE'
| nPatients | Mean (Std.Dev) | |
|---|---|---|
| ALL | 80 | 76.5 (15.2) |
| subtype1 | 23 | 77.0 (17.9) |
| subtype2 | 19 | 75.3 (14.7) |
| subtype3 | 16 | 75.6 (16.7) |
| subtype4 | 22 | 77.7 (11.9) |
Figure S34. Get High-res Image Clustering Approach #6: 'METHLYATION CNMF' versus Clinical Feature #4: 'KARNOFSKY.PERFORMANCE.SCORE'
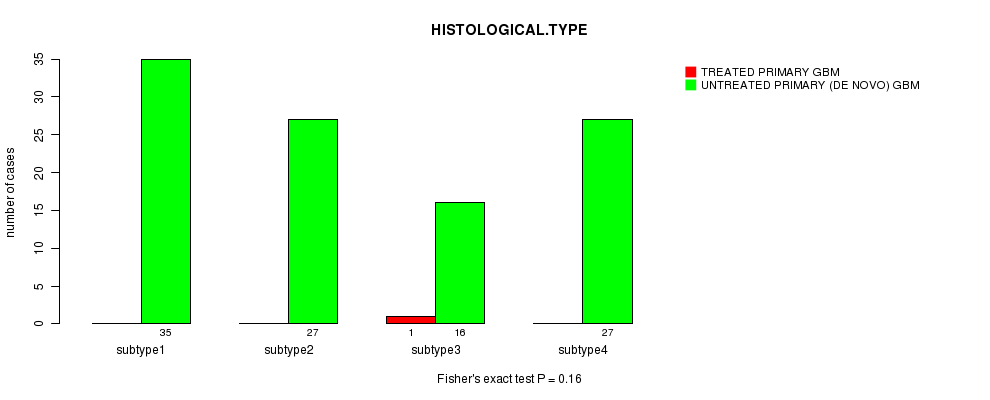
P value = 0.16 (Fisher's exact test), Q value = 1
Table S41. Clustering Approach #6: 'METHLYATION CNMF' versus Clinical Feature #5: 'HISTOLOGICAL.TYPE'
| nPatients | TREATED PRIMARY GBM | UNTREATED PRIMARY (DE NOVO) GBM |
|---|---|---|
| ALL | 1 | 105 |
| subtype1 | 0 | 35 |
| subtype2 | 0 | 27 |
| subtype3 | 1 | 16 |
| subtype4 | 0 | 27 |
Figure S35. Get High-res Image Clustering Approach #6: 'METHLYATION CNMF' versus Clinical Feature #5: 'HISTOLOGICAL.TYPE'
P value = 0.345 (Fisher's exact test), Q value = 1
Table S42. Clustering Approach #6: 'METHLYATION CNMF' versus Clinical Feature #6: 'RADIATIONS.RADIATION.REGIMENINDICATION'
| nPatients | NO | YES |
|---|---|---|
| ALL | 77 | 29 |
| subtype1 | 28 | 7 |
| subtype2 | 16 | 11 |
| subtype3 | 13 | 4 |
| subtype4 | 20 | 7 |
Figure S36. Get High-res Image Clustering Approach #6: 'METHLYATION CNMF' versus Clinical Feature #6: 'RADIATIONS.RADIATION.REGIMENINDICATION'
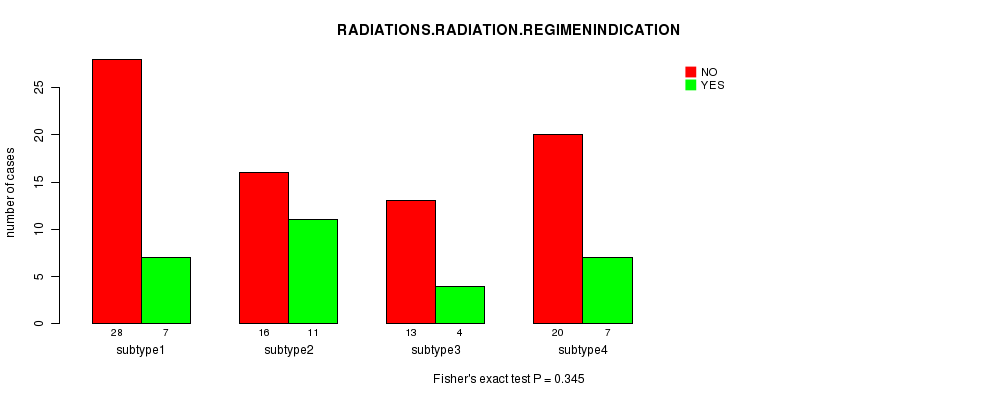
Table S43. Get Full Table Description of clustering approach #7: 'RPPA CNMF subtypes'
| Cluster Labels | 1 | 2 | 3 | 4 |
|---|---|---|---|---|
| Number of samples | 57 | 60 | 44 | 49 |
P value = 0.8 (logrank test), Q value = 1
Table S44. Clustering Approach #7: 'RPPA CNMF subtypes' versus Clinical Feature #1: 'Time to Death'
| nPatients | nDeath | Duration Range (Median), Month | |
|---|---|---|---|
| ALL | 210 | 137 | 0.1 - 108.8 (7.9) |
| subtype1 | 57 | 41 | 0.1 - 53.2 (8.3) |
| subtype2 | 60 | 38 | 0.2 - 108.8 (6.5) |
| subtype3 | 44 | 27 | 0.1 - 43.2 (9.1) |
| subtype4 | 49 | 31 | 0.2 - 47.9 (6.1) |
Figure S37. Get High-res Image Clustering Approach #7: 'RPPA CNMF subtypes' versus Clinical Feature #1: 'Time to Death'
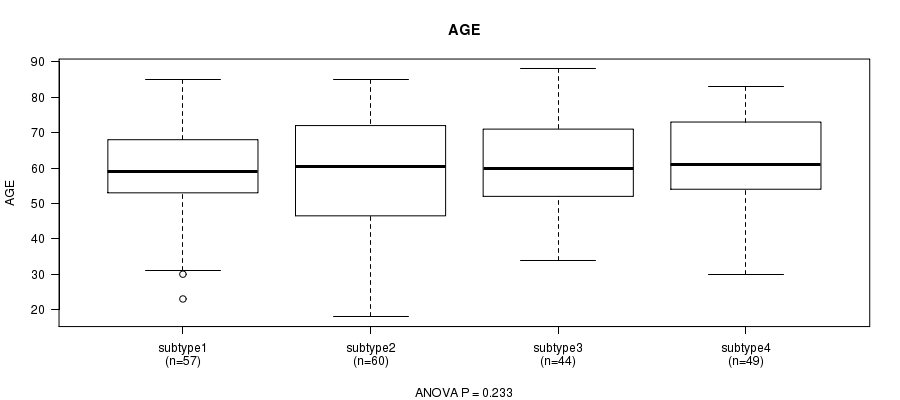
P value = 0.233 (ANOVA), Q value = 1
Table S45. Clustering Approach #7: 'RPPA CNMF subtypes' versus Clinical Feature #2: 'AGE'
| nPatients | Mean (Std.Dev) | |
|---|---|---|
| ALL | 210 | 59.9 (14.1) |
| subtype1 | 57 | 59.2 (13.6) |
| subtype2 | 60 | 57.4 (16.9) |
| subtype3 | 44 | 61.5 (12.2) |
| subtype4 | 49 | 62.5 (12.0) |
Figure S38. Get High-res Image Clustering Approach #7: 'RPPA CNMF subtypes' versus Clinical Feature #2: 'AGE'
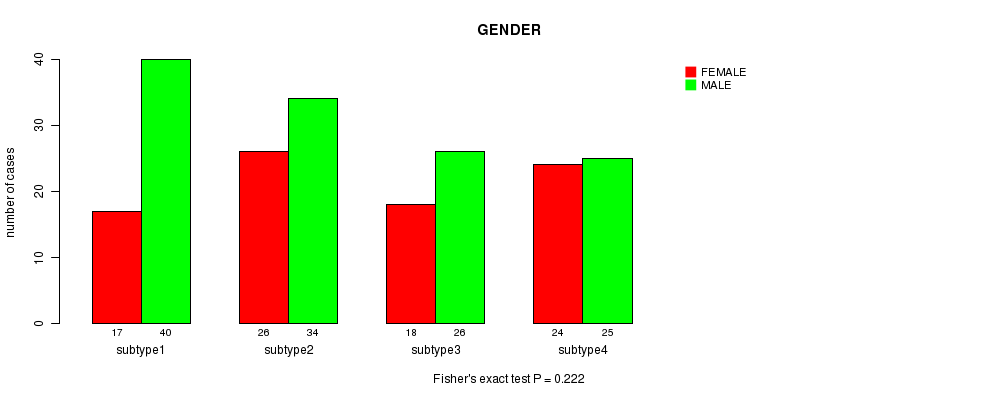
P value = 0.222 (Fisher's exact test), Q value = 1
Table S46. Clustering Approach #7: 'RPPA CNMF subtypes' versus Clinical Feature #3: 'GENDER'
| nPatients | FEMALE | MALE |
|---|---|---|
| ALL | 85 | 125 |
| subtype1 | 17 | 40 |
| subtype2 | 26 | 34 |
| subtype3 | 18 | 26 |
| subtype4 | 24 | 25 |
Figure S39. Get High-res Image Clustering Approach #7: 'RPPA CNMF subtypes' versus Clinical Feature #3: 'GENDER'
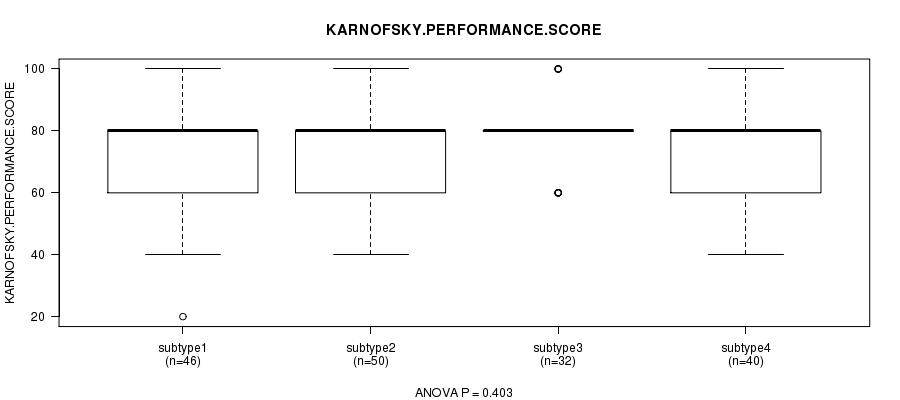
P value = 0.403 (ANOVA), Q value = 1
Table S47. Clustering Approach #7: 'RPPA CNMF subtypes' versus Clinical Feature #4: 'KARNOFSKY.PERFORMANCE.SCORE'
| nPatients | Mean (Std.Dev) | |
|---|---|---|
| ALL | 168 | 75.6 (15.3) |
| subtype1 | 46 | 75.0 (15.9) |
| subtype2 | 50 | 76.4 (16.5) |
| subtype3 | 32 | 78.8 (11.3) |
| subtype4 | 40 | 72.8 (15.8) |
Figure S40. Get High-res Image Clustering Approach #7: 'RPPA CNMF subtypes' versus Clinical Feature #4: 'KARNOFSKY.PERFORMANCE.SCORE'
P value = 0.439 (Fisher's exact test), Q value = 1
Table S48. Clustering Approach #7: 'RPPA CNMF subtypes' versus Clinical Feature #5: 'HISTOLOGICAL.TYPE'
| nPatients | TREATED PRIMARY GBM | UNTREATED PRIMARY (DE NOVO) GBM |
|---|---|---|
| ALL | 3 | 207 |
| subtype1 | 2 | 55 |
| subtype2 | 0 | 60 |
| subtype3 | 0 | 44 |
| subtype4 | 1 | 48 |
Figure S41. Get High-res Image Clustering Approach #7: 'RPPA CNMF subtypes' versus Clinical Feature #5: 'HISTOLOGICAL.TYPE'
P value = 0.296 (Fisher's exact test), Q value = 1
Table S49. Clustering Approach #7: 'RPPA CNMF subtypes' versus Clinical Feature #6: 'RADIATIONS.RADIATION.REGIMENINDICATION'
| nPatients | NO | YES |
|---|---|---|
| ALL | 155 | 55 |
| subtype1 | 42 | 15 |
| subtype2 | 43 | 17 |
| subtype3 | 37 | 7 |
| subtype4 | 33 | 16 |
Figure S42. Get High-res Image Clustering Approach #7: 'RPPA CNMF subtypes' versus Clinical Feature #6: 'RADIATIONS.RADIATION.REGIMENINDICATION'
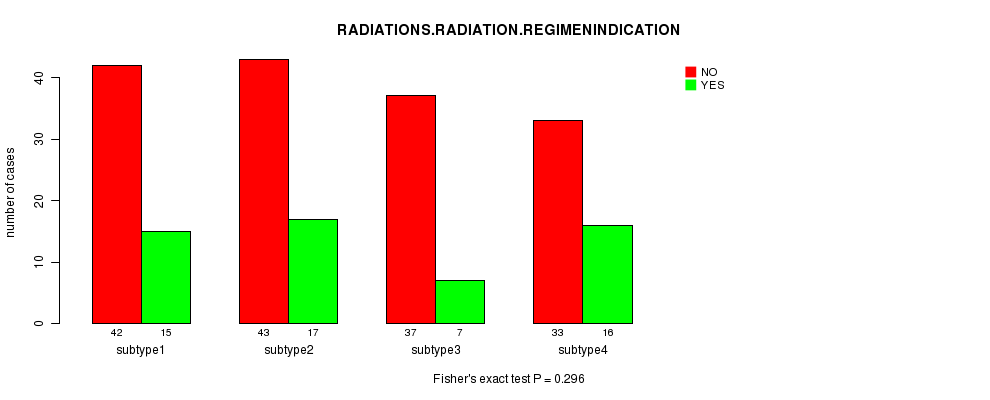
Table S50. Get Full Table Description of clustering approach #8: 'RPPA cHierClus subtypes'
| Cluster Labels | 1 | 2 | 3 |
|---|---|---|---|
| Number of samples | 64 | 35 | 111 |
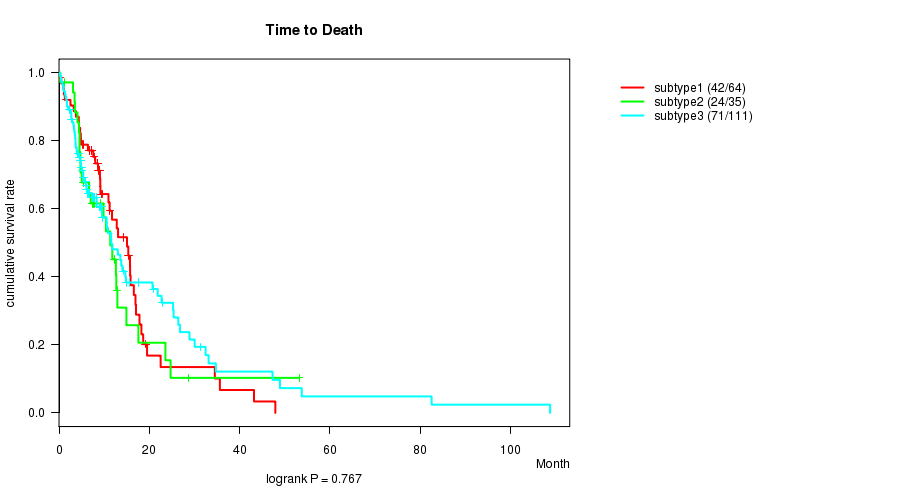
P value = 0.767 (logrank test), Q value = 1
Table S51. Clustering Approach #8: 'RPPA cHierClus subtypes' versus Clinical Feature #1: 'Time to Death'
| nPatients | nDeath | Duration Range (Median), Month | |
|---|---|---|---|
| ALL | 210 | 137 | 0.1 - 108.8 (7.9) |
| subtype1 | 64 | 42 | 0.1 - 47.9 (8.9) |
| subtype2 | 35 | 24 | 0.3 - 53.2 (7.9) |
| subtype3 | 111 | 71 | 0.2 - 108.8 (6.4) |
Figure S43. Get High-res Image Clustering Approach #8: 'RPPA cHierClus subtypes' versus Clinical Feature #1: 'Time to Death'
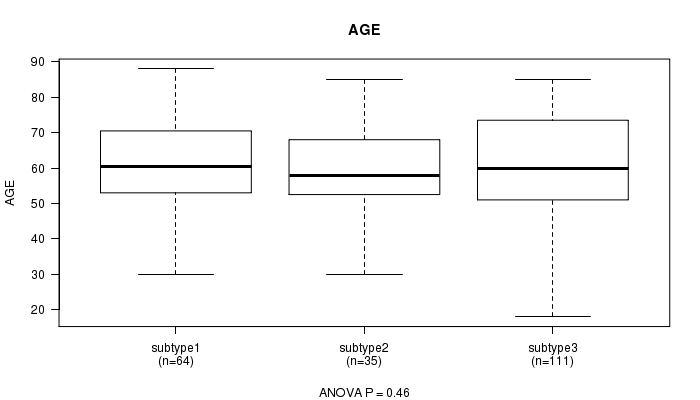
P value = 0.46 (ANOVA), Q value = 1
Table S52. Clustering Approach #8: 'RPPA cHierClus subtypes' versus Clinical Feature #2: 'AGE'
| nPatients | Mean (Std.Dev) | |
|---|---|---|
| ALL | 210 | 59.9 (14.1) |
| subtype1 | 64 | 61.7 (12.1) |
| subtype2 | 35 | 58.4 (13.2) |
| subtype3 | 111 | 59.4 (15.4) |
Figure S44. Get High-res Image Clustering Approach #8: 'RPPA cHierClus subtypes' versus Clinical Feature #2: 'AGE'
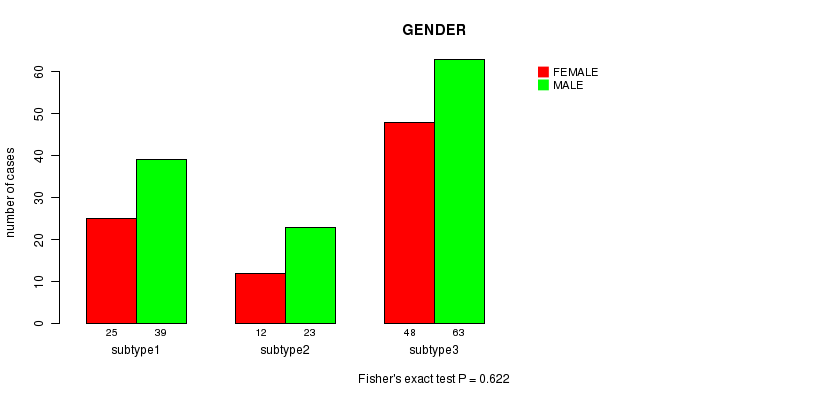
P value = 0.622 (Fisher's exact test), Q value = 1
Table S53. Clustering Approach #8: 'RPPA cHierClus subtypes' versus Clinical Feature #3: 'GENDER'
| nPatients | FEMALE | MALE |
|---|---|---|
| ALL | 85 | 125 |
| subtype1 | 25 | 39 |
| subtype2 | 12 | 23 |
| subtype3 | 48 | 63 |
Figure S45. Get High-res Image Clustering Approach #8: 'RPPA cHierClus subtypes' versus Clinical Feature #3: 'GENDER'
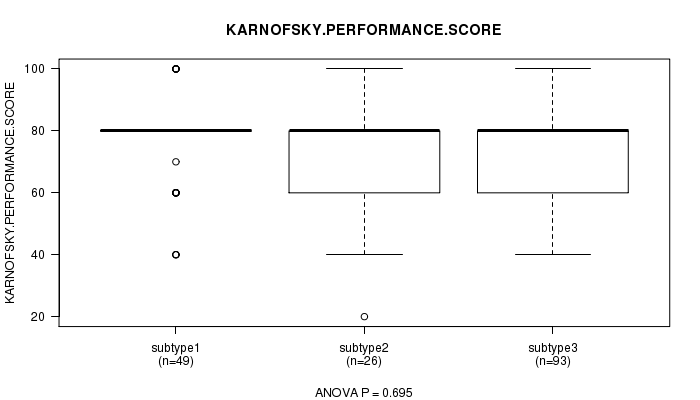
P value = 0.695 (ANOVA), Q value = 1
Table S54. Clustering Approach #8: 'RPPA cHierClus subtypes' versus Clinical Feature #4: 'KARNOFSKY.PERFORMANCE.SCORE'
| nPatients | Mean (Std.Dev) | |
|---|---|---|
| ALL | 168 | 75.6 (15.3) |
| subtype1 | 49 | 76.9 (14.2) |
| subtype2 | 26 | 73.8 (17.7) |
| subtype3 | 93 | 75.4 (15.3) |
Figure S46. Get High-res Image Clustering Approach #8: 'RPPA cHierClus subtypes' versus Clinical Feature #4: 'KARNOFSKY.PERFORMANCE.SCORE'
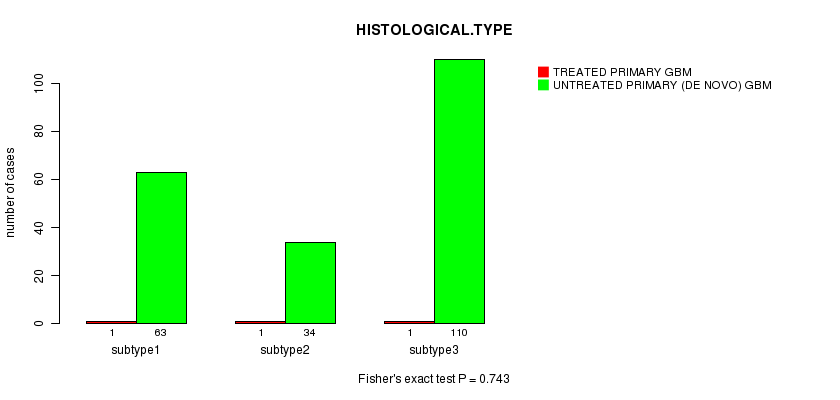
P value = 0.743 (Fisher's exact test), Q value = 1
Table S55. Clustering Approach #8: 'RPPA cHierClus subtypes' versus Clinical Feature #5: 'HISTOLOGICAL.TYPE'
| nPatients | TREATED PRIMARY GBM | UNTREATED PRIMARY (DE NOVO) GBM |
|---|---|---|
| ALL | 3 | 207 |
| subtype1 | 1 | 63 |
| subtype2 | 1 | 34 |
| subtype3 | 1 | 110 |
Figure S47. Get High-res Image Clustering Approach #8: 'RPPA cHierClus subtypes' versus Clinical Feature #5: 'HISTOLOGICAL.TYPE'
P value = 0.623 (Fisher's exact test), Q value = 1
Table S56. Clustering Approach #8: 'RPPA cHierClus subtypes' versus Clinical Feature #6: 'RADIATIONS.RADIATION.REGIMENINDICATION'
| nPatients | NO | YES |
|---|---|---|
| ALL | 155 | 55 |
| subtype1 | 50 | 14 |
| subtype2 | 26 | 9 |
| subtype3 | 79 | 32 |
Figure S48. Get High-res Image Clustering Approach #8: 'RPPA cHierClus subtypes' versus Clinical Feature #6: 'RADIATIONS.RADIATION.REGIMENINDICATION'
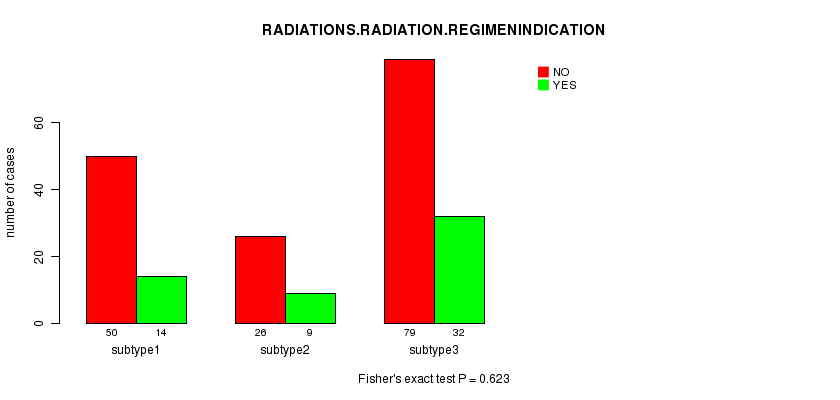
Table S57. Get Full Table Description of clustering approach #9: 'RNAseq CNMF subtypes'
| Cluster Labels | 1 | 2 | 3 |
|---|---|---|---|
| Number of samples | 46 | 70 | 35 |
P value = 0.363 (logrank test), Q value = 1
Table S58. Clustering Approach #9: 'RNAseq CNMF subtypes' versus Clinical Feature #1: 'Time to Death'
| nPatients | nDeath | Duration Range (Median), Month | |
|---|---|---|---|
| ALL | 151 | 98 | 0.2 - 54.0 (8.6) |
| subtype1 | 46 | 29 | 0.2 - 54.0 (8.8) |
| subtype2 | 70 | 45 | 0.9 - 47.9 (9.1) |
| subtype3 | 35 | 24 | 0.2 - 31.3 (6.0) |
Figure S49. Get High-res Image Clustering Approach #9: 'RNAseq CNMF subtypes' versus Clinical Feature #1: 'Time to Death'
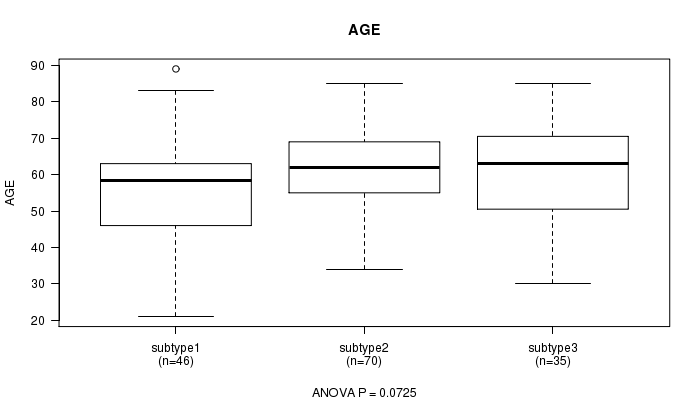
P value = 0.0725 (ANOVA), Q value = 1
Table S59. Clustering Approach #9: 'RNAseq CNMF subtypes' versus Clinical Feature #2: 'AGE'
| nPatients | Mean (Std.Dev) | |
|---|---|---|
| ALL | 151 | 60.0 (13.2) |
| subtype1 | 46 | 56.3 (16.0) |
| subtype2 | 70 | 62.0 (10.6) |
| subtype3 | 35 | 60.9 (13.3) |
Figure S50. Get High-res Image Clustering Approach #9: 'RNAseq CNMF subtypes' versus Clinical Feature #2: 'AGE'
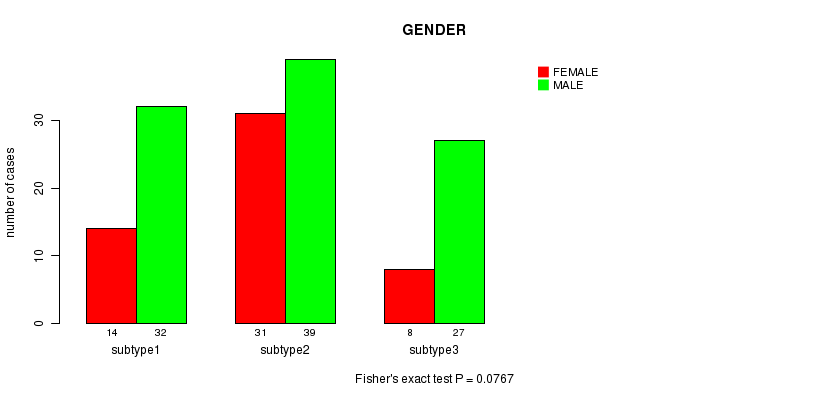
P value = 0.0767 (Fisher's exact test), Q value = 1
Table S60. Clustering Approach #9: 'RNAseq CNMF subtypes' versus Clinical Feature #3: 'GENDER'
| nPatients | FEMALE | MALE |
|---|---|---|
| ALL | 53 | 98 |
| subtype1 | 14 | 32 |
| subtype2 | 31 | 39 |
| subtype3 | 8 | 27 |
Figure S51. Get High-res Image Clustering Approach #9: 'RNAseq CNMF subtypes' versus Clinical Feature #3: 'GENDER'
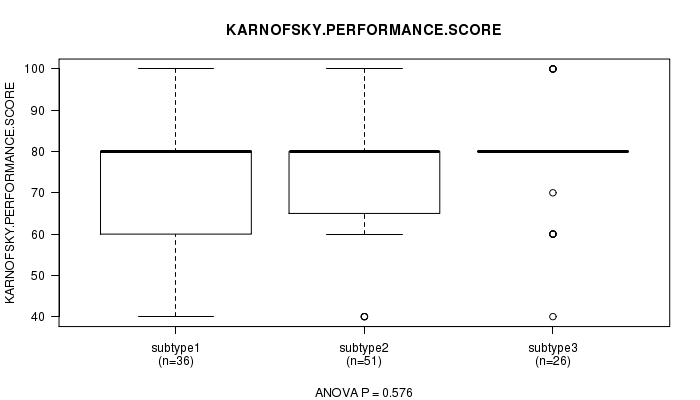
P value = 0.576 (ANOVA), Q value = 1
Table S61. Clustering Approach #9: 'RNAseq CNMF subtypes' versus Clinical Feature #4: 'KARNOFSKY.PERFORMANCE.SCORE'
| nPatients | Mean (Std.Dev) | |
|---|---|---|
| ALL | 113 | 75.8 (14.4) |
| subtype1 | 36 | 74.2 (15.2) |
| subtype2 | 51 | 75.7 (14.2) |
| subtype3 | 26 | 78.1 (13.9) |
Figure S52. Get High-res Image Clustering Approach #9: 'RNAseq CNMF subtypes' versus Clinical Feature #4: 'KARNOFSKY.PERFORMANCE.SCORE'
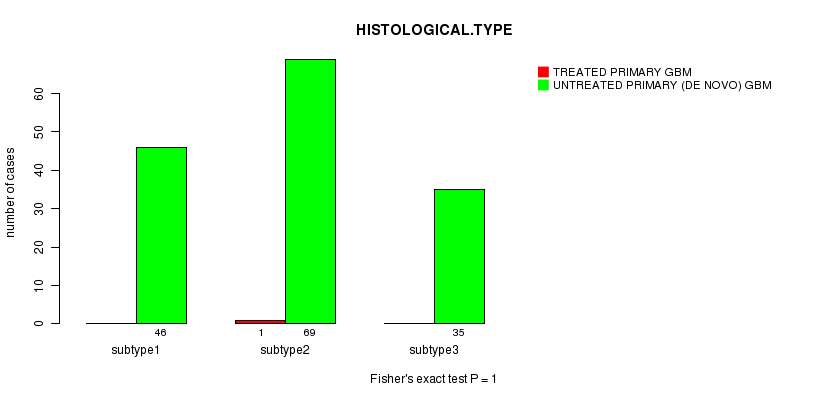
P value = 1 (Fisher's exact test), Q value = 1
Table S62. Clustering Approach #9: 'RNAseq CNMF subtypes' versus Clinical Feature #5: 'HISTOLOGICAL.TYPE'
| nPatients | TREATED PRIMARY GBM | UNTREATED PRIMARY (DE NOVO) GBM |
|---|---|---|
| ALL | 1 | 150 |
| subtype1 | 0 | 46 |
| subtype2 | 1 | 69 |
| subtype3 | 0 | 35 |
Figure S53. Get High-res Image Clustering Approach #9: 'RNAseq CNMF subtypes' versus Clinical Feature #5: 'HISTOLOGICAL.TYPE'
P value = 0.903 (Fisher's exact test), Q value = 1
Table S63. Clustering Approach #9: 'RNAseq CNMF subtypes' versus Clinical Feature #6: 'RADIATIONS.RADIATION.REGIMENINDICATION'
| nPatients | NO | YES |
|---|---|---|
| ALL | 100 | 51 |
| subtype1 | 31 | 15 |
| subtype2 | 47 | 23 |
| subtype3 | 22 | 13 |
Figure S54. Get High-res Image Clustering Approach #9: 'RNAseq CNMF subtypes' versus Clinical Feature #6: 'RADIATIONS.RADIATION.REGIMENINDICATION'
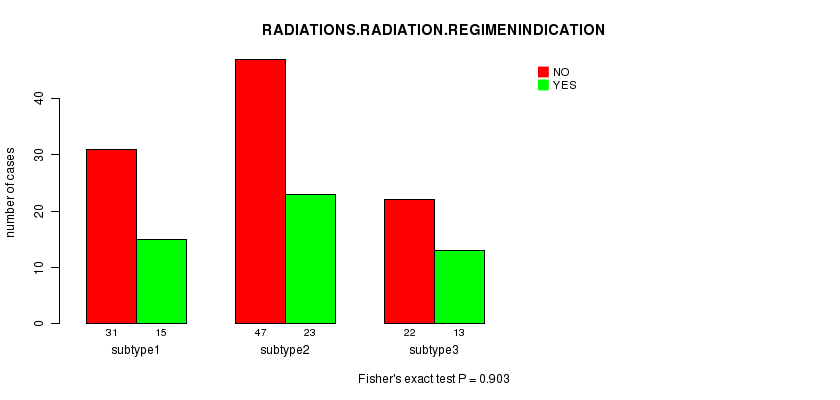
Table S64. Get Full Table Description of clustering approach #10: 'RNAseq cHierClus subtypes'
| Cluster Labels | 1 | 2 | 3 |
|---|---|---|---|
| Number of samples | 69 | 22 | 60 |
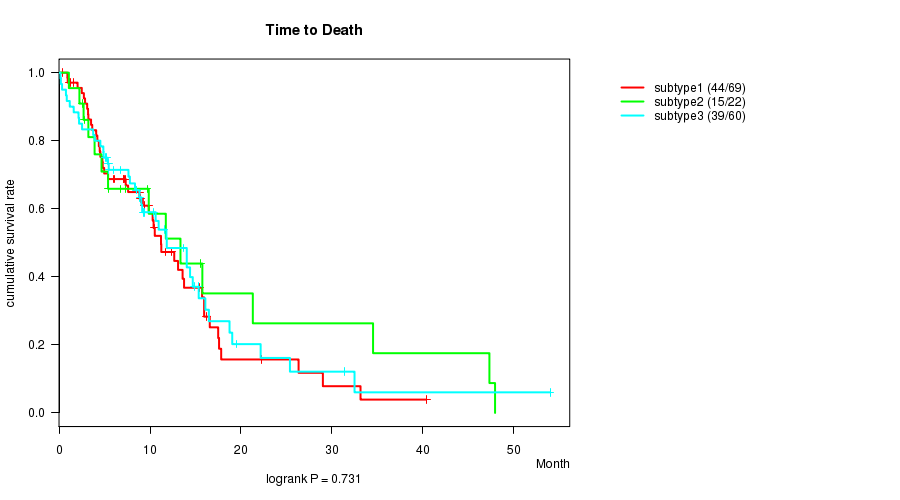
P value = 0.731 (logrank test), Q value = 1
Table S65. Clustering Approach #10: 'RNAseq cHierClus subtypes' versus Clinical Feature #1: 'Time to Death'
| nPatients | nDeath | Duration Range (Median), Month | |
|---|---|---|---|
| ALL | 151 | 98 | 0.2 - 54.0 (8.6) |
| subtype1 | 69 | 44 | 0.4 - 40.4 (7.6) |
| subtype2 | 22 | 15 | 1.1 - 47.9 (7.1) |
| subtype3 | 60 | 39 | 0.2 - 54.0 (8.9) |
Figure S55. Get High-res Image Clustering Approach #10: 'RNAseq cHierClus subtypes' versus Clinical Feature #1: 'Time to Death'
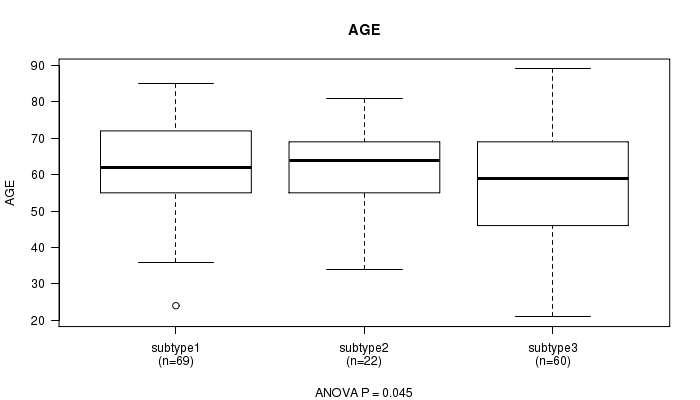
P value = 0.045 (ANOVA), Q value = 1
Table S66. Clustering Approach #10: 'RNAseq cHierClus subtypes' versus Clinical Feature #2: 'AGE'
| nPatients | Mean (Std.Dev) | |
|---|---|---|
| ALL | 151 | 60.0 (13.2) |
| subtype1 | 69 | 62.1 (11.5) |
| subtype2 | 22 | 62.3 (10.5) |
| subtype3 | 60 | 56.7 (15.3) |
Figure S56. Get High-res Image Clustering Approach #10: 'RNAseq cHierClus subtypes' versus Clinical Feature #2: 'AGE'
P value = 0.107 (Fisher's exact test), Q value = 1
Table S67. Clustering Approach #10: 'RNAseq cHierClus subtypes' versus Clinical Feature #3: 'GENDER'
| nPatients | FEMALE | MALE |
|---|---|---|
| ALL | 53 | 98 |
| subtype1 | 29 | 40 |
| subtype2 | 9 | 13 |
| subtype3 | 15 | 45 |
Figure S57. Get High-res Image Clustering Approach #10: 'RNAseq cHierClus subtypes' versus Clinical Feature #3: 'GENDER'
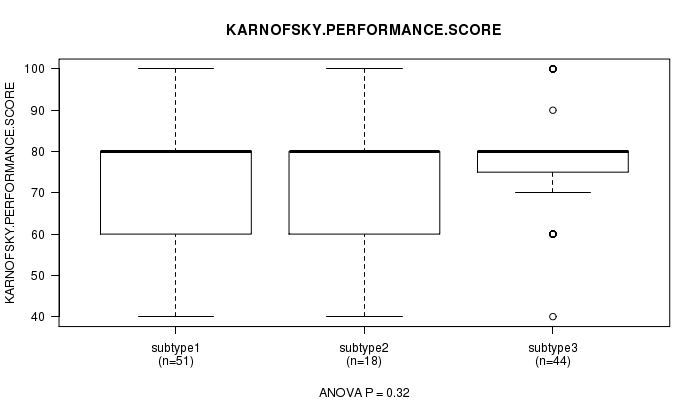
P value = 0.32 (ANOVA), Q value = 1
Table S68. Clustering Approach #10: 'RNAseq cHierClus subtypes' versus Clinical Feature #4: 'KARNOFSKY.PERFORMANCE.SCORE'
| nPatients | Mean (Std.Dev) | |
|---|---|---|
| ALL | 113 | 75.8 (14.4) |
| subtype1 | 51 | 74.7 (14.6) |
| subtype2 | 18 | 72.8 (15.3) |
| subtype3 | 44 | 78.2 (13.7) |
Figure S58. Get High-res Image Clustering Approach #10: 'RNAseq cHierClus subtypes' versus Clinical Feature #4: 'KARNOFSKY.PERFORMANCE.SCORE'
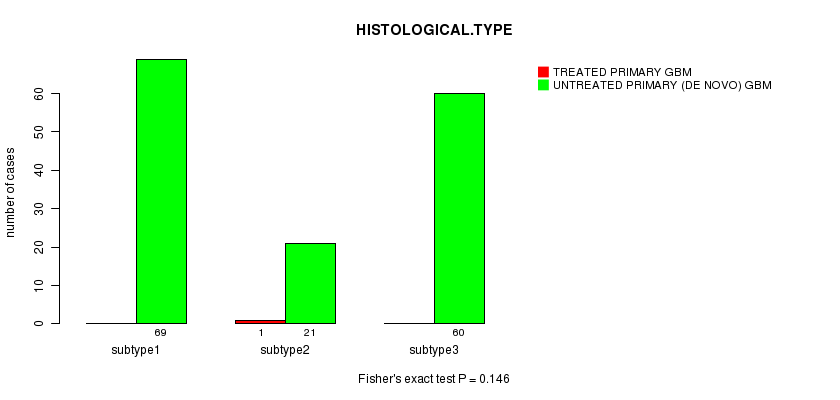
P value = 0.146 (Fisher's exact test), Q value = 1
Table S69. Clustering Approach #10: 'RNAseq cHierClus subtypes' versus Clinical Feature #5: 'HISTOLOGICAL.TYPE'
| nPatients | TREATED PRIMARY GBM | UNTREATED PRIMARY (DE NOVO) GBM |
|---|---|---|
| ALL | 1 | 150 |
| subtype1 | 0 | 69 |
| subtype2 | 1 | 21 |
| subtype3 | 0 | 60 |
Figure S59. Get High-res Image Clustering Approach #10: 'RNAseq cHierClus subtypes' versus Clinical Feature #5: 'HISTOLOGICAL.TYPE'
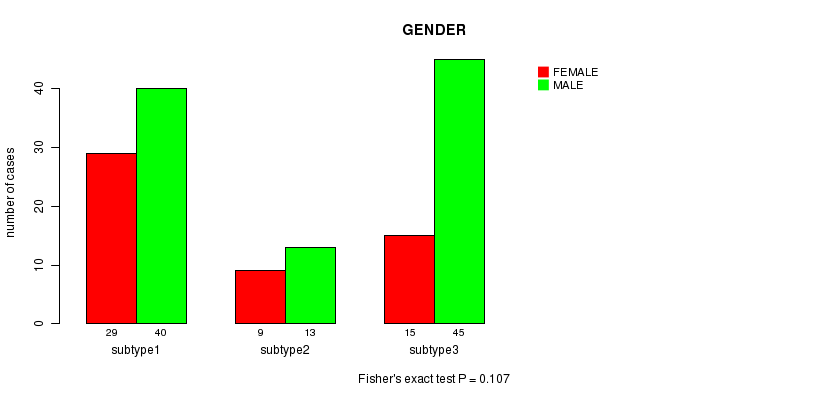
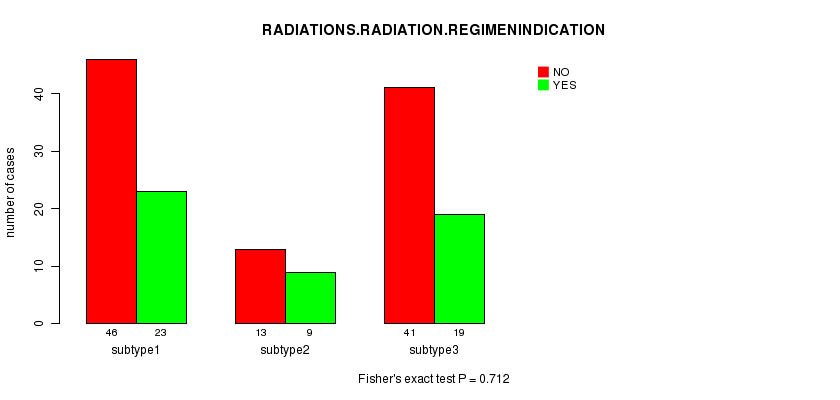
P value = 0.712 (Fisher's exact test), Q value = 1
Table S70. Clustering Approach #10: 'RNAseq cHierClus subtypes' versus Clinical Feature #6: 'RADIATIONS.RADIATION.REGIMENINDICATION'
| nPatients | NO | YES |
|---|---|---|
| ALL | 100 | 51 |
| subtype1 | 46 | 23 |
| subtype2 | 13 | 9 |
| subtype3 | 41 | 19 |
Figure S60. Get High-res Image Clustering Approach #10: 'RNAseq cHierClus subtypes' versus Clinical Feature #6: 'RADIATIONS.RADIATION.REGIMENINDICATION'
-
Cluster data file = GBM-TP.mergedcluster.txt
-
Clinical data file = GBM-TP.clin.merged.picked.txt
-
Number of patients = 573
-
Number of clustering approaches = 10
-
Number of selected clinical features = 6
-
Exclude small clusters that include fewer than K patients, K = 3
consensus non-negative matrix factorization clustering approach (Brunet et al. 2004)
Resampling-based clustering method (Monti et al. 2003)
For survival clinical features, the Kaplan-Meier survival curves of tumors with and without gene mutations were plotted and the statistical significance P values were estimated by logrank test (Bland and Altman 2004) using the 'survdiff' function in R
For continuous numerical clinical features, one-way analysis of variance (Howell 2002) was applied to compare the clinical values between tumor subtypes using 'anova' function in R
For binary clinical features, two-tailed Fisher's exact tests (Fisher 1922) were used to estimate the P values using the 'fisher.test' function in R
For multi-class clinical features (nominal or ordinal), Chi-square tests (Greenwood and Nikulin 1996) were used to estimate the P values using the 'chisq.test' function in R
For multiple hypothesis correction, Q value is the False Discovery Rate (FDR) analogue of the P value (Benjamini and Hochberg 1995), defined as the minimum FDR at which the test may be called significant. We used the 'Benjamini and Hochberg' method of 'p.adjust' function in R to convert P values into Q values.
This is an experimental feature. The full results of the analysis summarized in this report can be downloaded from the TCGA Data Coordination Center.