This pipeline computes the correlation between significantly recurrent gene mutations and selected clinical features.
Testing the association between mutation status of 13 genes and 6 clinical features across 275 patients, 3 significant findings detected with Q value < 0.25.
-
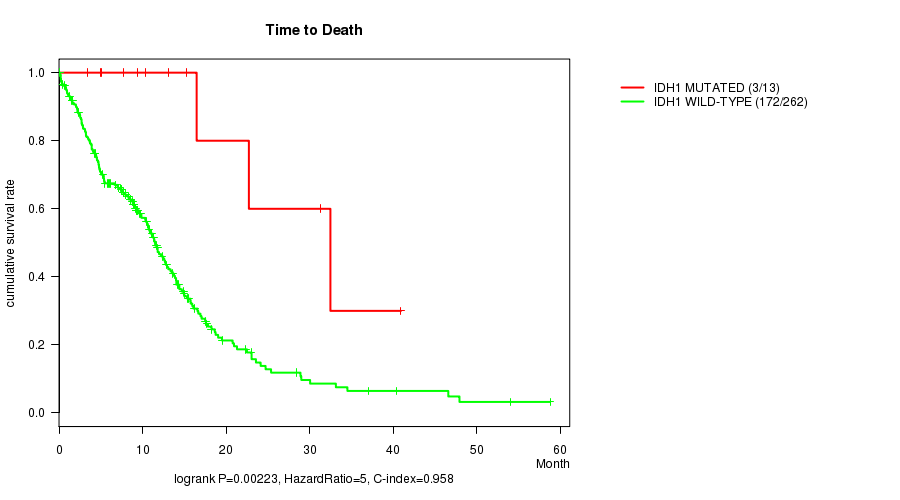
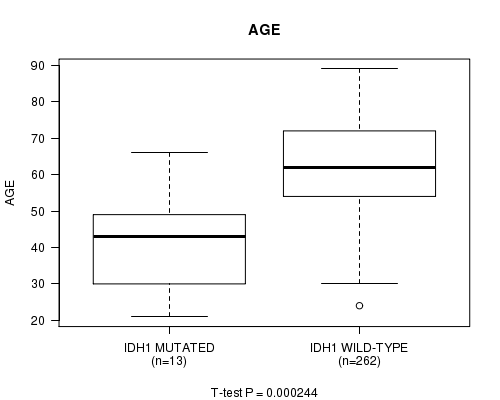
IDH1 mutation correlated to 'Time to Death' and 'AGE'.
-
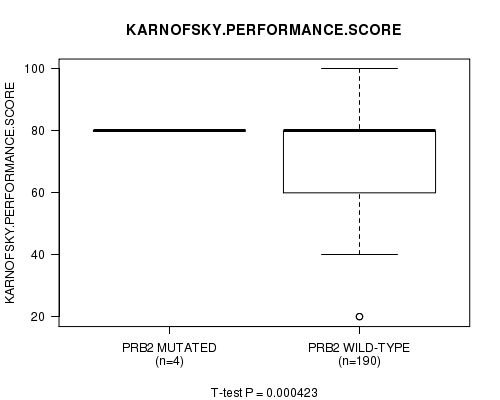
PRB2 mutation correlated to 'KARNOFSKY.PERFORMANCE.SCORE'.
Table 1. Get Full Table Overview of the association between mutation status of 13 genes and 6 clinical features. Shown in the table are P values (Q values). Thresholded by Q value < 0.25, 3 significant findings detected.
|
Clinical Features |
Time to Death |
AGE | GENDER |
KARNOFSKY PERFORMANCE SCORE |
HISTOLOGICAL TYPE |
RADIATIONS RADIATION REGIMENINDICATION |
||
| nMutated (%) | nWild-Type | logrank test | t-test | Fisher's exact test | t-test | Fisher's exact test | Fisher's exact test | |
| IDH1 | 13 (5%) | 262 |
0.00223 (0.167) |
0.000244 (0.0188) |
0.387 (1.00) |
0.0655 (1.00) |
1 (1.00) |
0.00585 (0.433) |
| PRB2 | 5 (2%) | 270 |
0.917 (1.00) |
0.166 (1.00) |
1 (1.00) |
0.000423 (0.0322) |
1 (1.00) |
1 (1.00) |
| EGFR | 73 (27%) | 202 |
0.7 (1.00) |
0.628 (1.00) |
0.205 (1.00) |
0.512 (1.00) |
0.723 (1.00) |
0.565 (1.00) |
| PIK3R1 | 31 (11%) | 244 |
0.74 (1.00) |
0.607 (1.00) |
0.432 (1.00) |
0.872 (1.00) |
1 (1.00) |
0.227 (1.00) |
| BRAF | 5 (2%) | 270 |
0.107 (1.00) |
0.784 (1.00) |
1 (1.00) |
0.158 (1.00) |
0.17 (1.00) |
0.667 (1.00) |
| TP53 | 77 (28%) | 198 |
0.0314 (1.00) |
0.158 (1.00) |
0.58 (1.00) |
0.00657 (0.48) |
0.188 (1.00) |
0.253 (1.00) |
| PTEN | 85 (31%) | 190 |
0.679 (1.00) |
0.211 (1.00) |
0.589 (1.00) |
0.98 (1.00) |
0.211 (1.00) |
0.488 (1.00) |
| PIK3CA | 29 (11%) | 246 |
0.481 (1.00) |
0.925 (1.00) |
0.547 (1.00) |
0.98 (1.00) |
0.285 (1.00) |
0.838 (1.00) |
| RB1 | 23 (8%) | 252 |
0.17 (1.00) |
0.859 (1.00) |
0.653 (1.00) |
0.0179 (1.00) |
0.589 (1.00) |
1 (1.00) |
| NF1 | 29 (11%) | 246 |
0.697 (1.00) |
0.191 (1.00) |
0.841 (1.00) |
0.18 (1.00) |
0.678 (1.00) |
0.54 (1.00) |
| CDC27 | 5 (2%) | 270 |
0.224 (1.00) |
0.686 (1.00) |
0.357 (1.00) |
1 (1.00) |
0.667 (1.00) |
|
| STAG2 | 12 (4%) | 263 |
0.0169 (1.00) |
0.957 (1.00) |
0.762 (1.00) |
0.0956 (1.00) |
1 (1.00) |
0.22 (1.00) |
| TPTE2 | 8 (3%) | 267 |
0.259 (1.00) |
0.581 (1.00) |
1 (1.00) |
0.0232 (1.00) |
1 (1.00) |
0.446 (1.00) |
P value = 0.00223 (logrank test), Q value = 0.17
Table S1. Gene #4: 'IDH1 MUTATION STATUS' versus Clinical Feature #1: 'Time to Death'
| nPatients | nDeath | Duration Range (Median), Month | |
|---|---|---|---|
| ALL | 275 | 175 | 0.1 - 58.8 (8.3) |
| IDH1 MUTATED | 13 | 3 | 3.4 - 40.9 (13.2) |
| IDH1 WILD-TYPE | 262 | 172 | 0.1 - 58.8 (7.9) |
Figure S1. Get High-res Image Gene #4: 'IDH1 MUTATION STATUS' versus Clinical Feature #1: 'Time to Death'
P value = 0.000244 (t-test), Q value = 0.019
Table S2. Gene #4: 'IDH1 MUTATION STATUS' versus Clinical Feature #2: 'AGE'
| nPatients | Mean (Std.Dev) | |
|---|---|---|
| ALL | 275 | 61.3 (12.8) |
| IDH1 MUTATED | 13 | 41.5 (14.7) |
| IDH1 WILD-TYPE | 262 | 62.2 (11.9) |
Figure S2. Get High-res Image Gene #4: 'IDH1 MUTATION STATUS' versus Clinical Feature #2: 'AGE'
P value = 0.000423 (t-test), Q value = 0.032
Table S3. Gene #9: 'PRB2 MUTATION STATUS' versus Clinical Feature #4: 'KARNOFSKY.PERFORMANCE.SCORE'
| nPatients | Mean (Std.Dev) | |
|---|---|---|
| ALL | 194 | 75.9 (16.0) |
| PRB2 MUTATED | 4 | 80.0 (0.0) |
| PRB2 WILD-TYPE | 190 | 75.8 (16.2) |
Figure S3. Get High-res Image Gene #9: 'PRB2 MUTATION STATUS' versus Clinical Feature #4: 'KARNOFSKY.PERFORMANCE.SCORE'
-
Mutation data file = GBM-TP.mutsig.cluster.txt
-
Clinical data file = GBM-TP.clin.merged.picked.txt
-
Number of patients = 275
-
Number of significantly mutated genes = 13
-
Number of selected clinical features = 6
-
Exclude genes that fewer than K tumors have mutations, K = 3
For survival clinical features, the Kaplan-Meier survival curves of tumors with and without gene mutations were plotted and the statistical significance P values were estimated by logrank test (Bland and Altman 2004) using the 'survdiff' function in R
For continuous numerical clinical features, two-tailed Student's t test with unequal variance (Lehmann and Romano 2005) was applied to compare the clinical values between tumors with and without gene mutations using 't.test' function in R
For binary or multi-class clinical features (nominal or ordinal), two-tailed Fisher's exact tests (Fisher 1922) were used to estimate the P values using the 'fisher.test' function in R
For multiple hypothesis correction, Q value is the False Discovery Rate (FDR) analogue of the P value (Benjamini and Hochberg 1995), defined as the minimum FDR at which the test may be called significant. We used the 'Benjamini and Hochberg' method of 'p.adjust' function in R to convert P values into Q values.
This is an experimental feature. The full results of the analysis summarized in this report can be downloaded from the TCGA Data Coordination Center.