This pipeline uses various statistical tests to identify mRNAs whose expression levels correlated to selected clinical features.
Testing the association between 12042 genes and 6 clinical features across 523 samples, statistically thresholded by Q value < 0.05, 5 clinical features related to at least one genes.
-
15 genes correlated to 'Time to Death'.
-
CLEC5A , RANBP17 , EFEMP2 , DIRAS3 , ATP5C1 , ...
-
73 genes correlated to 'AGE'.
-
FBXO17 , KIAA0495 , RANBP17 , NOL3 , C14ORF45 , ...
-
21 genes correlated to 'GENDER'.
-
DDX3Y , RPS4Y1 , JARID1D , EIF1AY , NLGN4Y , ...
-
1 gene correlated to 'KARNOFSKY.PERFORMANCE.SCORE'.
-
TM4SF20
-
497 genes correlated to 'HISTOLOGICAL.TYPE'.
-
CDH8 , KIAA0774 , RYR2 , KCNV1 , CLDN3 , ...
-
No genes correlated to 'RADIATIONS.RADIATION.REGIMENINDICATION'
Complete statistical result table is provided in Supplement Table 1
Table 1. Get Full Table This table shows the clinical features, statistical methods used, and the number of genes that are significantly associated with each clinical feature at Q value < 0.05.
| Clinical feature | Statistical test | Significant genes | Associated with | Associated with | ||
|---|---|---|---|---|---|---|
| Time to Death | Cox regression test | N=15 | shorter survival | N=10 | longer survival | N=5 |
| AGE | Spearman correlation test | N=73 | older | N=61 | younger | N=12 |
| GENDER | t test | N=21 | male | N=13 | female | N=8 |
| KARNOFSKY PERFORMANCE SCORE | Spearman correlation test | N=1 | higher score | N=1 | lower score | N=0 |
| HISTOLOGICAL TYPE | ANOVA test | N=497 | ||||
| RADIATIONS RADIATION REGIMENINDICATION | t test | N=0 |
Table S1. Basic characteristics of clinical feature: 'Time to Death'
| Time to Death | Duration (Months) | 0.1-127.6 (median=9.9) |
| censored | N = 116 | |
| death | N = 407 | |
| Significant markers | N = 15 | |
| associated with shorter survival | 10 | |
| associated with longer survival | 5 |
Table S2. Get Full Table List of top 10 genes significantly associated with 'Time to Death' by Cox regression test
| HazardRatio | Wald_P | Q | C_index | |
|---|---|---|---|---|
| CLEC5A | 1.23 | 7.442e-08 | 9e-04 | 0.582 |
| RANBP17 | 0.39 | 1.046e-07 | 0.0013 | 0.418 |
| EFEMP2 | 1.29 | 1.15e-07 | 0.0014 | 0.54 |
| DIRAS3 | 1.2 | 2.886e-07 | 0.0035 | 0.554 |
| ATP5C1 | 0.62 | 3.108e-07 | 0.0037 | 0.447 |
| SIGLEC9 | 2.2 | 4.912e-07 | 0.0059 | 0.56 |
| HIST3H2A | 0.83 | 4.99e-07 | 0.006 | 0.428 |
| ZIC3 | 0.44 | 1.578e-06 | 0.019 | 0.438 |
| TIMP1 | 1.21 | 1.876e-06 | 0.023 | 0.55 |
| KIAA0495 | 1.63 | 2.181e-06 | 0.026 | 0.55 |
Figure S1. Get High-res Image As an example, this figure shows the association of CLEC5A to 'Time to Death'. four curves present the cumulative survival rates of 4 quartile subsets of patients. P value = 7.44e-08 with univariate Cox regression analysis using continuous log-2 expression values.
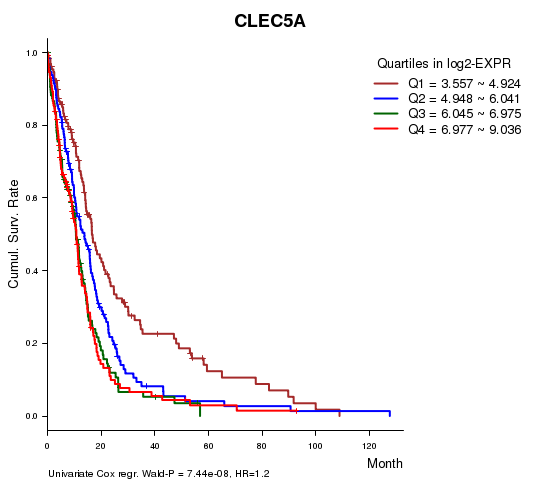
Table S3. Basic characteristics of clinical feature: 'AGE'
| AGE | Mean (SD) | 57.75 (15) |
| Significant markers | N = 73 | |
| pos. correlated | 61 | |
| neg. correlated | 12 |
Table S4. Get Full Table List of top 10 genes significantly correlated to 'AGE' by Spearman correlation test
| SpearmanCorr | corrP | Q | |
|---|---|---|---|
| FBXO17 | 0.3036 | 1.29e-12 | 1.55e-08 |
| KIAA0495 | 0.2924 | 9.085e-12 | 1.09e-07 |
| RANBP17 | -0.2884 | 1.781e-11 | 2.14e-07 |
| NOL3 | 0.2798 | 7.302e-11 | 8.79e-07 |
| C14ORF45 | 0.2744 | 1.744e-10 | 2.1e-06 |
| TUSC3 | -0.2738 | 1.904e-10 | 2.29e-06 |
| DRG2 | 0.2629 | 1.03e-09 | 1.24e-05 |
| C5ORF21 | 0.2502 | 6.598e-09 | 7.94e-05 |
| C9ORF6 | 0.2476 | 9.508e-09 | 0.000114 |
| PCNP | 0.2448 | 1.409e-08 | 0.00017 |
Figure S2. Get High-res Image As an example, this figure shows the association of FBXO17 to 'AGE'. P value = 1.29e-12 with Spearman correlation analysis. The straight line presents the best linear regression.
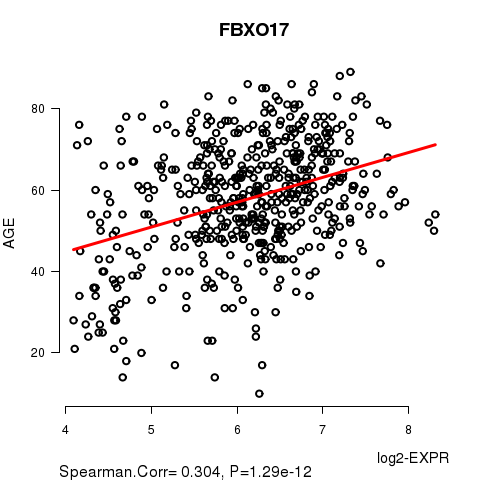
Table S5. Basic characteristics of clinical feature: 'GENDER'
| GENDER | Labels | N |
| FEMALE | 205 | |
| MALE | 318 | |
| Significant markers | N = 21 | |
| Higher in MALE | 13 | |
| Higher in FEMALE | 8 |
Table S6. Get Full Table List of top 10 genes differentially expressed by 'GENDER'
| T(pos if higher in 'MALE') | ttestP | Q | AUC | |
|---|---|---|---|---|
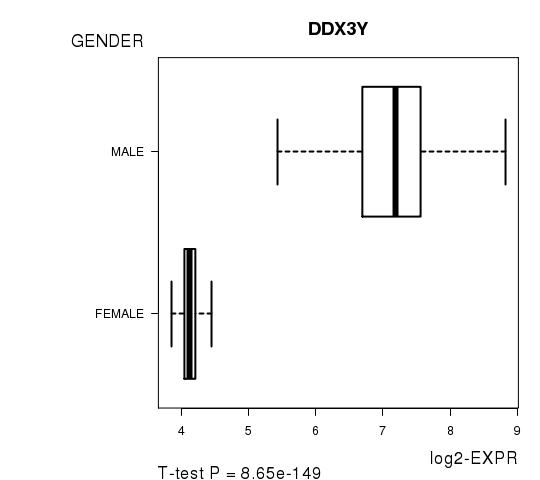
| DDX3Y | 37.87 | 8.65e-149 | 1.04e-144 | 0.9583 |
| RPS4Y1 | 40.71 | 3.227e-144 | 3.89e-140 | 0.9504 |
| JARID1D | 34.74 | 9.382e-138 | 1.13e-133 | 0.957 |
| EIF1AY | 34.83 | 4.969e-137 | 5.98e-133 | 0.9499 |
| NLGN4Y | 30.22 | 3.925e-111 | 4.73e-107 | 0.9385 |
| UTY | 26.81 | 3.743e-99 | 4.51e-95 | 0.9435 |
| USP9Y | 22.04 | 2.372e-75 | 2.86e-71 | 0.9337 |
| CYORF15B | 22.1 | 7.411e-75 | 8.92e-71 | 0.9434 |
| ZFY | 14.69 | 5.257e-41 | 6.33e-37 | 0.8441 |
| HDHD1A | -10.41 | 2.185e-22 | 2.63e-18 | 0.7637 |
Figure S3. Get High-res Image As an example, this figure shows the association of DDX3Y to 'GENDER'. P value = 8.65e-149 with T-test analysis.
One gene related to 'KARNOFSKY.PERFORMANCE.SCORE'.
Table S7. Basic characteristics of clinical feature: 'KARNOFSKY.PERFORMANCE.SCORE'
| KARNOFSKY.PERFORMANCE.SCORE | Mean (SD) | 77.12 (14) |
| Significant markers | N = 1 | |
| pos. correlated | 1 | |
| neg. correlated | 0 |
Table S8. Get Full Table List of one gene significantly correlated to 'KARNOFSKY.PERFORMANCE.SCORE' by Spearman correlation test
| SpearmanCorr | corrP | Q | |
|---|---|---|---|
| TM4SF20 | 0.2356 | 2.62e-06 | 0.0316 |
Figure S4. Get High-res Image As an example, this figure shows the association of TM4SF20 to 'KARNOFSKY.PERFORMANCE.SCORE'. P value = 2.62e-06 with Spearman correlation analysis. The straight line presents the best linear regression.
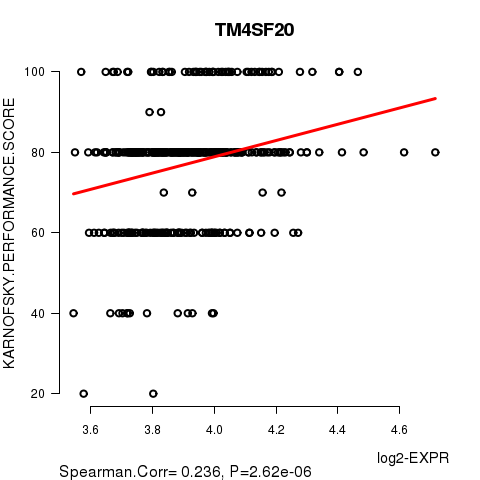
Table S9. Basic characteristics of clinical feature: 'HISTOLOGICAL.TYPE'
| HISTOLOGICAL.TYPE | Labels | N |
| GLIOBLASTOMA MULTIFORME (GBM) | 4 | |
| TREATED PRIMARY GBM | 20 | |
| UNTREATED PRIMARY (DE NOVO) GBM | 499 | |
| Significant markers | N = 497 |
Table S10. Get Full Table List of top 10 genes differentially expressed by 'HISTOLOGICAL.TYPE'
| ANOVA_P | Q | |
|---|---|---|
| CDH8 | 8.038e-25 | 9.68e-21 |
| KIAA0774 | 3.567e-24 | 4.3e-20 |
| RYR2 | 1.32e-22 | 1.59e-18 |
| KCNV1 | 1.206e-21 | 1.45e-17 |
| CLDN3 | 4.634e-21 | 5.58e-17 |
| VIP | 5.605e-21 | 6.75e-17 |
| DLGAP2 | 1.275e-20 | 1.53e-16 |
| CHD5 | 5.928e-20 | 7.13e-16 |
| PAX8 | 2.156e-19 | 2.59e-15 |
| DOC2A | 2.988e-19 | 3.6e-15 |
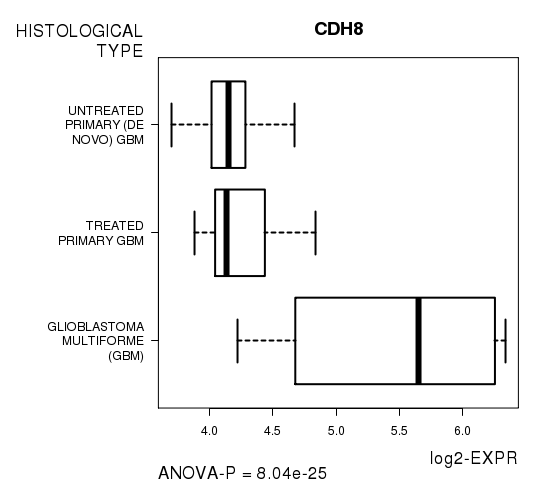
Figure S5. Get High-res Image As an example, this figure shows the association of CDH8 to 'HISTOLOGICAL.TYPE'. P value = 8.04e-25 with ANOVA analysis.
No gene related to 'RADIATIONS.RADIATION.REGIMENINDICATION'.
Table S11. Basic characteristics of clinical feature: 'RADIATIONS.RADIATION.REGIMENINDICATION'
| RADIATIONS.RADIATION.REGIMENINDICATION | Labels | N |
| NO | 358 | |
| YES | 165 | |
| Significant markers | N = 0 |
-
Expresson data file = GBM-TP.medianexp.txt
-
Clinical data file = GBM-TP.clin.merged.picked.txt
-
Number of patients = 523
-
Number of genes = 12042
-
Number of clinical features = 6
For survival clinical features, Wald's test in univariate Cox regression analysis with proportional hazards model (Andersen and Gill 1982) was used to estimate the P values using the 'coxph' function in R. Kaplan-Meier survival curves were plot using the four quartile subgroups of patients based on expression levels
For continuous numerical clinical features, Spearman's rank correlation coefficients (Spearman 1904) and two-tailed P values were estimated using 'cor.test' function in R
For two-class clinical features, two-tailed Student's t test with unequal variance (Lehmann and Romano 2005) was applied to compare the log2-expression levels between the two clinical classes using 't.test' function in R
For multi-class clinical features (ordinal or nominal), one-way analysis of variance (Howell 2002) was applied to compare the log2-expression levels between different clinical classes using 'anova' function in R
For multiple hypothesis correction, Q value is the False Discovery Rate (FDR) analogue of the P value (Benjamini and Hochberg 1995), defined as the minimum FDR at which the test may be called significant. We used the 'Benjamini and Hochberg' method of 'p.adjust' function in R to convert P values into Q values.
This is an experimental feature. The full results of the analysis summarized in this report can be downloaded from the TCGA Data Coordination Center.