This report serves to describe the mutational landscape and properties of a given individual set, as well as rank genes and genesets according to mutational significance. MutSig v2.0 and MutSigCV v0.9 merged result was used to generate the results found in this report.
-
Working with individual set: GBM-TP
-
Number of patients in set: 284
The input for this pipeline is a set of individuals with the following files associated for each:
-
An annotated .maf file describing the mutations called for the respective individual, and their properties.
-
A .wig file that contains information about the coverage of the sample.
-
MAF used for this analysis:GBM-TP.final_analysis_set.maf
-
Significantly mutated genes (q ≤ 0.1): 12
-
Mutations seen in COSMIC: 466
-
Significantly mutated genes in COSMIC territory: 74
-
Significantly mutated genesets: 119
-
Read 284 MAFs of type "Broad"
-
Total number of mutations in input MAFs: 21603
-
After removing 304 blacklisted mutations: 21299
-
Number of mutations before filtering: 21299
-
After removing 413 mutations outside gene set: 20886
-
After removing 12 mutations outside category set: 20874
Table 1. Get Full Table Table representing breakdown of mutations by type.
| type | count |
|---|---|
| Frame_Shift_Del | 536 |
| Frame_Shift_Ins | 204 |
| In_Frame_Del | 204 |
| In_Frame_Ins | 27 |
| Missense_Mutation | 13461 |
| Nonsense_Mutation | 809 |
| Nonstop_Mutation | 11 |
| Silent | 5229 |
| Splice_Site | 339 |
| Translation_Start_Site | 54 |
| Total | 20874 |
Table 2. Get Full Table A breakdown of mutation rates per category discovered for this individual set.
| category | n | N | rate | rate_per_mb | relative_rate | exp_ns_s_ratio |
|---|---|---|---|---|---|---|
| *CpG->T | 5501 | 473068624 | 0.000012 | 12 | 6.3 | 2.1 |
| *Cp(A/C/T)->T | 2412 | 3859508772 | 6.2e-07 | 0.62 | 0.34 | 1.7 |
| A->G | 1682 | 4155773265 | 4e-07 | 0.4 | 0.22 | 2.3 |
| transver | 3919 | 8488350661 | 4.6e-07 | 0.46 | 0.25 | 5 |
| indel+null | 2119 | 8488350661 | 2.5e-07 | 0.25 | 0.14 | NaN |
| double_null | 12 | 8488350661 | 1.4e-09 | 0.0014 | 0.00077 | NaN |
| Total | 15645 | 8488350661 | 1.8e-06 | 1.8 | 1 | 3.5 |
The x axis represents the samples. The y axis represents the exons, one row per exon, and they are sorted by average coverage across samples. For exons with exactly the same average coverage, they are sorted next by the %GC of the exon. (The secondary sort is especially useful for the zero-coverage exons at the bottom).
Figure 1.
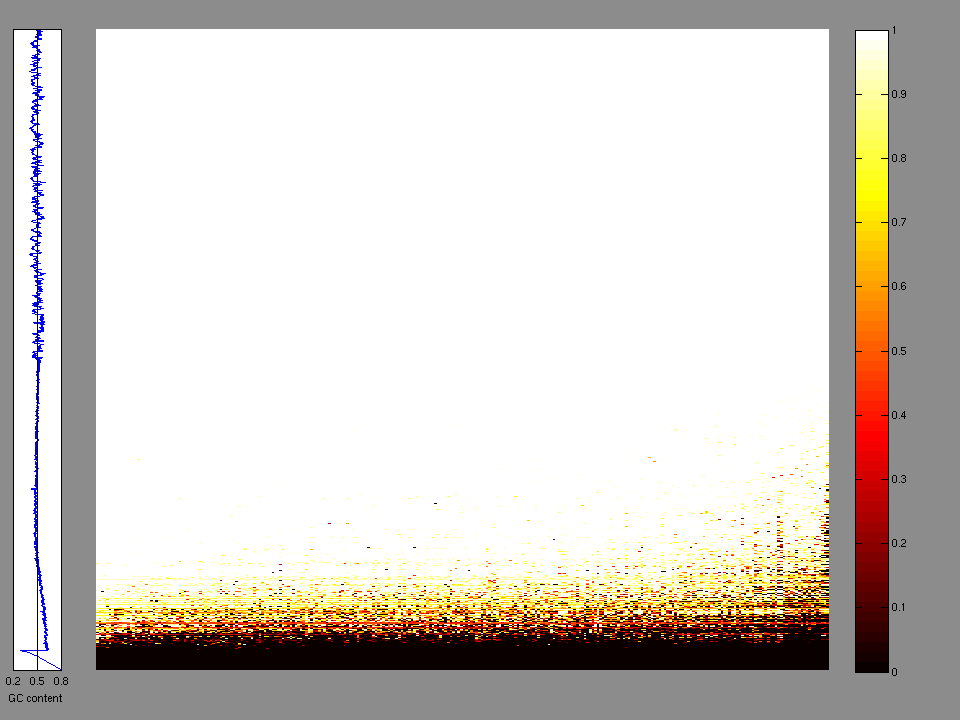
Figure 2. Patients counts and rates file used to generate this plot: GBM-TP.patients.counts_and_rates.txt
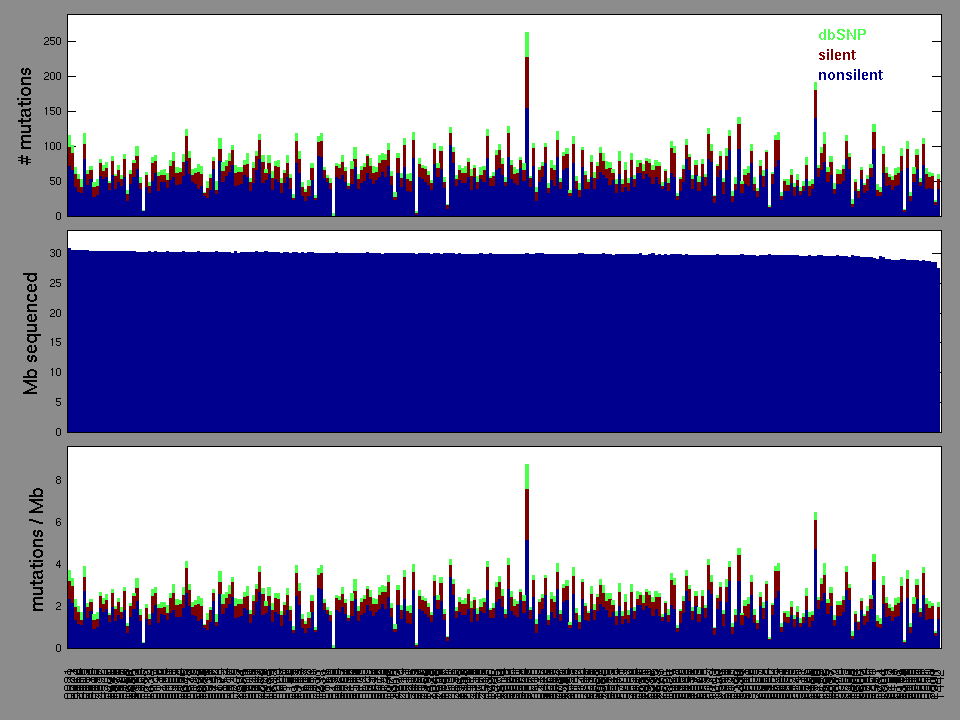
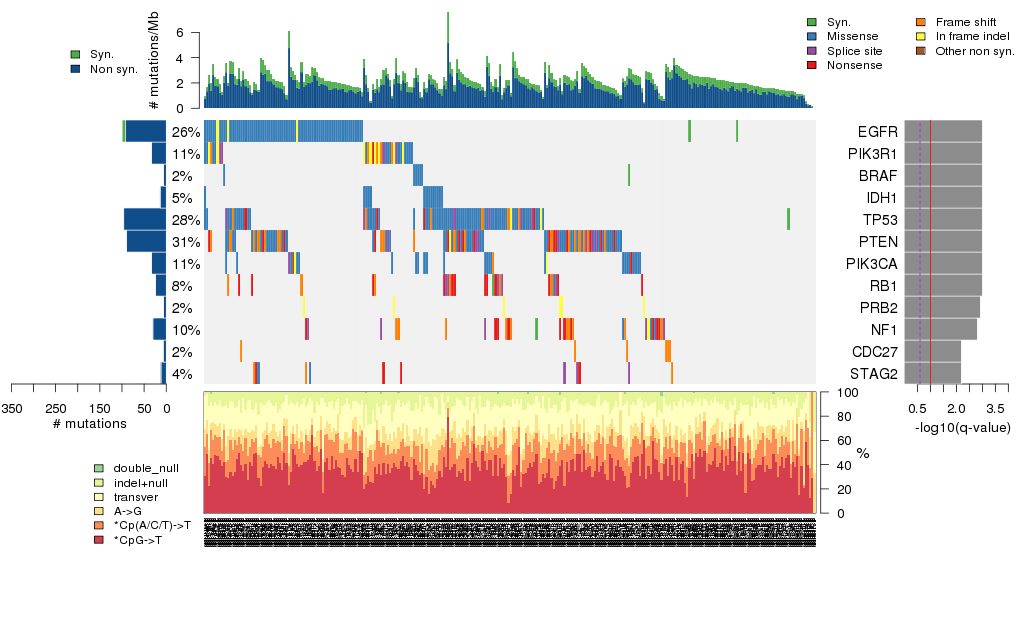
Figure 3. Get High-res Image The matrix in the center of the figure represents individual mutations in patient samples, color-coded by type of mutation, for the significantly mutated genes. The rate of synonymous and non-synonymous mutations is displayed at the top of the matrix. The barplot on the left of the matrix shows the number of mutations in each gene. The percentages represent the fraction of tumors with at least one mutation in the specified gene. The barplot to the right of the matrix displays the q-values for the most significantly mutated genes. The purple boxplots below the matrix (only displayed if required columns are present in the provided MAF) represent the distributions of allelic fractions observed in each sample. The plot at the bottom represents the base substitution distribution of individual samples, using the same categories that were used to calculate significance.
Column Descriptions:
-
N = number of sequenced bases in this gene across the individual set
-
n = number of (nonsilent) mutations in this gene across the individual set
-
npat = number of patients (individuals) with at least one nonsilent mutation
-
nsite = number of unique sites having a non-silent mutation
-
nsil = number of silent mutations in this gene across the individual set
-
n1 = number of nonsilent mutations of type: *CpG->T
-
n2 = number of nonsilent mutations of type: *Cp(A/C/T)->T
-
n3 = number of nonsilent mutations of type: A->G
-
n4 = number of nonsilent mutations of type: transver
-
n5 = number of nonsilent mutations of type: indel+null
-
n6 = number of nonsilent mutations of type: double_null
-
p_cons = p-value for enrichment of mutations at evolutionarily most-conserved sites in gene
-
p_joint = p-value for clustering + conservation
-
p = p-value (overall)
-
q = q-value, False Discovery Rate (Benjamini-Hochberg procedure)
Table 3. Get Full Table A Ranked List of Significantly Mutated Genes. Number of significant genes found: 12. Number of genes displayed: 35. Click on a gene name to display its stick figure depicting the distribution of mutations and mutation types across the chosen gene (this feature may not be available for all significant genes).
| rank | gene | description | N | n | npat | nsite | nsil | n1 | n2 | n3 | n4 | n5 | n6 | p_cons | p_joint | p_cv | p | q |
|---|---|---|---|---|---|---|---|---|---|---|---|---|---|---|---|---|---|---|
| 1 | EGFR | epidermal growth factor receptor (erythroblastic leukemia viral (v-erb-b) oncogene homolog, avian) | 1135441 | 92 | 74 | 44 | 7 | 10 | 44 | 2 | 32 | 4 | 0 | 0 | 0 | 2.3e-15 | 0 | 0 |
| 2 | PIK3R1 | phosphoinositide-3-kinase, regulatory subunit 1 (alpha) | 670609 | 33 | 32 | 27 | 0 | 0 | 3 | 4 | 7 | 19 | 0 | 0.12 | 0.000012 | 0 | 0 | 0 |
| 3 | BRAF | v-raf murine sarcoma viral oncogene homolog B1 | 633304 | 6 | 6 | 2 | 1 | 0 | 1 | 0 | 5 | 0 | 0 | 0.085 | 0 | 0.043 | 0 | 0 |
| 4 | IDH1 | isocitrate dehydrogenase 1 (NADP+), soluble | 362508 | 14 | 14 | 2 | 0 | 13 | 0 | 0 | 1 | 0 | 0 | 0.86 | 0 | 1.1e-06 | 0 | 0 |
| 5 | TP53 | tumor protein p53 | 359363 | 96 | 79 | 59 | 1 | 29 | 15 | 11 | 23 | 18 | 0 | 0 | 0 | 0 | 0 | 0 |
| 6 | PTEN | phosphatase and tensin homolog (mutated in multiple advanced cancers 1) | 339074 | 90 | 87 | 73 | 0 | 5 | 20 | 10 | 13 | 42 | 0 | 0.49 | 0.019 | 5.2e-15 | 3.8e-15 | 1.1e-11 |
| 7 | PIK3CA | phosphoinositide-3-kinase, catalytic, alpha polypeptide | 927986 | 33 | 30 | 28 | 0 | 5 | 8 | 7 | 6 | 7 | 0 | 0.26 | 0.03 | 5.1e-15 | 5.8e-15 | 1.5e-11 |
| 8 | RB1 | retinoblastoma 1 (including osteosarcoma) | 754622 | 24 | 24 | 22 | 1 | 0 | 0 | 0 | 1 | 22 | 1 | 0.062 | 0.061 | 6.7e-15 | 1.5e-14 | 3.4e-11 |
| 9 | PRB2 | proline-rich protein BstNI subfamily 2 | 358638 | 6 | 6 | 2 | 0 | 0 | 0 | 0 | 0 | 6 | 0 | 0.63 | 0.0019 | 2.5e-06 | 9.5e-08 | 0.00019 |
| 10 | NF1 | neurofibromin 1 (neurofibromatosis, von Recklinghausen disease, Watson disease) | 2466191 | 30 | 29 | 30 | 1 | 0 | 2 | 1 | 1 | 21 | 5 | 0.97 | 0.35 | 4.5e-08 | 3e-07 | 0.00054 |
| 11 | CDC27 | cell division cycle 27 homolog (S. cerevisiae) | 718119 | 7 | 6 | 3 | 0 | 0 | 0 | 1 | 0 | 6 | 0 | 0.042 | 0.00027 | 0.00073 | 3.2e-06 | 0.0053 |
| 12 | STAG2 | stromal antigen 2 | 1114350 | 12 | 12 | 12 | 0 | 0 | 0 | 0 | 2 | 10 | 0 | 0.63 | 0.57 | 3.8e-07 | 3.5e-06 | 0.0053 |
| 13 | TPTE2 | transmembrane phosphoinositide 3-phosphatase and tensin homolog 2 | 466341 | 8 | 8 | 6 | 0 | 2 | 1 | 0 | 2 | 3 | 0 | 0.031 | 0.02 | 0.00054 | 0.00014 | 0.19 |
| 14 | GABRA6 | gamma-aminobutyric acid (GABA) A receptor, alpha 6 | 396836 | 11 | 11 | 10 | 1 | 4 | 2 | 1 | 4 | 0 | 0 | 0.38 | 0.76 | 0.000018 | 0.00016 | 0.21 |
| 15 | OGDH | oxoglutarate (alpha-ketoglutarate) dehydrogenase (lipoamide) | 919764 | 3 | 3 | 1 | 3 | 0 | 0 | 0 | 0 | 3 | 0 | 0.18 | 0.00013 | 0.29 | 0.00042 | 0.5 |
| 16 | CD3EAP | CD3e molecule, epsilon associated protein | 429290 | 3 | 3 | 1 | 0 | 0 | 0 | 0 | 0 | 3 | 0 | 0.91 | 0.005 | 0.0074 | 0.00042 | 0.5 |
| 17 | QKI | quaking homolog, KH domain RNA binding (mouse) | 329073 | 5 | 5 | 5 | 0 | 0 | 0 | 0 | 2 | 3 | 0 | 0.0058 | 0.034 | 0.0016 | 0.0006 | 0.63 |
| 18 | WNT2 | wingless-type MMTV integration site family member 2 | 313050 | 5 | 5 | 5 | 0 | 3 | 0 | 0 | 1 | 1 | 0 | 0.035 | 0.0059 | 0.013 | 0.00078 | 0.78 |
| 19 | PODXL | podocalyxin-like | 421591 | 3 | 3 | 1 | 0 | 0 | 0 | 0 | 0 | 3 | 0 | 0.5 | 0.0022 | 0.037 | 0.00085 | 0.81 |
| 20 | RPL5 | ribosomal protein L5 | 262732 | 7 | 7 | 7 | 0 | 0 | 1 | 1 | 0 | 5 | 0 | 0.081 | 0.19 | 0.00074 | 0.0014 | 1 |
| 21 | CDKN2C | cyclin-dependent kinase inhibitor 2C (p18, inhibits CDK4) | 145956 | 3 | 3 | 3 | 0 | 0 | 0 | 0 | 0 | 3 | 0 | 0.96 | 0.42 | 0.00037 | 0.0015 | 1 |
| 22 | OR5AR1 | olfactory receptor, family 5, subfamily AR, member 1 | 265052 | 7 | 7 | 7 | 0 | 3 | 0 | 2 | 2 | 0 | 0 | 0.098 | 0.24 | 0.00085 | 0.0019 | 1 |
| 23 | PSPH | phosphoserine phosphatase | 198225 | 5 | 5 | 3 | 0 | 0 | 3 | 0 | 1 | 1 | 0 | 0.38 | 0.17 | 0.0012 | 0.002 | 1 |
| 24 | ZPBP | zona pellucida binding protein | 283221 | 5 | 5 | 4 | 0 | 3 | 0 | 1 | 0 | 1 | 0 | 0.42 | 0.02 | 0.012 | 0.0021 | 1 |
| 25 | LZTR1 | leucine-zipper-like transcription regulator 1 | 650104 | 10 | 10 | 10 | 0 | 4 | 0 | 1 | 4 | 1 | 0 | 0.21 | 0.21 | 0.0012 | 0.0024 | 1 |
| 26 | POTEF | POTE ankyrin domain family, member F | 722785 | 5 | 5 | 5 | 1 | 1 | 0 | 0 | 4 | 0 | 0 | 1 | 0.0031 | 0.098 | 0.0027 | 1 |
| 27 | LRRC55 | leucine rich repeat containing 55 | 293305 | 6 | 6 | 6 | 1 | 4 | 0 | 0 | 1 | 1 | 0 | 0.67 | 0.2 | 0.0015 | 0.0028 | 1 |
| 28 | LCE4A | late cornified envelope 4A | 86336 | 2 | 2 | 1 | 0 | 0 | 0 | 0 | 0 | 2 | 0 | 0.74 | 0.38 | 0.00085 | 0.0029 | 1 |
| 29 | CDHR3 | cadherin-related family member 3 | 769067 | 3 | 3 | 3 | 0 | 1 | 1 | 0 | 0 | 1 | 0 | 0.012 | 0.00047 | 0.7 | 0.003 | 1 |
| 30 | RBM47 | RNA binding motif protein 47 | 476760 | 8 | 8 | 8 | 3 | 7 | 0 | 1 | 0 | 0 | 0 | 0.94 | 0.019 | 0.026 | 0.0042 | 1 |
| 31 | UGT2A3 | UDP glucuronosyltransferase 2 family, polypeptide A3 | 452509 | 6 | 6 | 6 | 0 | 1 | 0 | 2 | 2 | 1 | 0 | 0.018 | 0.052 | 0.0098 | 0.0044 | 1 |
| 32 | ZNF697 | zinc finger protein 697 | 167520 | 3 | 3 | 3 | 0 | 2 | 0 | 0 | 0 | 1 | 0 | 0.045 | 0.068 | 0.0077 | 0.0045 | 1 |
| 33 | OTC | ornithine carbamoyltransferase | 311851 | 3 | 3 | 3 | 0 | 0 | 1 | 1 | 1 | 0 | 0 | 0.28 | 0.014 | 0.045 | 0.0052 | 1 |
| 34 | BCOR | BCL6 co-repressor | 1428772 | 8 | 8 | 8 | 3 | 1 | 0 | 0 | 2 | 5 | 0 | 0.92 | 0.2 | 0.0036 | 0.0059 | 1 |
| 35 | C1orf150 | chromosome 1 open reading frame 150 | 121062 | 3 | 3 | 3 | 0 | 0 | 0 | 1 | 1 | 1 | 0 | 0.47 | 0.022 | 0.045 | 0.0077 | 1 |
Figure S1. This figure depicts the distribution of mutations and mutation types across the EGFR significant gene.
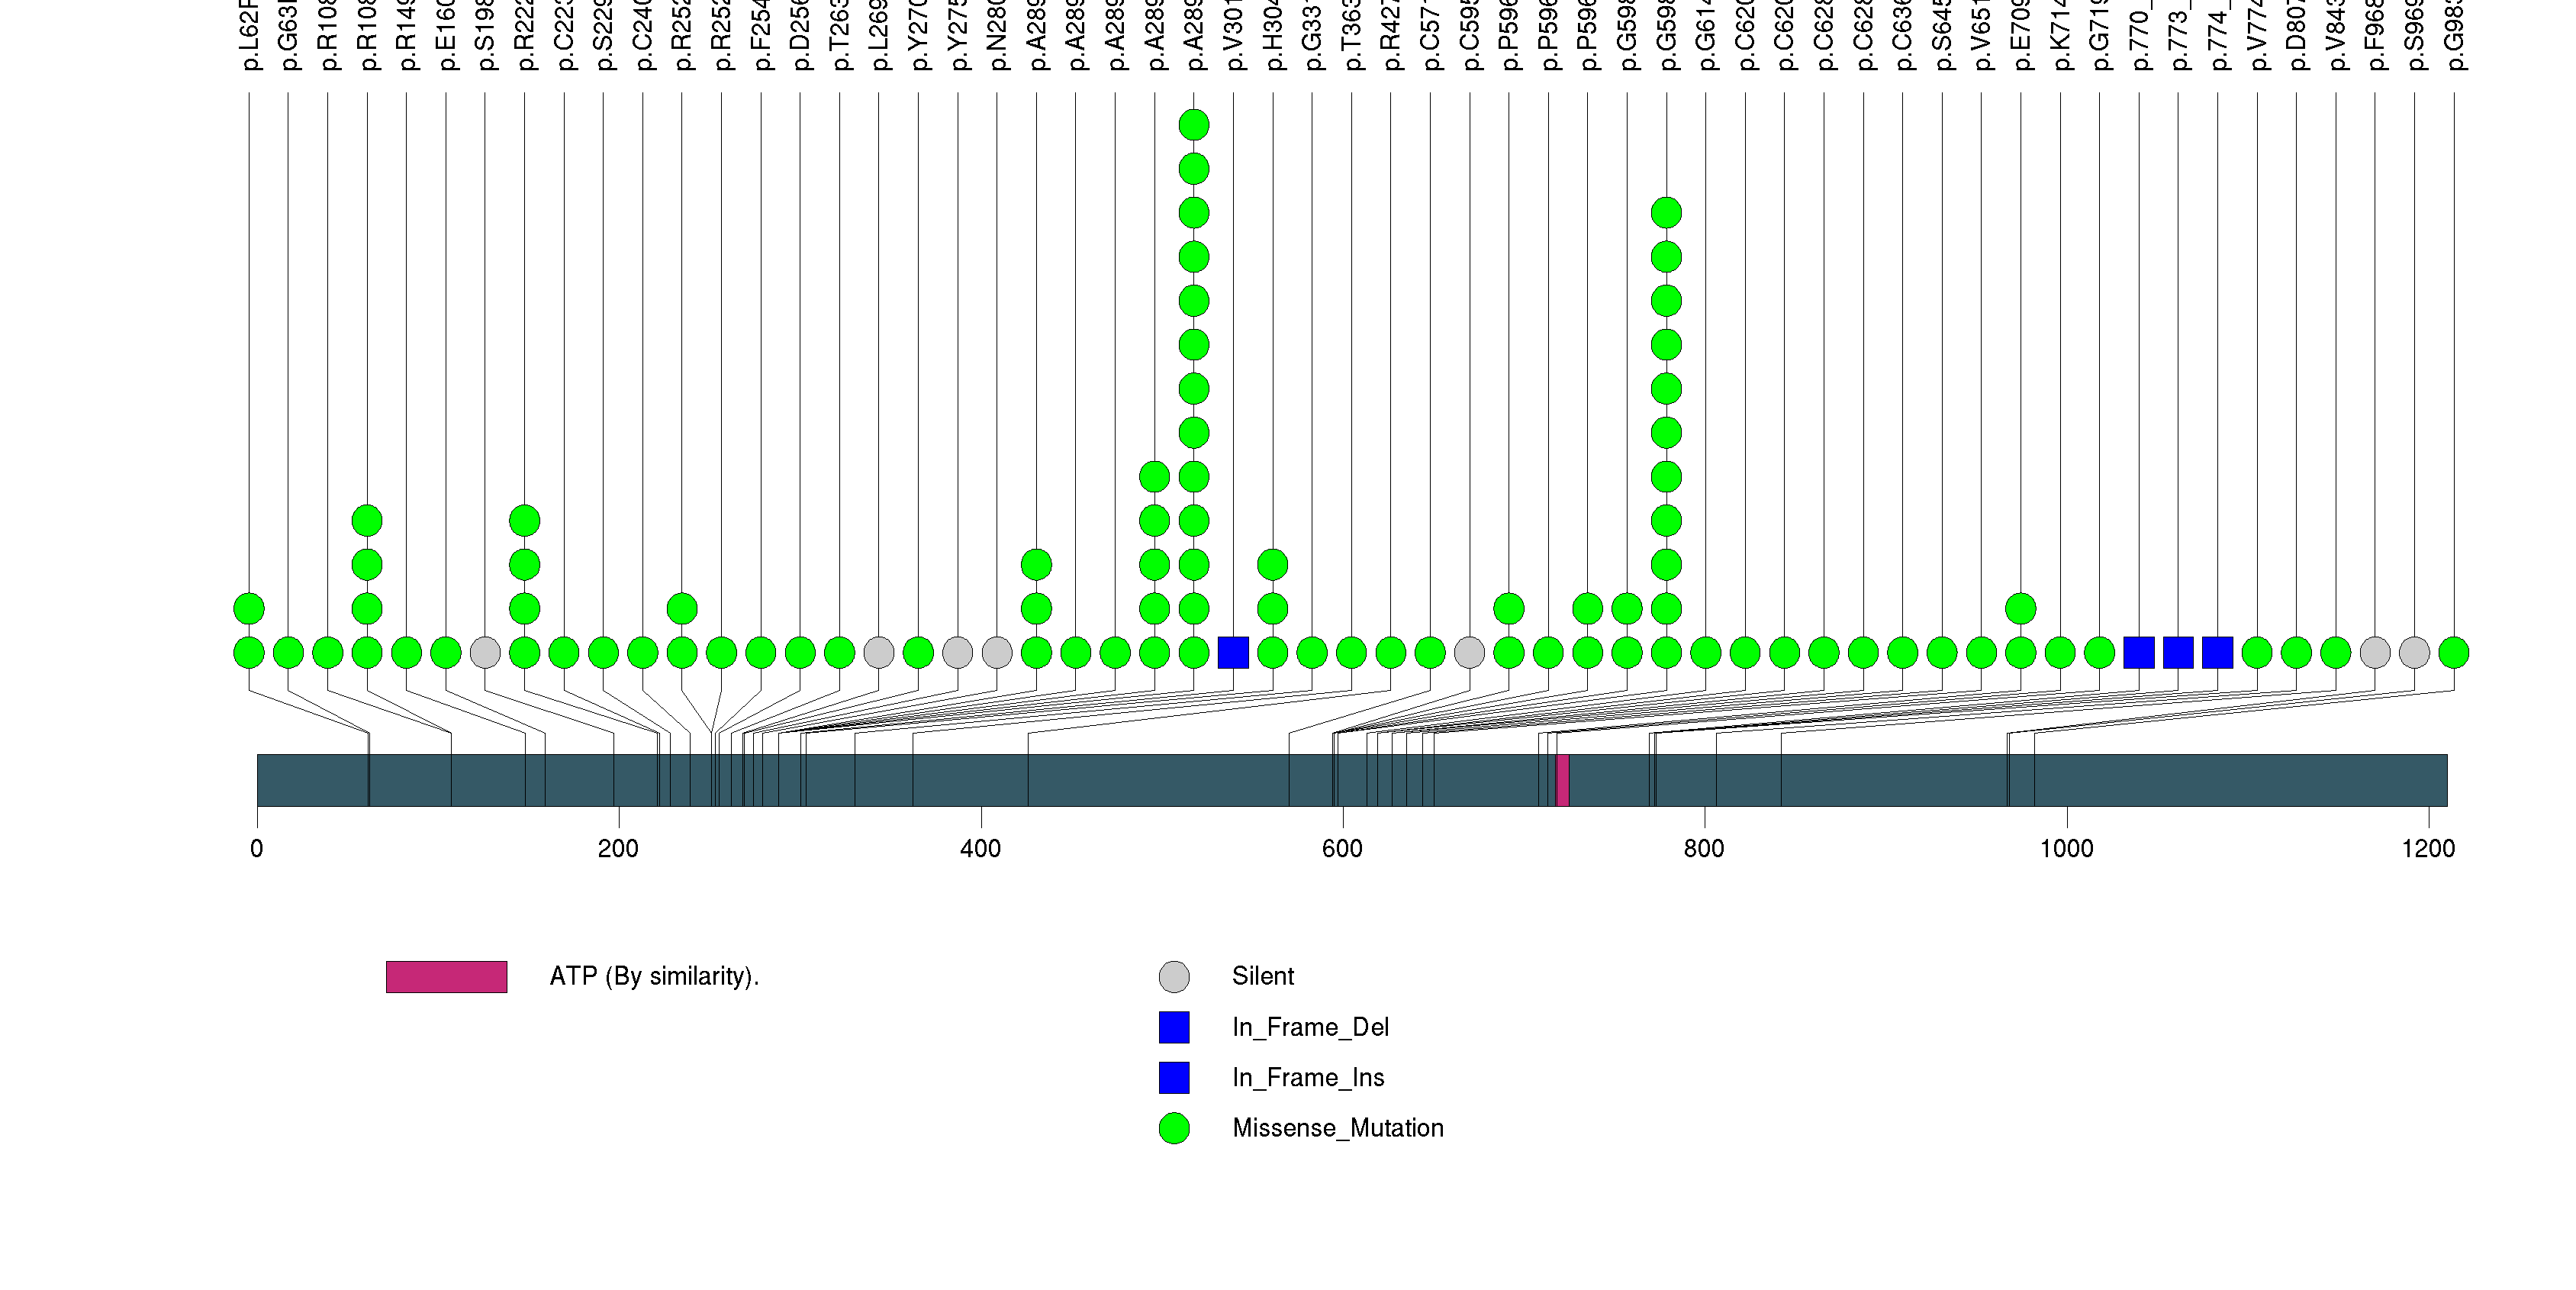
Figure S2. This figure depicts the distribution of mutations and mutation types across the PIK3R1 significant gene.
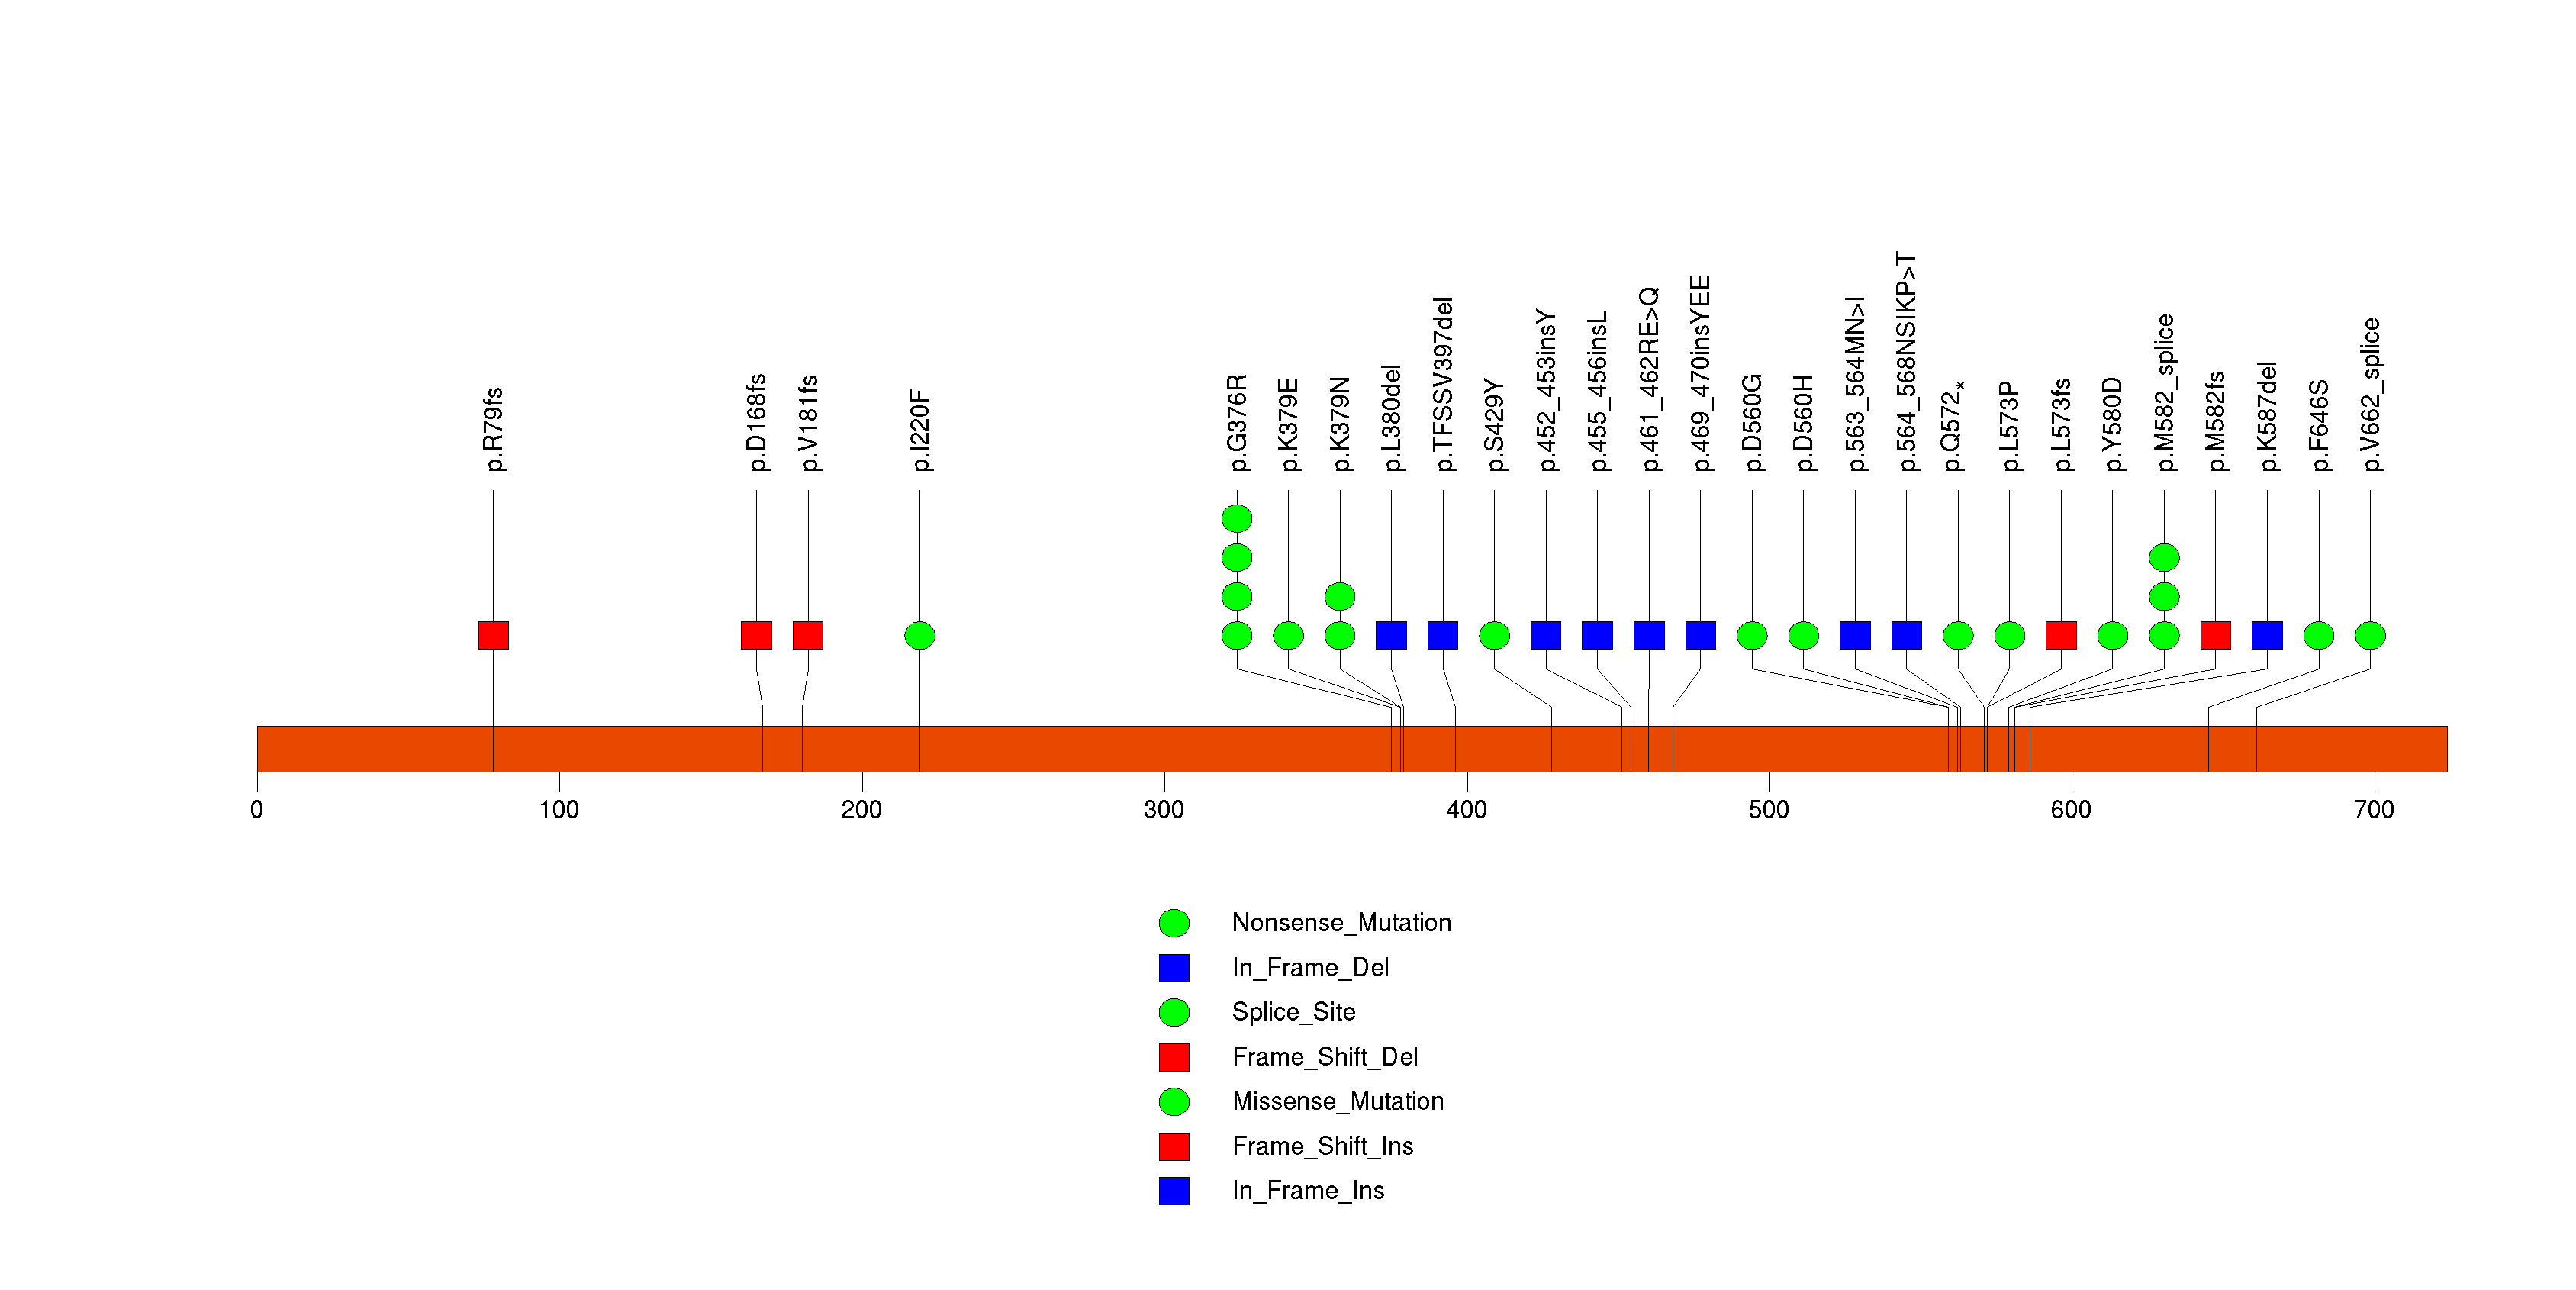
Figure S3. This figure depicts the distribution of mutations and mutation types across the BRAF significant gene.
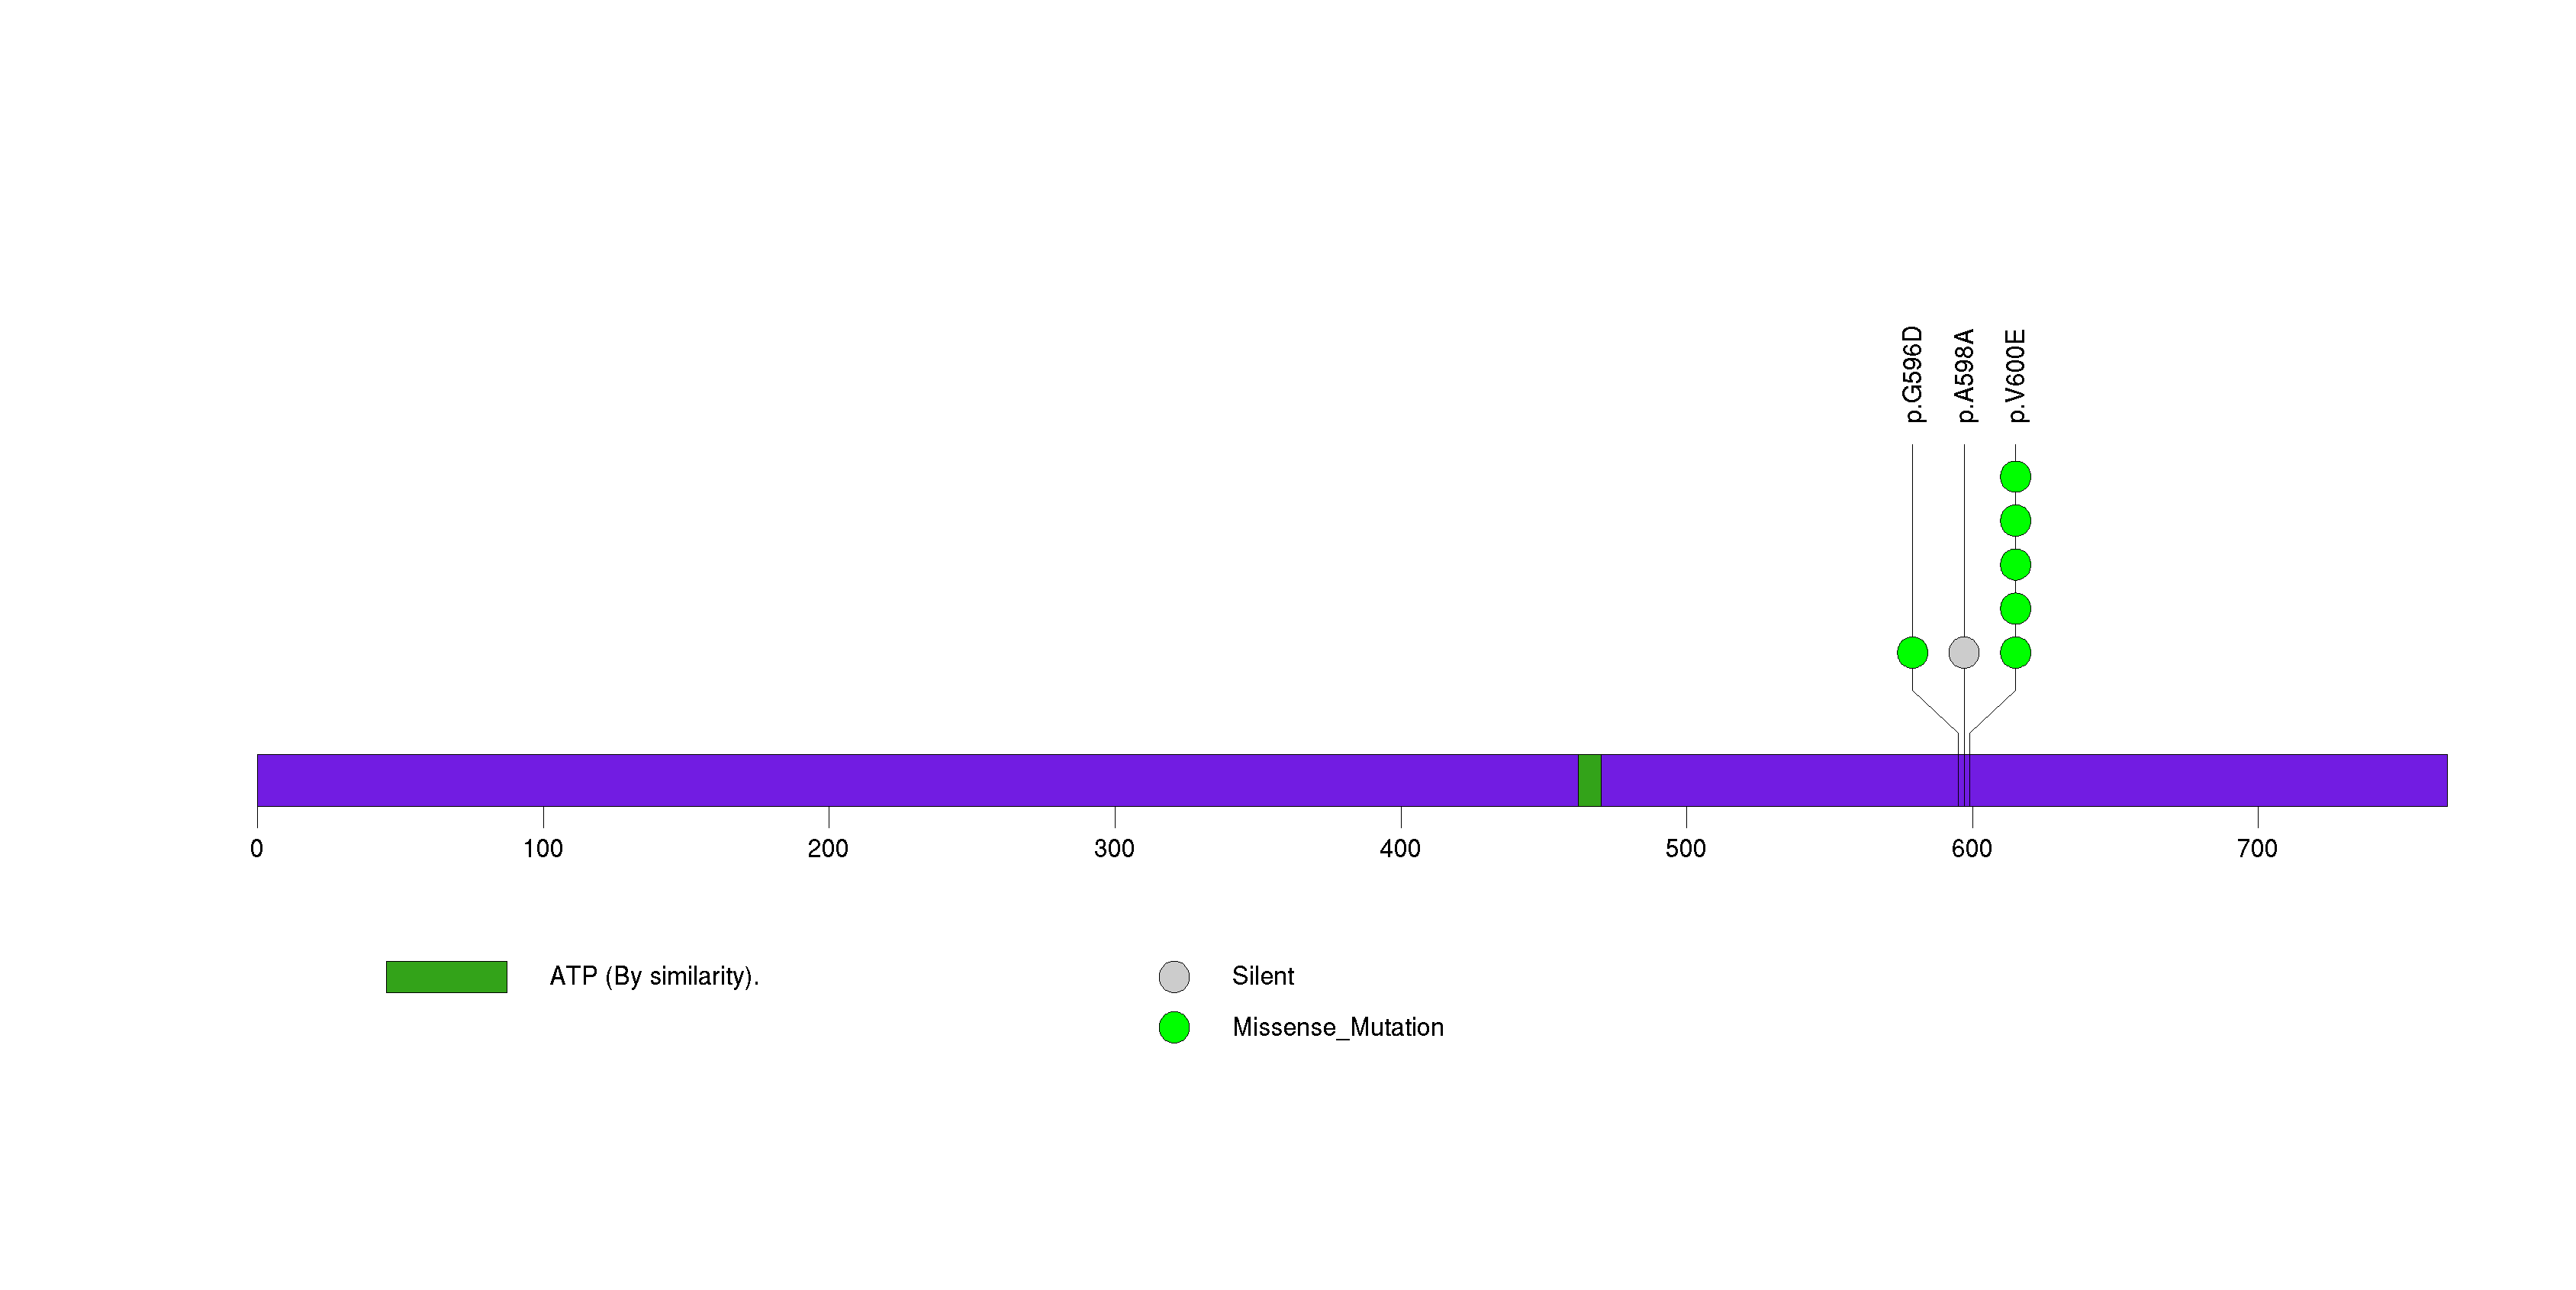
Figure S4. This figure depicts the distribution of mutations and mutation types across the IDH1 significant gene.
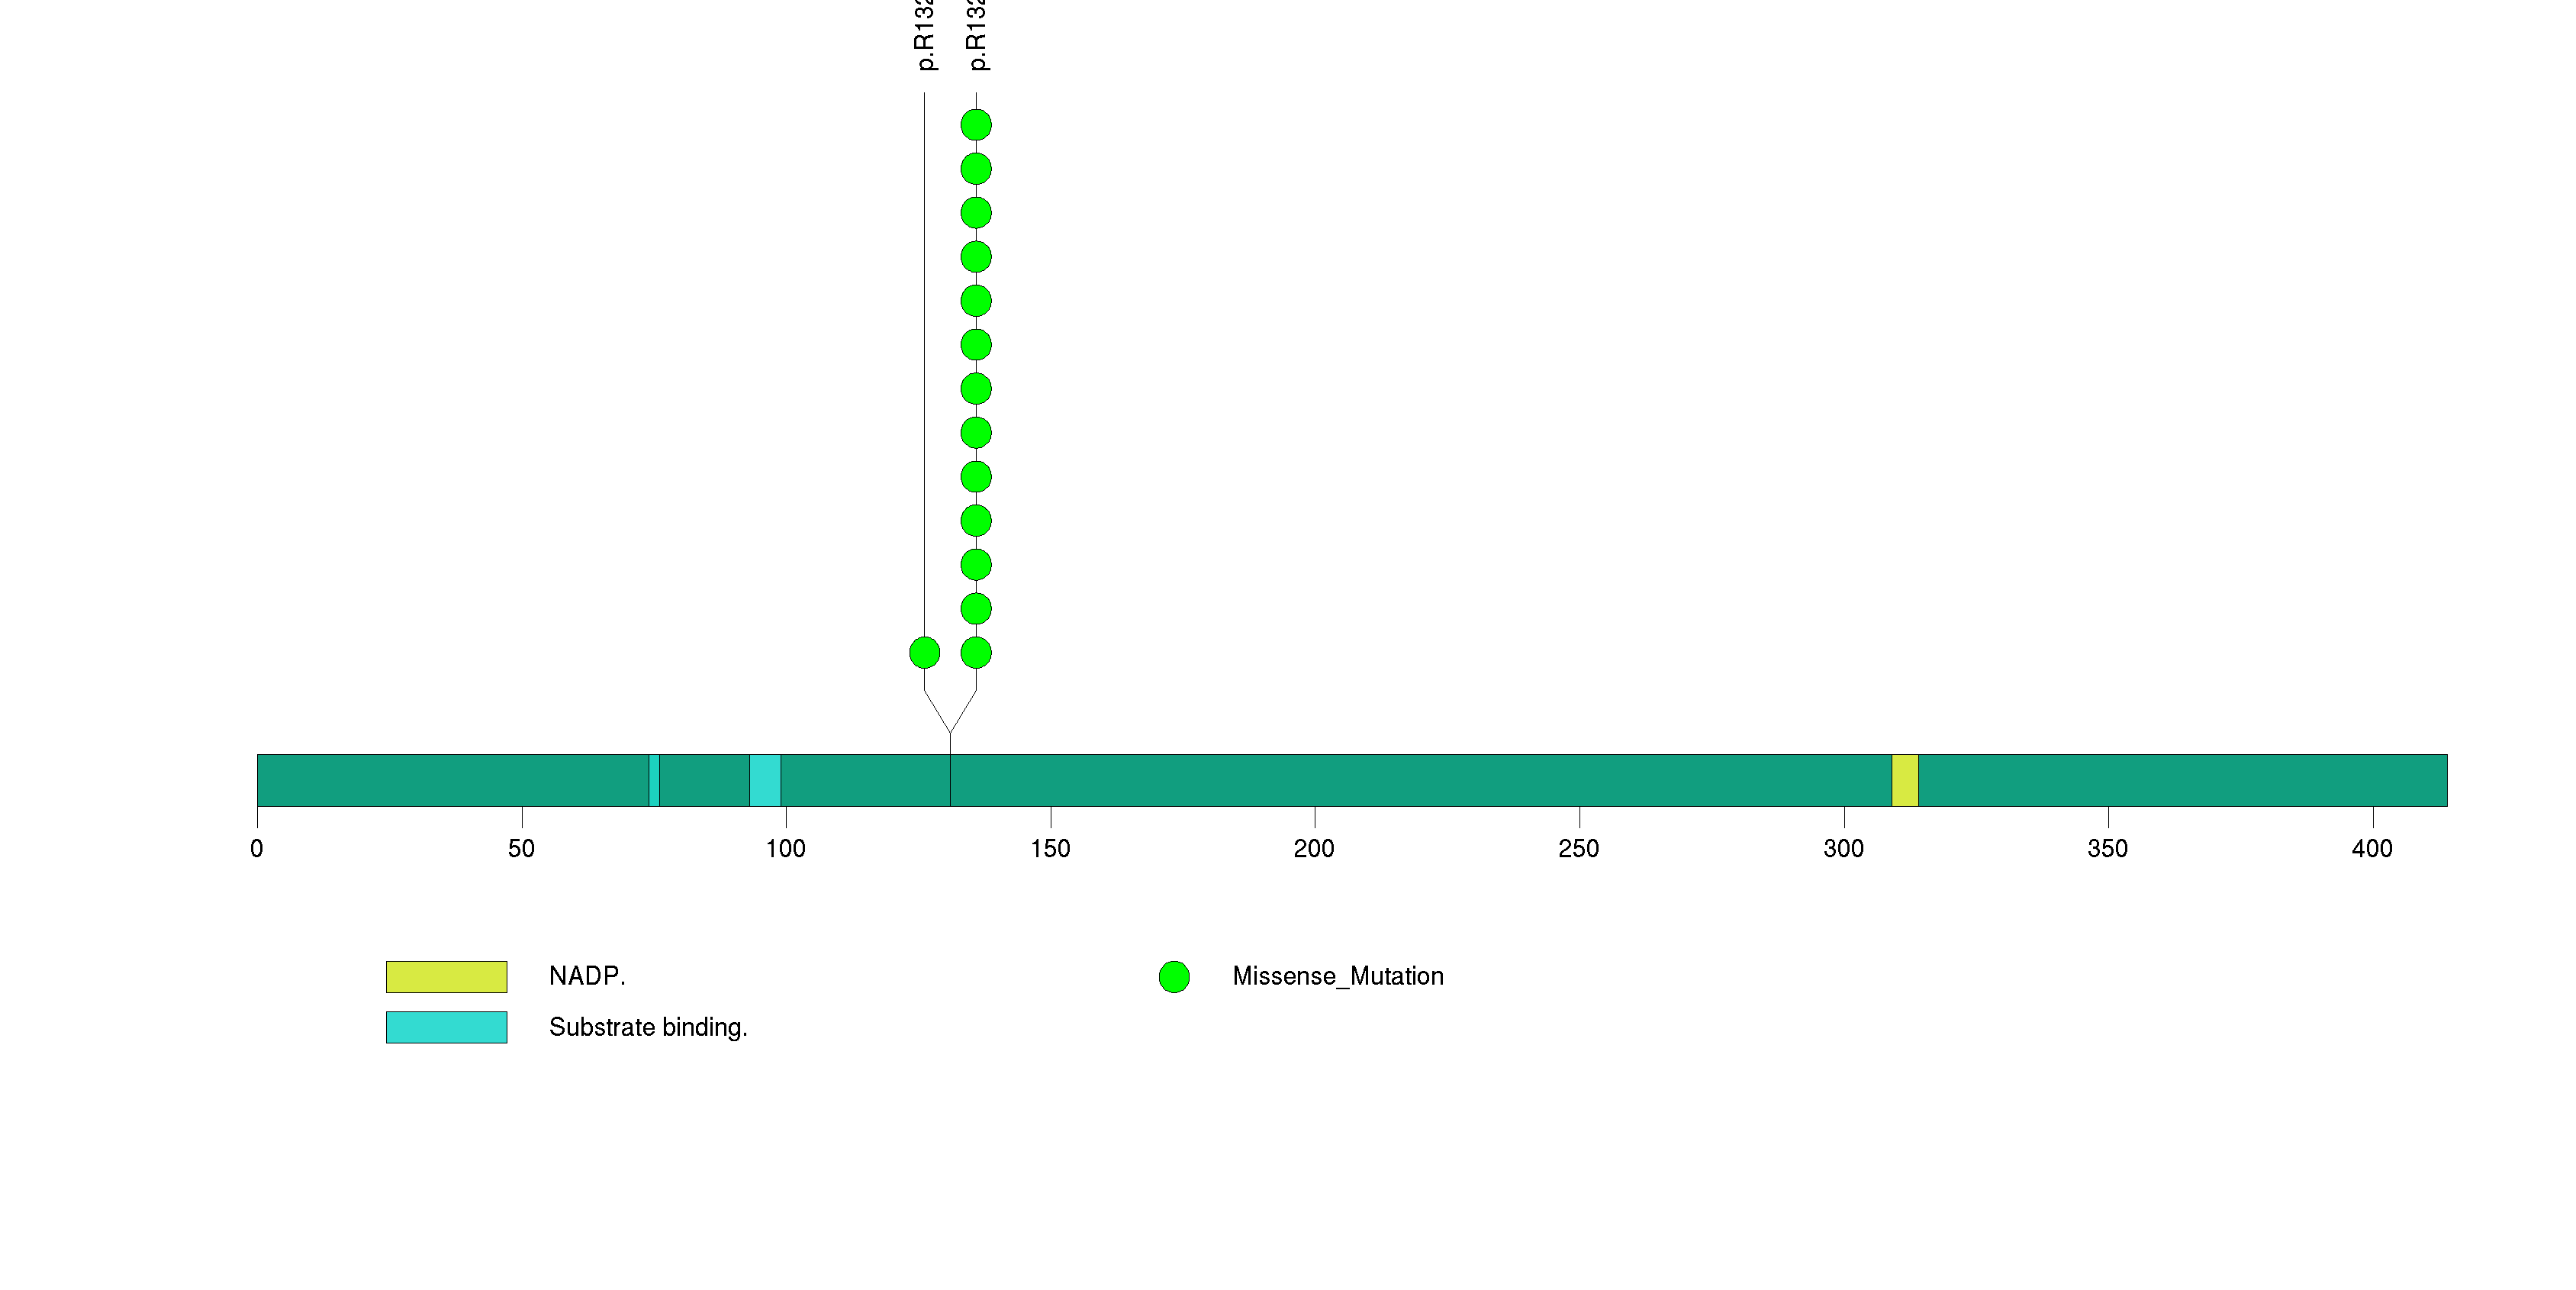
Figure S5. This figure depicts the distribution of mutations and mutation types across the TP53 significant gene.
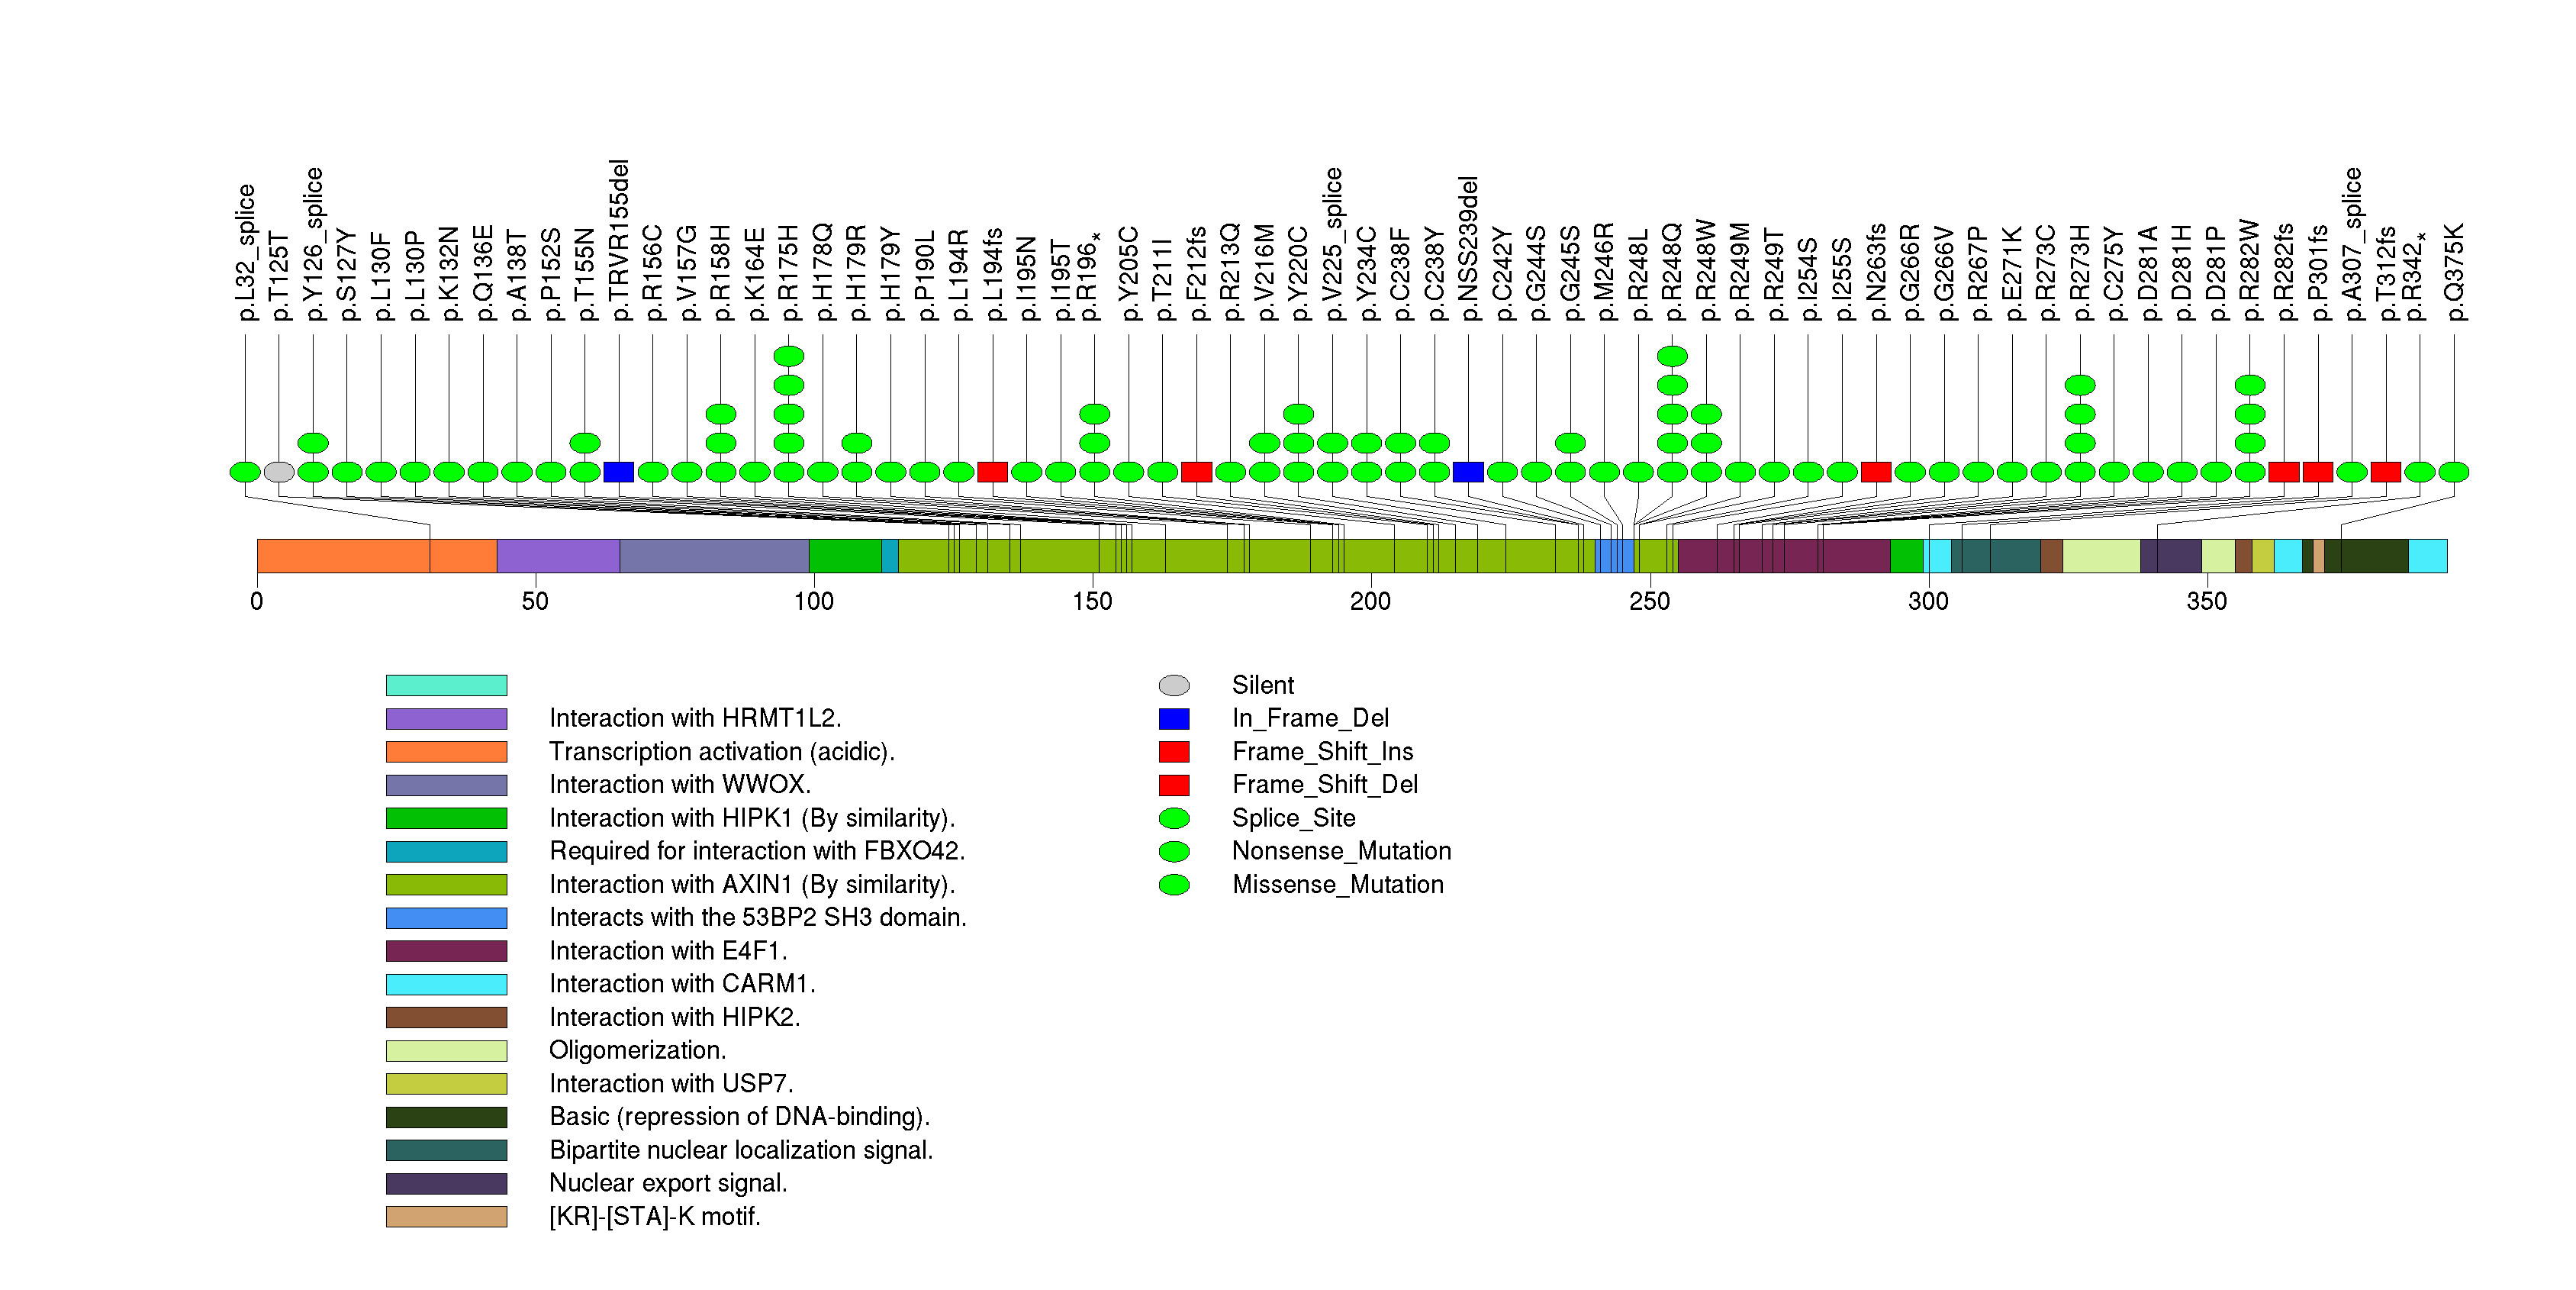
Figure S6. This figure depicts the distribution of mutations and mutation types across the PTEN significant gene.
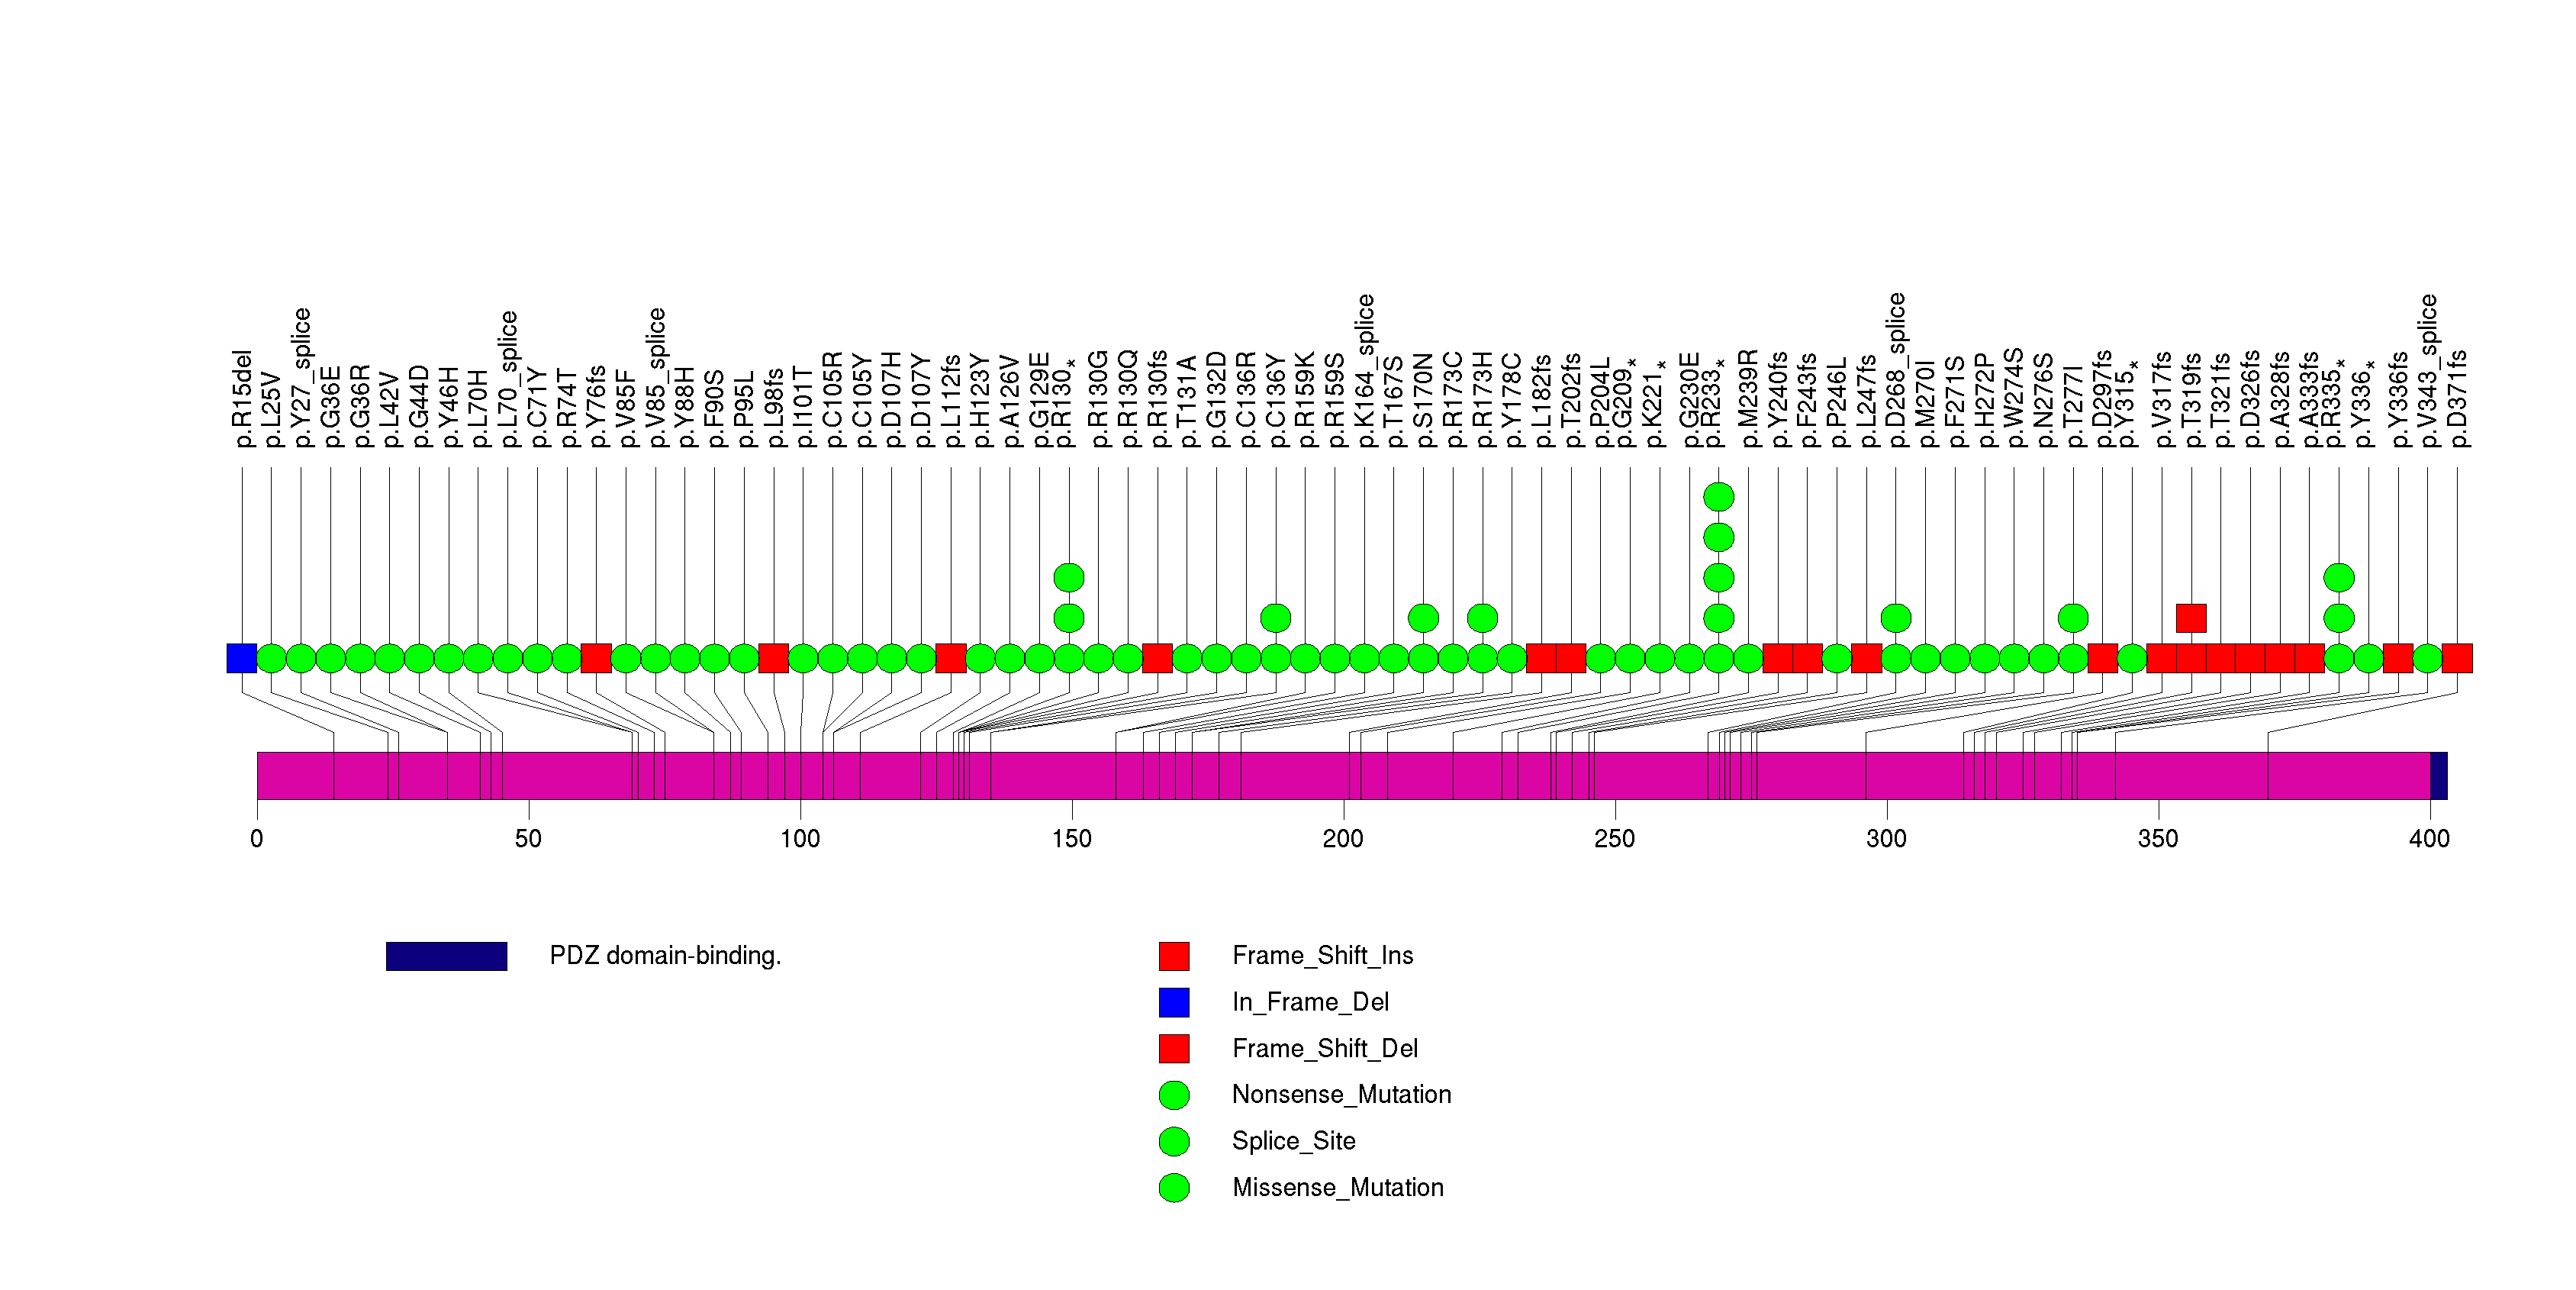
Figure S7. This figure depicts the distribution of mutations and mutation types across the PIK3CA significant gene.
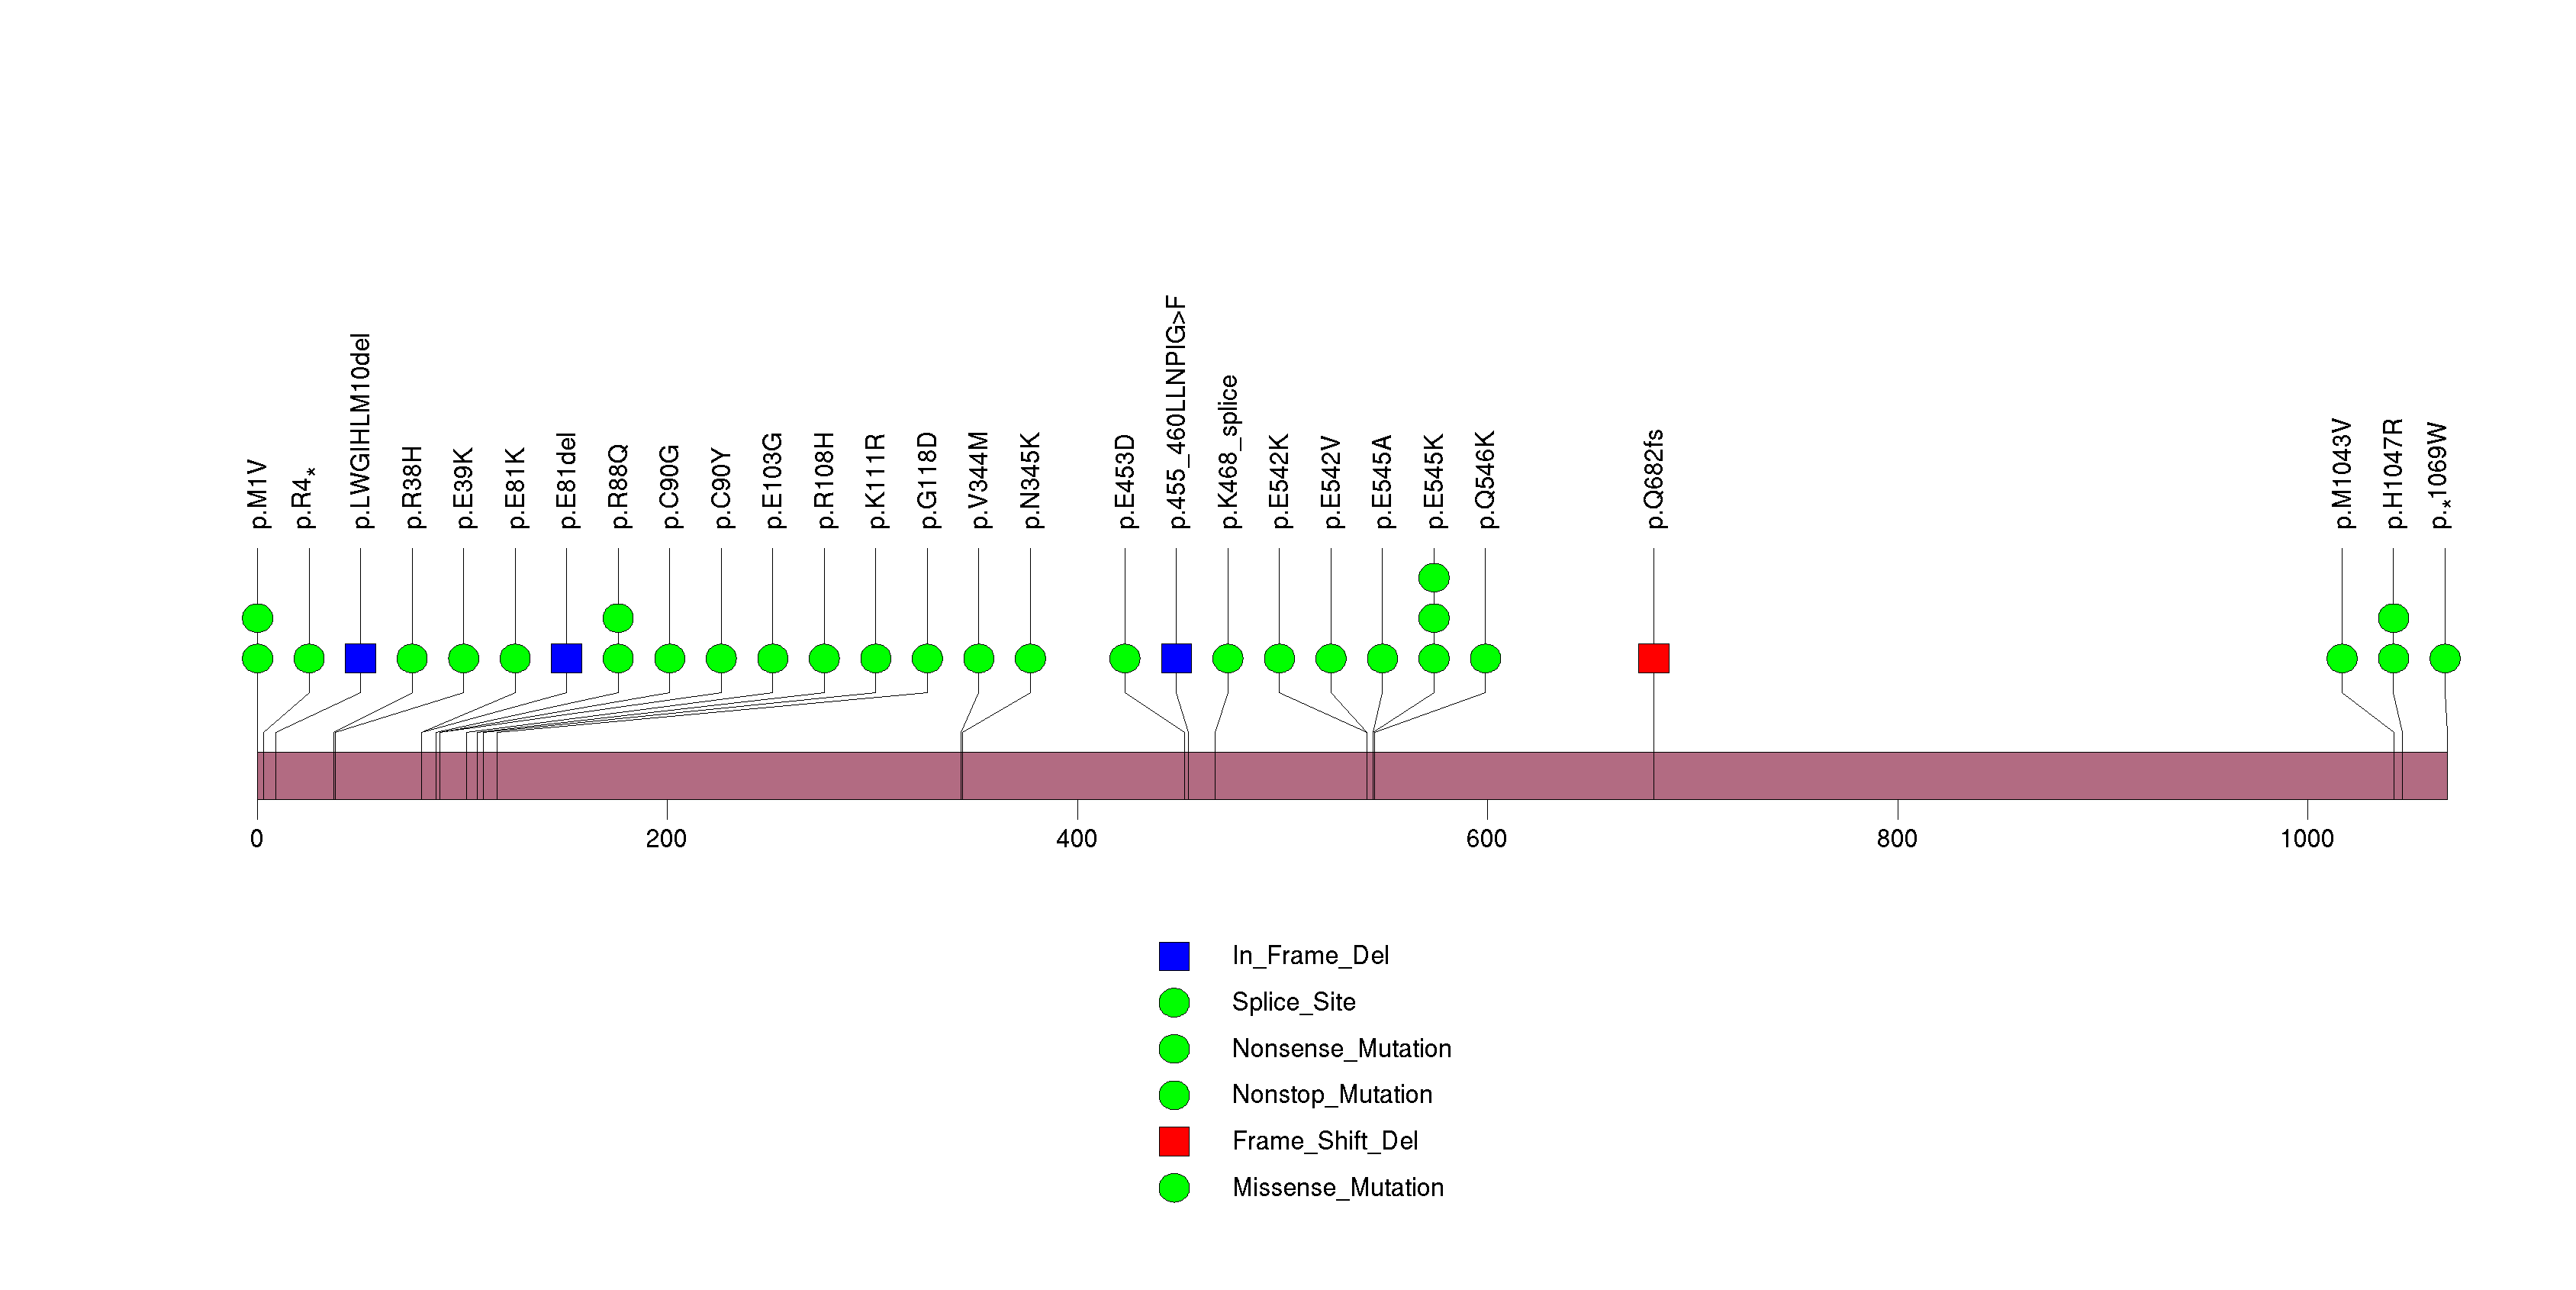
Figure S8. This figure depicts the distribution of mutations and mutation types across the RB1 significant gene.
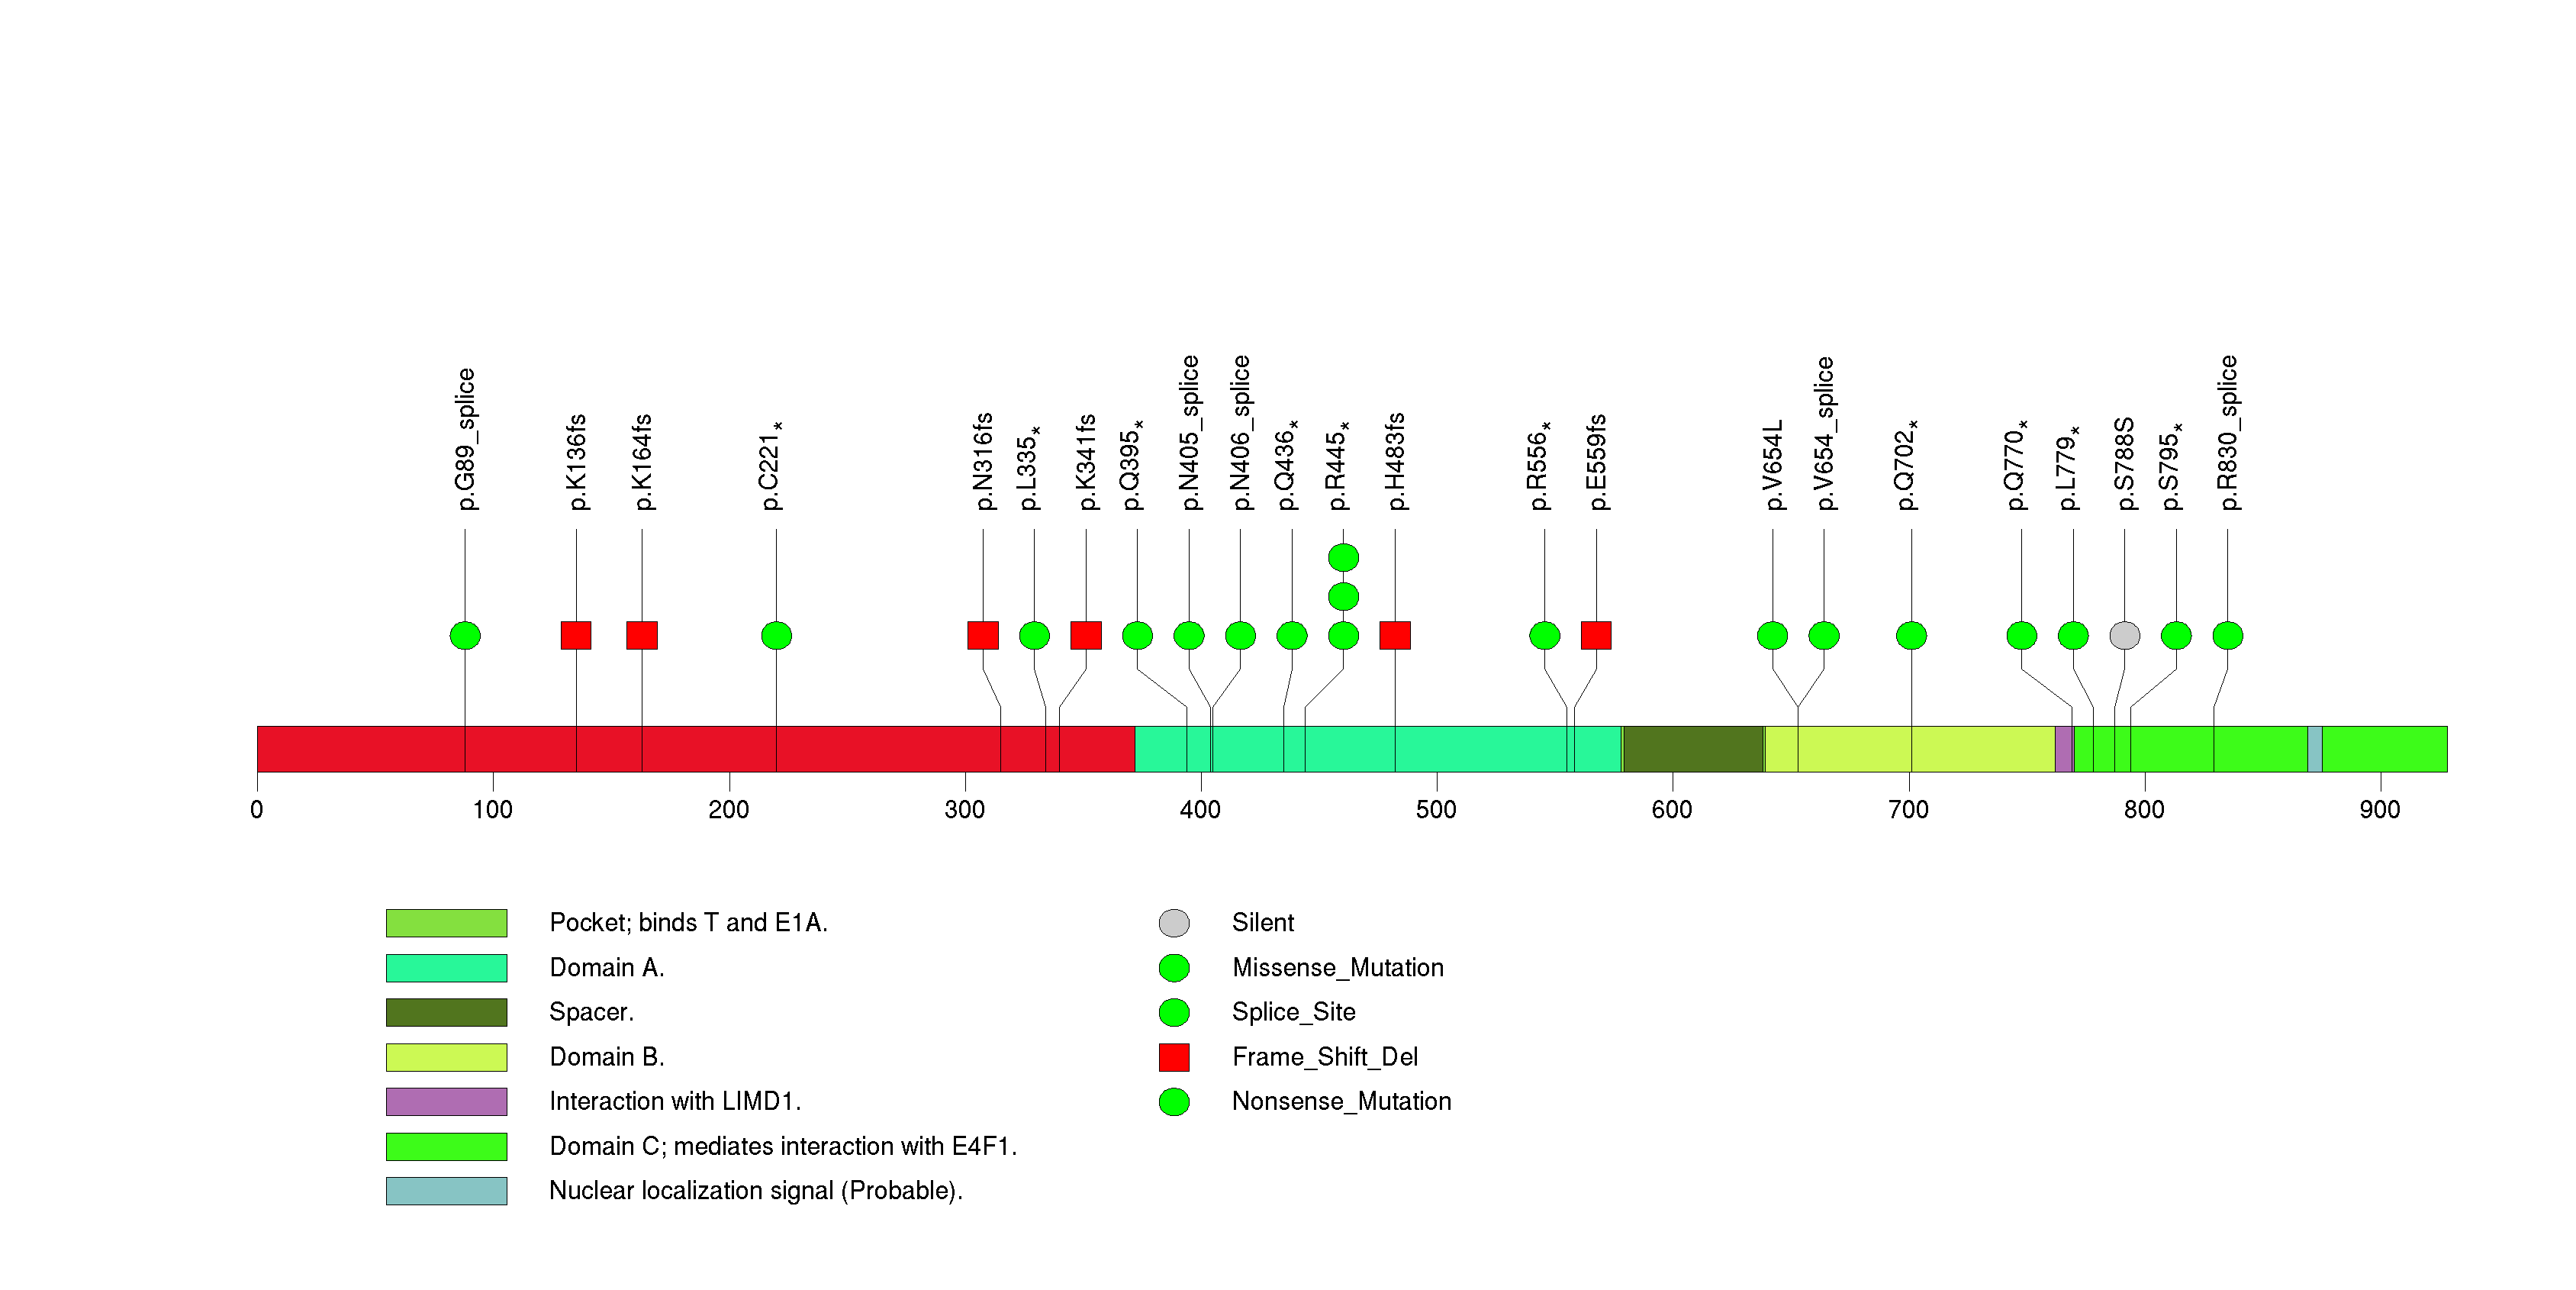
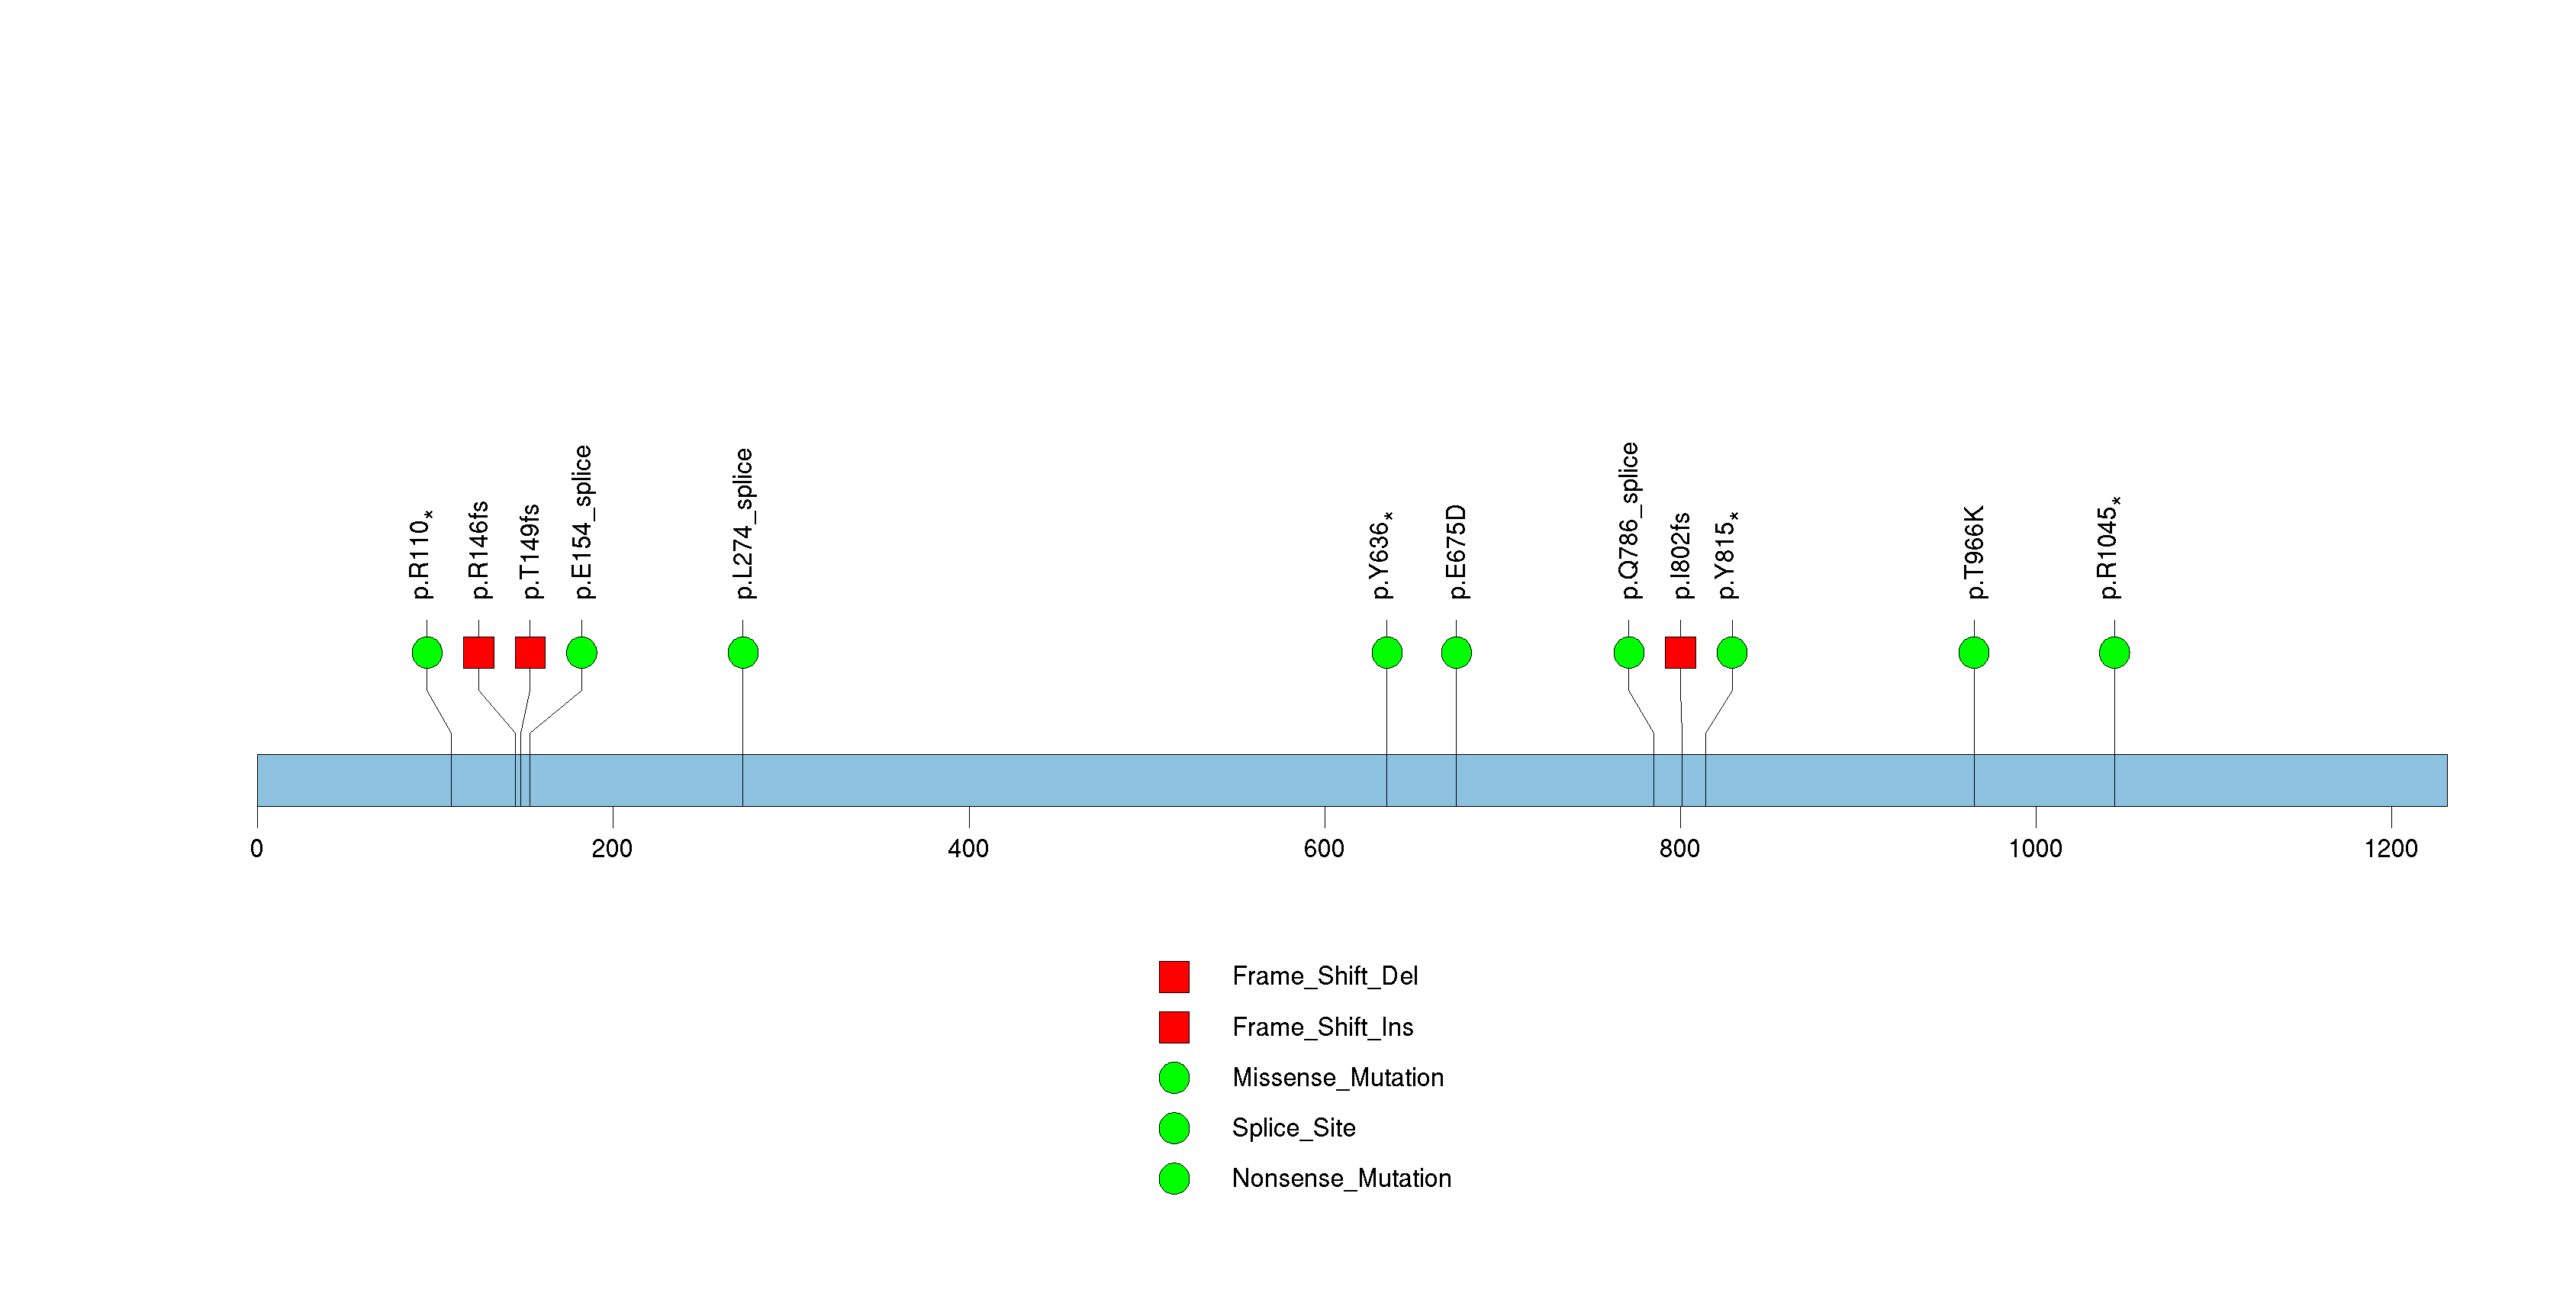
Figure S9. This figure depicts the distribution of mutations and mutation types across the NF1 significant gene.
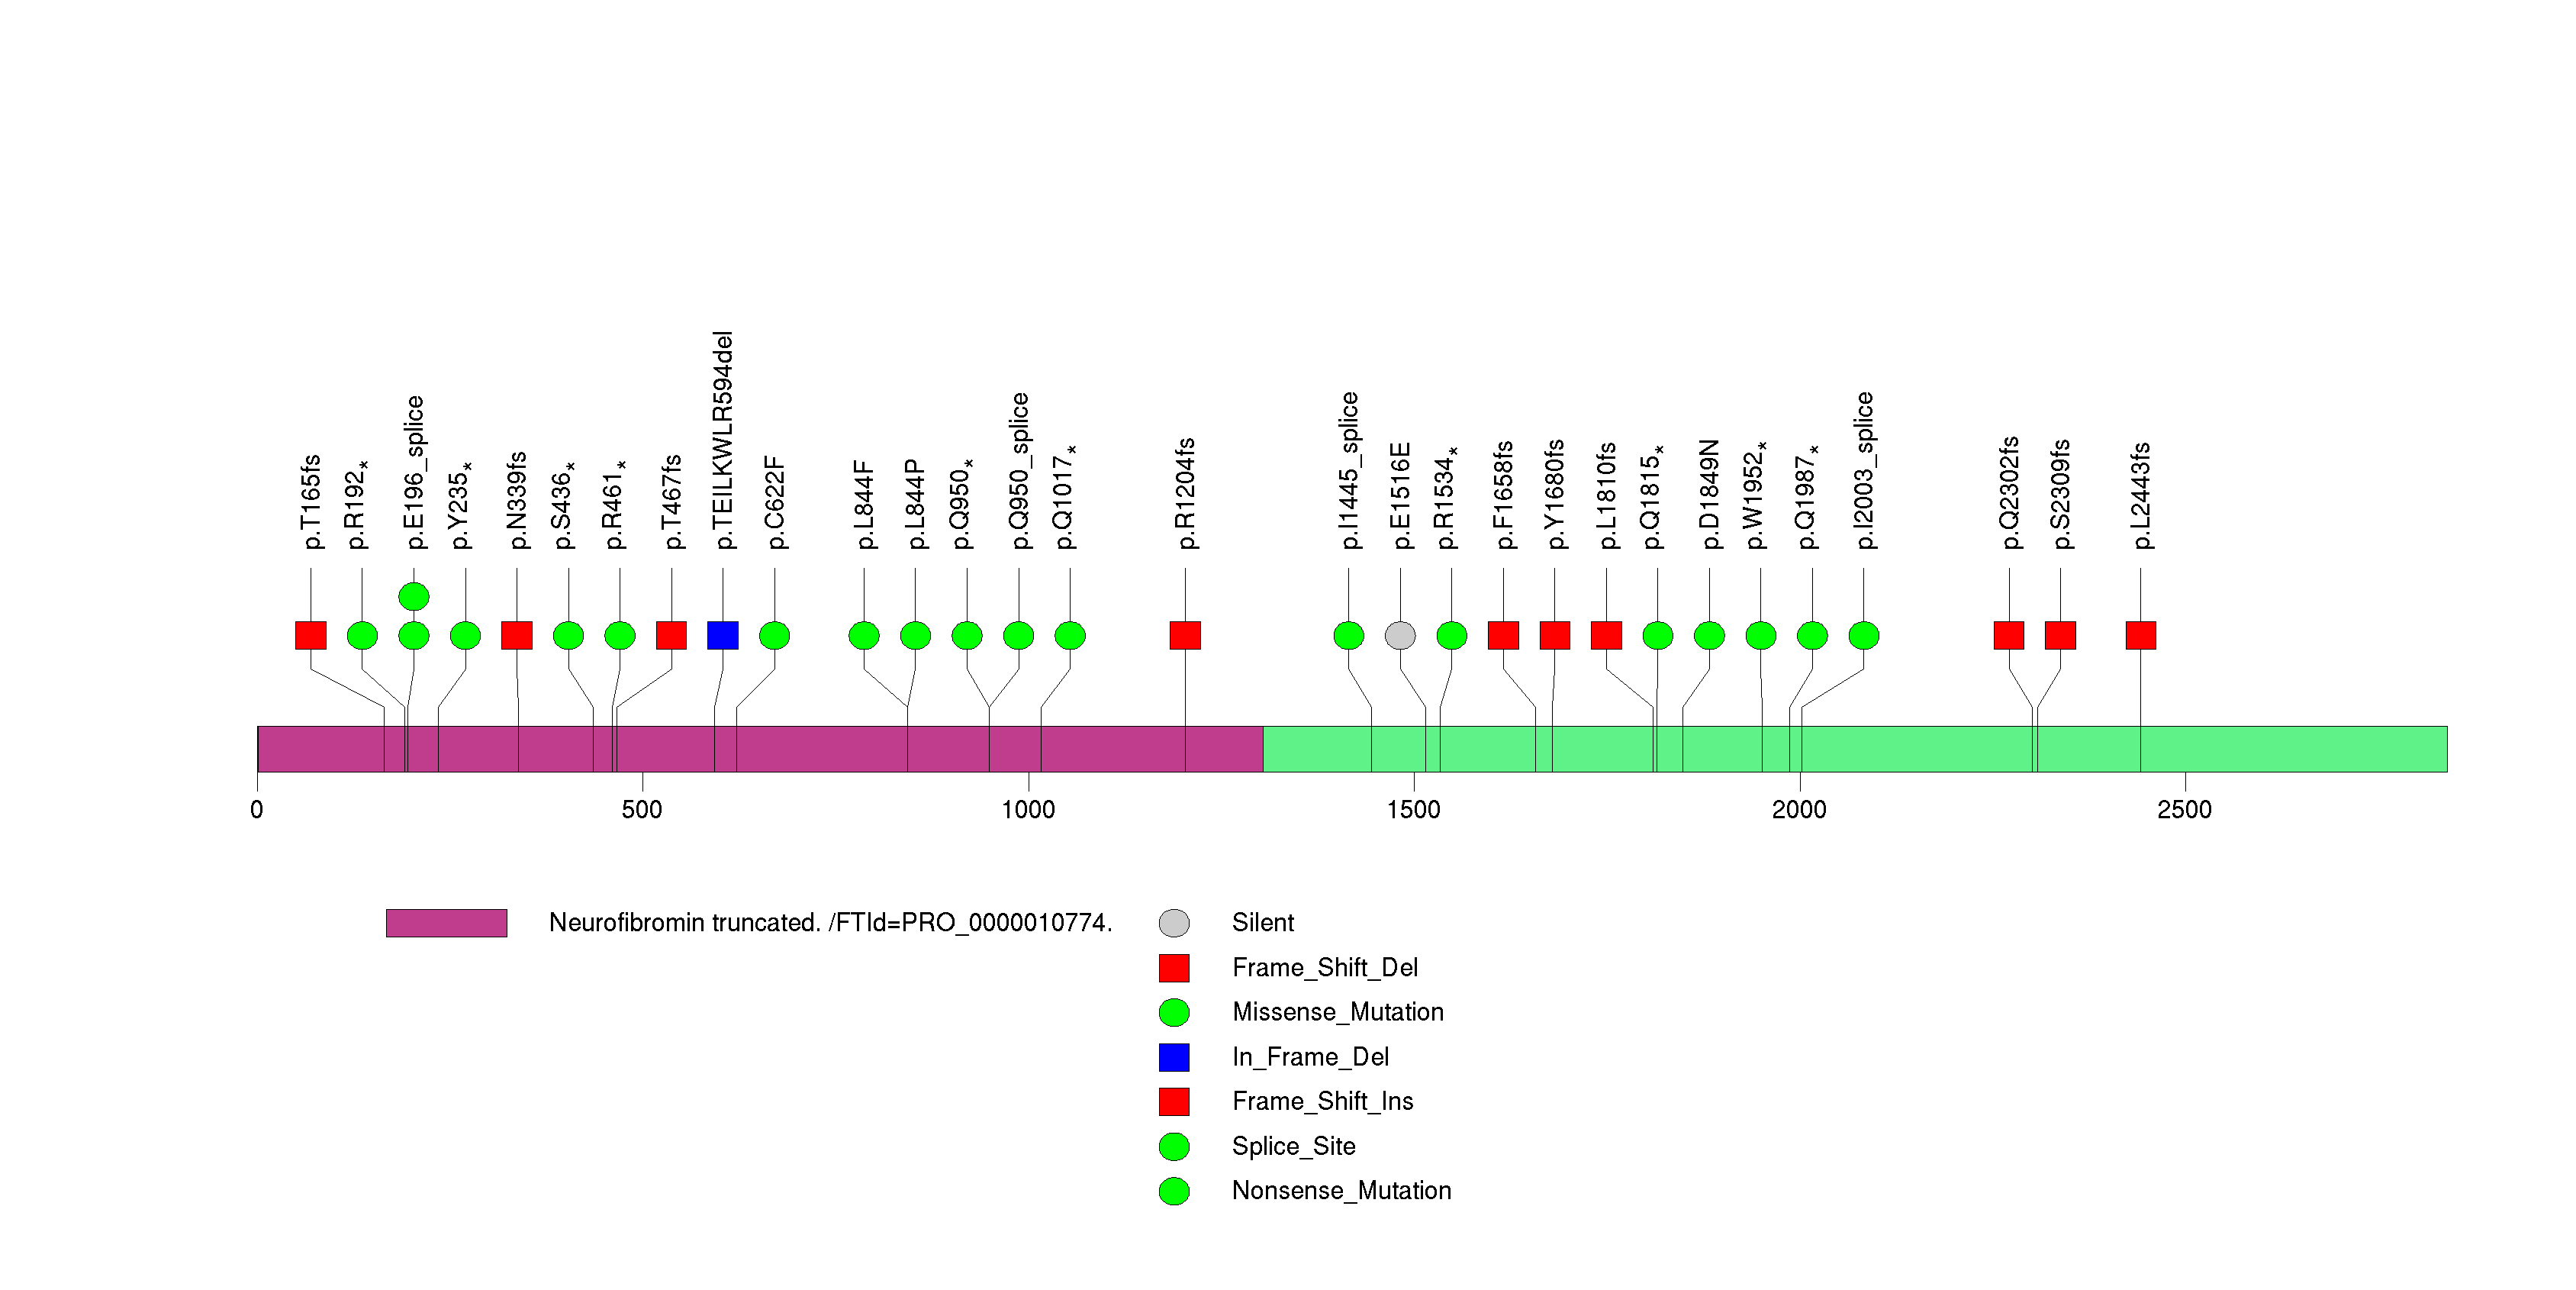
Figure S10. This figure depicts the distribution of mutations and mutation types across the CDC27 significant gene.
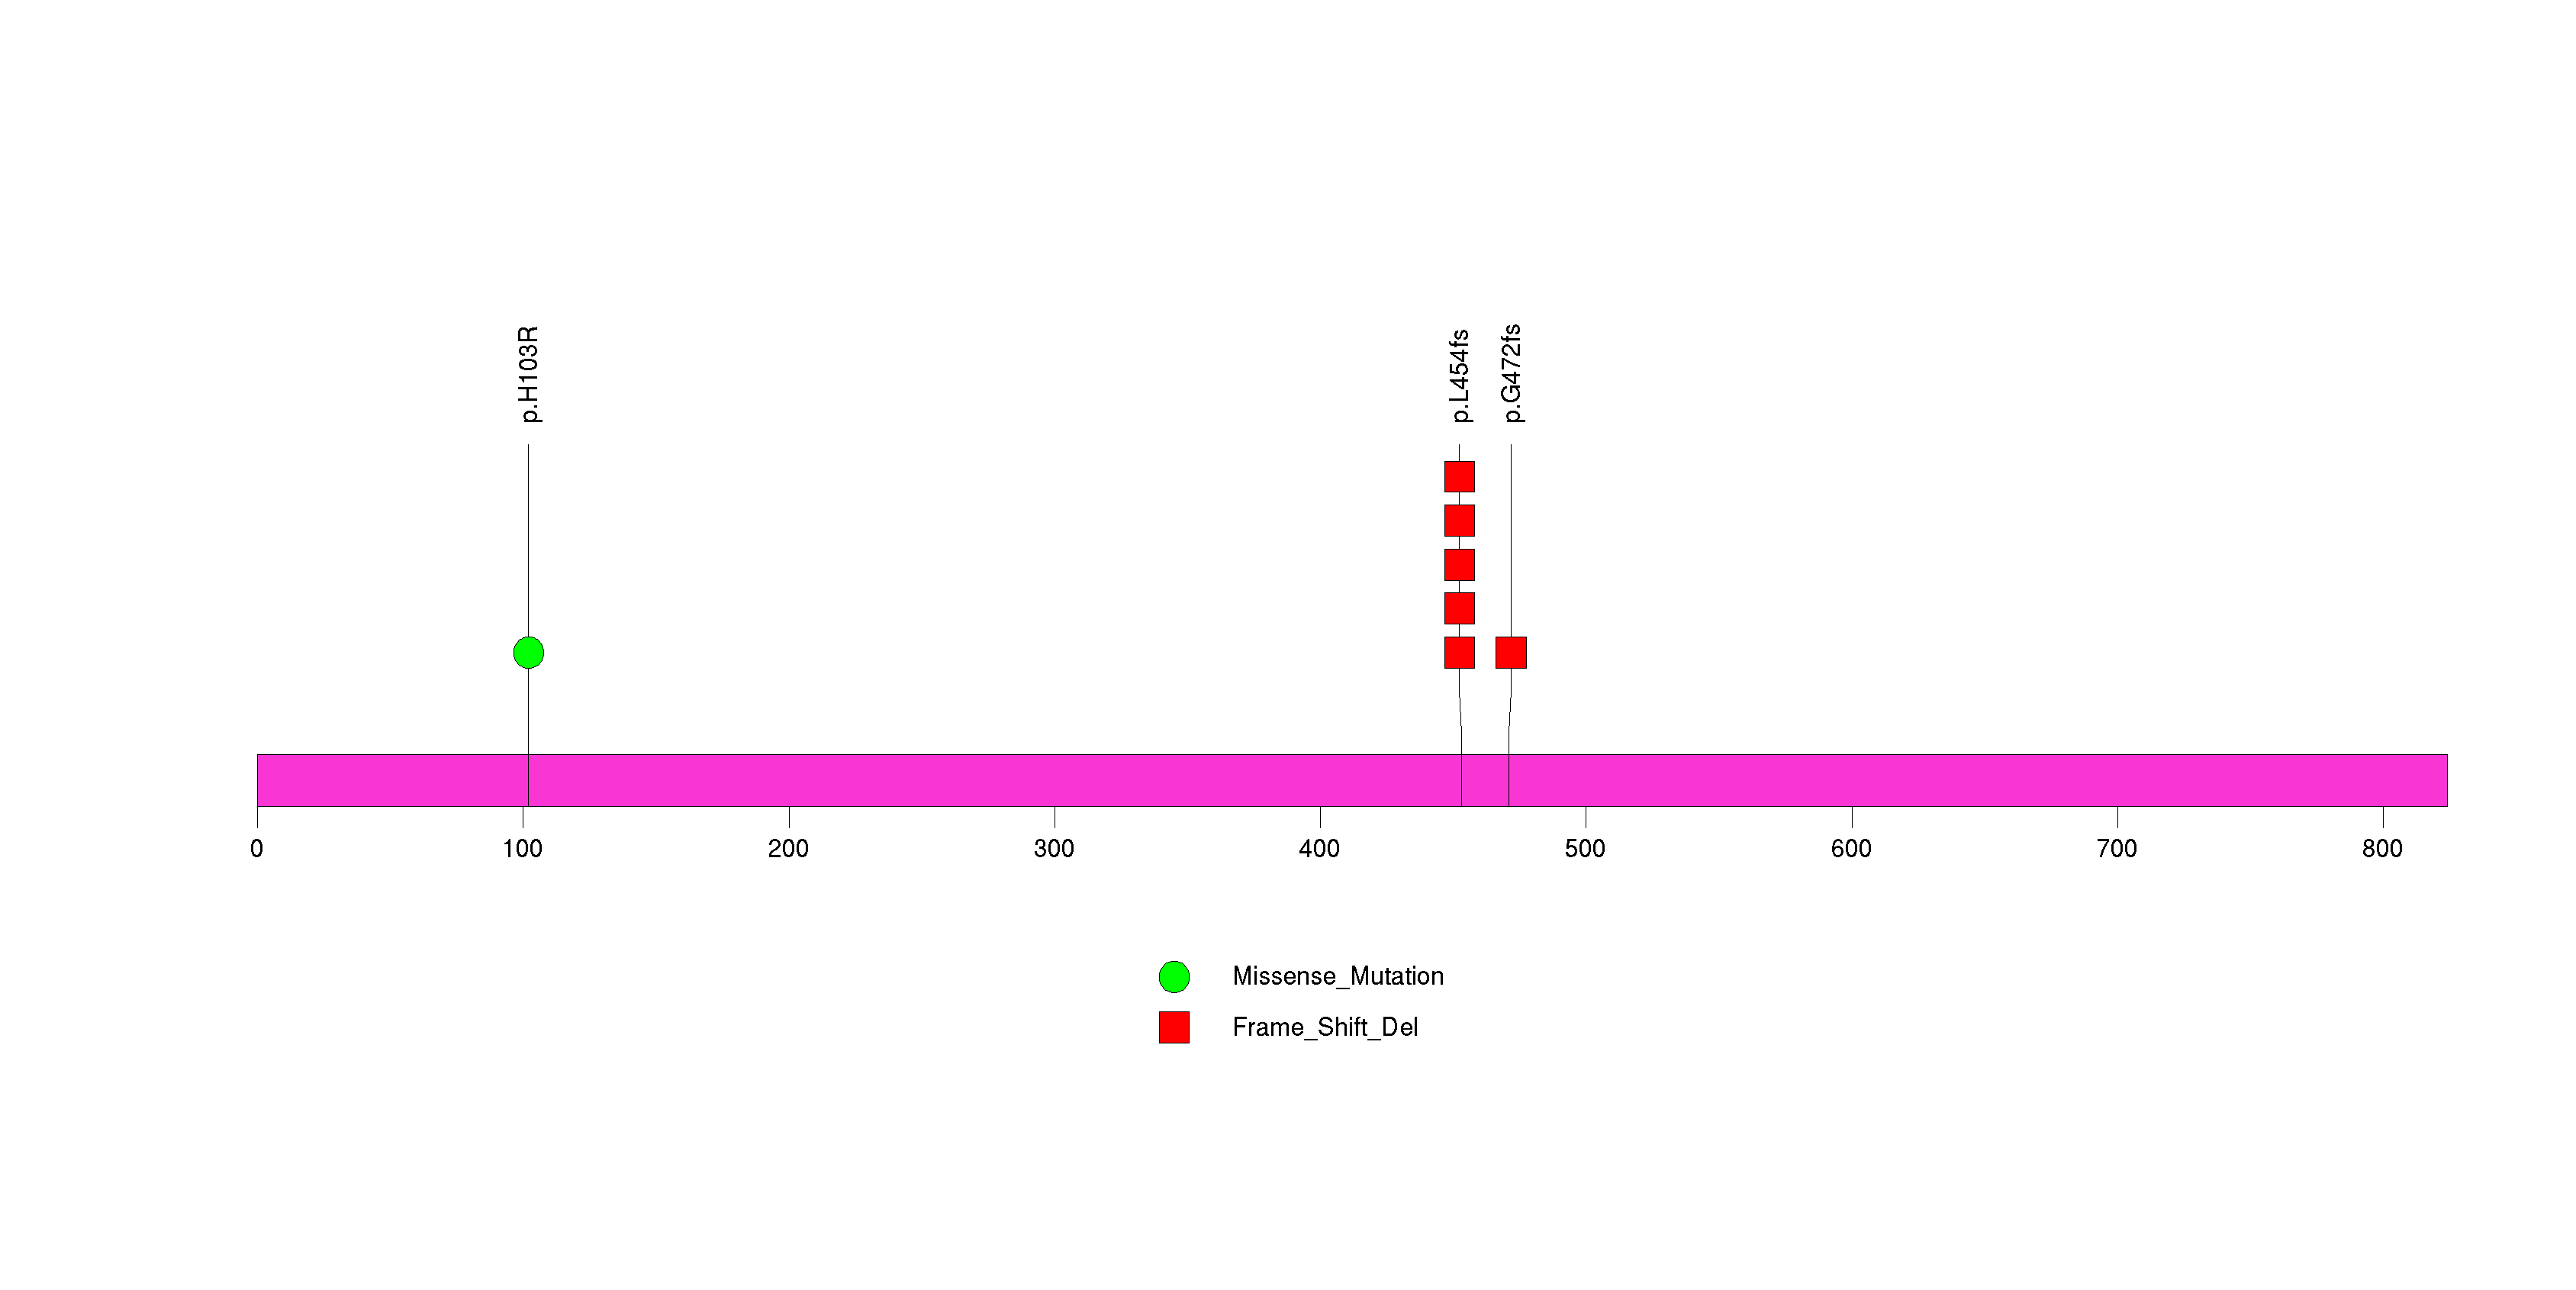
Figure S11. This figure depicts the distribution of mutations and mutation types across the STAG2 significant gene.
In this analysis, COSMIC is used as a filter to increase power by restricting the territory of each gene. Cosmic version: v48.
Table 4. Get Full Table Significantly mutated genes (COSMIC territory only). To access the database please go to: COSMIC. Number of significant genes found: 74. Number of genes displayed: 10
| rank | gene | description | n | cos | n_cos | N_cos | cos_ev | p | q |
|---|---|---|---|---|---|---|---|---|---|
| 1 | TP53 | tumor protein p53 | 96 | 356 | 92 | 101104 | 26305 | 0 | 0 |
| 2 | PTEN | phosphatase and tensin homolog (mutated in multiple advanced cancers 1) | 90 | 767 | 88 | 217828 | 3057 | 0 | 0 |
| 3 | IDH1 | isocitrate dehydrogenase 1 (NADP+), soluble | 14 | 5 | 14 | 1420 | 20888 | 1.4e-14 | 2.2e-11 |
| 4 | PIK3R1 | phosphoinositide-3-kinase, regulatory subunit 1 (alpha) | 33 | 33 | 13 | 9372 | 25 | 9.3e-14 | 1e-10 |
| 5 | PIK3CA | phosphoinositide-3-kinase, catalytic, alpha polypeptide | 33 | 220 | 25 | 62480 | 5654 | 5.6e-13 | 4.1e-10 |
| 6 | RB1 | retinoblastoma 1 (including osteosarcoma) | 24 | 267 | 15 | 75828 | 41 | 6.6e-13 | 4.1e-10 |
| 7 | NF1 | neurofibromin 1 (neurofibromatosis, von Recklinghausen disease, Watson disease) | 30 | 285 | 11 | 80940 | 23 | 7e-13 | 4.1e-10 |
| 8 | EGFR | epidermal growth factor receptor (erythroblastic leukemia viral (v-erb-b) oncogene homolog, avian) | 92 | 293 | 70 | 83212 | 1144 | 7.2e-13 | 4.1e-10 |
| 9 | BRAF | v-raf murine sarcoma viral oncogene homolog B1 | 6 | 89 | 6 | 25276 | 71896 | 1.4e-11 | 7e-09 |
| 10 | ADAM29 | ADAM metallopeptidase domain 29 | 9 | 5 | 3 | 1420 | 3 | 3e-09 | 1.3e-06 |
Note:
n - number of (nonsilent) mutations in this gene across the individual set.
cos = number of unique mutated sites in this gene in COSMIC
n_cos = overlap between n and cos.
N_cos = number of individuals times cos.
cos_ev = total evidence: number of reports in COSMIC for mutations seen in this gene.
p = p-value for seeing the observed amount of overlap in this gene)
q = q-value, False Discovery Rate (Benjamini-Hochberg procedure)
Table 5. Get Full Table A Ranked List of Significantly Mutated Genesets. (Source: MSigDB GSEA Cannonical Pathway Set).Number of significant genesets found: 119. Number of genesets displayed: 10
| rank | geneset | description | genes | N_genes | mut_tally | N | n | npat | nsite | nsil | n1 | n2 | n3 | n4 | n5 | n6 | p_ns_s | p | q |
|---|---|---|---|---|---|---|---|---|---|---|---|---|---|---|---|---|---|---|---|
| 1 | HSA04115_P53_SIGNALING_PATHWAY | Genes involved in p53 signaling pathway | APAF1, ATM, ATR, BAI1, BAX, BBC3, BID, CASP3, CASP8, CASP9, CCNB1, CCNB2, CCNB3, CCND1, CCND2, CCND3, CCNE1, CCNE2, CCNG1, CCNG2, CD82, CDC2, CDK2, CDK4, CDK6, CDKN1A, CDKN2A, CHEK1, CHEK2, CYCS, DDB2, EI24, FAS, GADD45A, GADD45B, GADD45G, GTSE1, IGF1, IGFBP3, LRDD, MDM2, MDM4, P53AIP1, PERP, PMAIP1, PPM1D, PTEN, RCHY1, RFWD2, RPRM, RRM2, RRM2B, SCOTIN, SERPINB5, SERPINE1, SESN1, SESN2, SESN3, SFN, SIAH1, STEAP3, THBS1, TNFRSF10B, TP53, TP53I3, TP73, TSC2, ZMAT3 | 65 | ATM(4), ATR(4), CASP9(1), CCNB3(2), CCND2(2), CCND3(1), CCNE1(1), CCNE2(1), CCNG1(2), CDKN1A(1), CDKN2A(2), CHEK1(3), CHEK2(1), DDB2(1), GADD45B(1), GTSE1(1), IGF1(2), LRDD(1), MDM2(2), MDM4(1), PPM1D(1), PTEN(90), RPRM(1), RRM2(1), SERPINB5(1), SERPINE1(2), SESN1(1), SESN3(1), SFN(1), THBS1(2), TP53(96), TSC2(4) | 27921280 | 235 | 164 | 181 | 17 | 42 | 44 | 28 | 51 | 70 | 0 | 4.33e-14 | <1.00e-15 | <3.24e-14 |
| 2 | METPATHWAY | The hepatocyte growth factor receptor c-Met stimulates proliferation and alters cell motility and adhesion on binding the ligand HGF. | ACTA1, CRK, CRKL, DOCK1, ELK1, FOS, GAB1, GRB2, GRF2, HGF, HRAS, ITGA1, ITGB1, JUN, MAP2K1, MAP2K2, MAP4K1, MAPK1, MAPK3, MAPK8, MET, PAK1, PIK3CA, PIK3R1, PTEN, PTK2, PTK2B, PTPN11, PXN, RAF1, RAP1A, RAP1B, RASA1, SOS1, SRC, STAT3 | 35 | CRKL(1), DOCK1(2), ELK1(2), FOS(1), HGF(1), ITGA1(2), ITGB1(1), MAP2K1(1), MAP4K1(2), MAPK1(2), MAPK3(1), MAPK8(1), MET(3), PAK1(1), PIK3CA(33), PIK3R1(33), PTEN(90), PTK2B(3), PTPN11(4), PXN(1), RAF1(1), SOS1(3), SRC(2), STAT3(1) | 18896094 | 192 | 150 | 164 | 5 | 21 | 37 | 25 | 38 | 71 | 0 | <1.00e-15 | <1.00e-15 | <3.24e-14 |
| 3 | IGF1MTORPATHWAY | Growth factor IGF-1 activates AKT, Gsk3-beta, and mTOR to promote muscle hypertrophy. | AKT1, EIF2B5, EIF2S1, EIF2S2, EIF2S3, EIF4E, EIF4EBP1, FRAP1, GSK3B, IGF1, IGF1R, INPPL1, PDK2, PDPK1, PIK3CA, PIK3R1, PPP2CA, PTEN, RPS6, RPS6KB1 | 19 | AKT1(1), EIF2S2(1), EIF2S3(2), GSK3B(1), IGF1(2), IGF1R(3), INPPL1(3), PIK3CA(33), PIK3R1(33), PTEN(90) | 8404717 | 169 | 142 | 141 | 3 | 11 | 32 | 23 | 31 | 72 | 0 | 2.11e-14 | <1.00e-15 | <3.24e-14 |
| 4 | SIG_PIP3_SIGNALING_IN_CARDIAC_MYOCTES | Genes related to PIP3 signaling in cardiac myocytes | AKT1, AKT2, AKT3, BAD, BCL2L1, CDC42, CDK2, CDKN1B, CDKN2A, CREB1, CREB3, CREB5, EBP, ERBB4, F2RL2, FOXO3A, FRAP1, GAB1, GADD45A, GRB2, GSK3A, GSK3B, IFI27, IGF1, IGFBP1, INPPL1, IRS1, IRS2, IRS4, MET, MYC, NOLC1, P101-PI3K, PAK1, PAK2, PAK3, PAK4, PAK6, PAK7, PARD3, PARD6A, PDK1, PIK3CA, PIK3CD, PPP1R13B, PREX1, PSCD3, PTEN, PTK2, PTPN1, RPS6KA1, RPS6KA2, RPS6KA3, RPS6KB1, SFN, SHC1, SLC2A4, SOS1, SOS2, TSC1, TSC2, YWHAB, YWHAE, YWHAG, YWHAH, YWHAQ, YWHAZ | 63 | AKT1(1), CDKN1B(1), CDKN2A(2), CREB1(1), ERBB4(1), GSK3B(1), IGF1(2), INPPL1(3), IRS1(4), IRS4(3), MET(3), MYC(1), PAK1(1), PAK3(1), PAK4(3), PAK7(1), PARD3(1), PIK3CA(33), PREX1(5), PTEN(90), RPS6KA1(1), RPS6KA2(2), RPS6KA3(1), SFN(1), SOS1(3), TSC2(4), YWHAE(2), YWHAH(1) | 32949675 | 173 | 142 | 151 | 13 | 21 | 34 | 25 | 30 | 63 | 0 | 1.18e-09 | <1.00e-15 | <3.24e-14 |
| 5 | EIF4PATHWAY | The eIF-4F complex recognizes 5' mRNA caps, recruits RNA helicases, and maintains mRNA-ribosome bridging. | AKT1, EIF4A1, EIF4A2, EIF4E, EIF4EBP1, EIF4G1, EIF4G2, EIF4G3, FRAP1, GHR, IRS1, MAPK1, MAPK14, MAPK3, MKNK1, PABPC1, PDK2, PDPK1, PIK3CA, PIK3R1, PRKCA, PRKCB1, PTEN, RPS6KB1 | 22 | AKT1(1), EIF4A1(1), EIF4G1(1), EIF4G3(1), IRS1(4), MAPK1(2), MAPK3(1), PIK3CA(33), PIK3R1(33), PRKCA(1), PTEN(90) | 11981597 | 168 | 138 | 140 | 4 | 13 | 33 | 23 | 29 | 70 | 0 | 2.18e-13 | <1.00e-15 | <3.24e-14 |
| 6 | PTENPATHWAY | PTEN suppresses AKT-induced cell proliferation and antagonizes the action of PI3K. | AKT1, BCAR1, CDKN1B, FOXO3A, GRB2, ILK, ITGB1, MAPK1, MAPK3, PDK2, PDPK1, PIK3CA, PIK3R1, PTEN, PTK2, SHC1, SOS1, TNFSF6 | 16 | AKT1(1), CDKN1B(1), ITGB1(1), MAPK1(2), MAPK3(1), PIK3CA(33), PIK3R1(33), PTEN(90), SOS1(3) | 8259361 | 165 | 137 | 137 | 0 | 11 | 33 | 24 | 29 | 68 | 0 | <1.00e-15 | <1.00e-15 | <3.24e-14 |
| 7 | ARFPATHWAY | Cyclin-dependent kinase inhibitor 2A is a tumor suppressor that induces G1 arrest and can activate the p53 pathway, leading to G2/M arrest. | ABL1, CDKN2A, E2F1, MDM2, MYC, PIK3CA, PIK3R1, POLR1A, POLR1B, POLR1C, POLR1D, RAC1, RB1, TBX2, TP53, TWIST1 | 16 | ABL1(2), CDKN2A(2), MDM2(2), MYC(1), PIK3CA(33), PIK3R1(33), POLR1A(2), POLR1B(1), RB1(24), TP53(96) | 8591371 | 196 | 136 | 146 | 2 | 36 | 27 | 24 | 38 | 70 | 1 | <1.00e-15 | <1.00e-15 | <3.24e-14 |
| 8 | G1PATHWAY | CDK4/6-cyclin D and CDK2-cyclin E phosphorylate Rb, which allows the transcription of genes needed for the G1/S cell cycle transition. | ABL1, ATM, ATR, CCNA1, CCND1, CCNE1, CDC2, CDC25A, CDK2, CDK4, CDK6, CDKN1A, CDKN1B, CDKN2A, CDKN2B, DHFR, E2F1, GSK3B, HDAC1, MADH3, MADH4, RB1, SKP2, TFDP1, TGFB1, TGFB2, TGFB3, TP53 | 25 | ABL1(2), ATM(4), ATR(4), CCNA1(1), CCNE1(1), CDKN1A(1), CDKN1B(1), CDKN2A(2), CDKN2B(2), GSK3B(1), RB1(24), SKP2(1), TFDP1(1), TP53(96) | 12803078 | 141 | 103 | 102 | 4 | 30 | 18 | 15 | 33 | 44 | 1 | 5.53e-13 | <1.00e-15 | <3.24e-14 |
| 9 | P53PATHWAY | p53 induces cell cycle arrest or apoptosis under conditions of DNA damage. | APAF1, ATM, BAX, BCL2, CCND1, CCNE1, CDK2, CDK4, CDKN1A, E2F1, GADD45A, MDM2, PCNA, RB1, TIMP3, TP53 | 16 | ATM(4), BCL2(2), CCNE1(1), CDKN1A(1), MDM2(2), RB1(24), TIMP3(1), TP53(96) | 7755533 | 131 | 96 | 92 | 3 | 30 | 16 | 13 | 26 | 45 | 1 | 2.65e-12 | <1.00e-15 | <3.24e-14 |
| 10 | RBPATHWAY | The ATM protein kinase recognizes DNA damage and blocks cell cycle progression by phosphorylating chk1 and p53, which normally inhibits Rb to allow G1/S transitions. | ATM, CDC2, CDC25A, CDC25B, CDC25C, CDK2, CDK4, CHEK1, MYT1, RB1, TP53, WEE1, YWHAH | 12 | ATM(4), CHEK1(3), RB1(24), TP53(96), WEE1(1), YWHAH(1) | 7513078 | 129 | 95 | 90 | 2 | 30 | 15 | 14 | 27 | 42 | 1 | 1.07e-12 | <1.00e-15 | <3.24e-14 |
In brief, we tabulate the number of mutations and the number of covered bases for each gene. The counts are broken down by mutation context category: four context categories that are discovered by MutSig, and one for indel and 'null' mutations, which include indels, nonsense mutations, splice-site mutations, and non-stop (read-through) mutations. For each gene, we calculate the probability of seeing the observed constellation of mutations, i.e. the product P1 x P2 x ... x Pm, or a more extreme one, given the background mutation rates calculated across the dataset. [1]
This is an experimental feature. The full results of the analysis summarized in this report can be downloaded from the TCGA Data Coordination Center.