This pipeline uses various statistical tests to identify RPPAs whose expression levels correlated to selected clinical features.
Testing the association between 174 genes and 9 clinical features across 212 samples, statistically thresholded by Q value < 0.05, 6 clinical features related to at least one genes.
-
1 gene correlated to 'Time to Death'.
-
SMAD3|SMAD3-R-V
-
1 gene correlated to 'GENDER'.
-
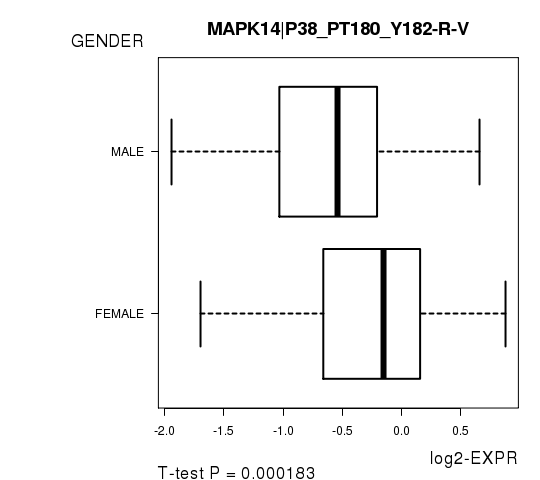
MAPK14|P38_PT180_Y182-R-V
-
2 genes correlated to 'RADIATIONS.RADIATION.REGIMENINDICATION'.
-
BCL2|BCL-2-R-C , COL6A1|COLLAGEN_VI-R-V
-
1 gene correlated to 'NUMBERPACKYEARSSMOKED'.
-
CHEK2|CHK2-M-C
-
3 genes correlated to 'NUMBER.OF.LYMPH.NODES'.
-
ANXA1|ANNEXIN_I-R-V , SRC|SRC_PY416-R-C , YAP1|YAP_PS127-R-C
-
2 genes correlated to 'NEOPLASM.DISEASESTAGE'.
-
MAPK1 MAPK3|MAPK_PT202_Y204-R-V , MAP2K1|MEK1_PS217_S221-R-V
-
No genes correlated to 'AGE', 'YEAROFTOBACCOSMOKINGONSET', and 'LYMPH.NODE.METASTASIS'.
Complete statistical result table is provided in Supplement Table 1
Table 1. Get Full Table This table shows the clinical features, statistical methods used, and the number of genes that are significantly associated with each clinical feature at Q value < 0.05.
| Clinical feature | Statistical test | Significant genes | Associated with | Associated with | ||
|---|---|---|---|---|---|---|
| Time to Death | Cox regression test | N=1 | shorter survival | N=1 | longer survival | N=0 |
| AGE | Spearman correlation test | N=0 | ||||
| GENDER | t test | N=1 | male | N=0 | female | N=1 |
| RADIATIONS RADIATION REGIMENINDICATION | t test | N=2 | yes | N=0 | no | N=2 |
| NUMBERPACKYEARSSMOKED | Spearman correlation test | N=1 | higher numberpackyearssmoked | N=1 | lower numberpackyearssmoked | N=0 |
| YEAROFTOBACCOSMOKINGONSET | Spearman correlation test | N=0 | ||||
| LYMPH NODE METASTASIS | ANOVA test | N=0 | ||||
| NUMBER OF LYMPH NODES | Spearman correlation test | N=3 | higher number.of.lymph.nodes | N=0 | lower number.of.lymph.nodes | N=3 |
| NEOPLASM DISEASESTAGE | ANOVA test | N=2 |
Table S1. Basic characteristics of clinical feature: 'Time to Death'
| Time to Death | Duration (Months) | 0.1-210.9 (median=13.2) |
| censored | N = 105 | |
| death | N = 107 | |
| Significant markers | N = 1 | |
| associated with shorter survival | 1 | |
| associated with longer survival | 0 |
Table S2. Get Full Table List of one gene significantly associated with 'Time to Death' by Cox regression test
| HazardRatio | Wald_P | Q | C_index | |
|---|---|---|---|---|
| SMAD3|SMAD3-R-V | 3.5 | 0.0001412 | 0.025 | 0.581 |
Figure S1. Get High-res Image As an example, this figure shows the association of SMAD3|SMAD3-R-V to 'Time to Death'. four curves present the cumulative survival rates of 4 quartile subsets of patients. P value = 0.000141 with univariate Cox regression analysis using continuous log-2 expression values.
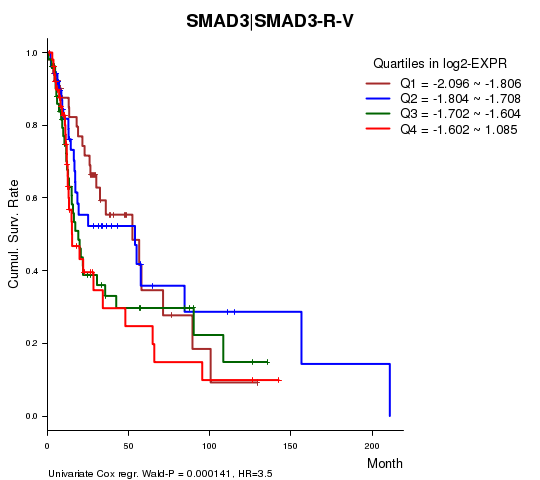
Table S3. Basic characteristics of clinical feature: 'AGE'
| AGE | Mean (SD) | 62.12 (12) |
| Significant markers | N = 0 |
Table S4. Basic characteristics of clinical feature: 'GENDER'
| GENDER | Labels | N |
| FEMALE | 62 | |
| MALE | 150 | |
| Significant markers | N = 1 | |
| Higher in MALE | 0 | |
| Higher in FEMALE | 1 |
Table S5. Get Full Table List of one gene differentially expressed by 'GENDER'
| T(pos if higher in 'MALE') | ttestP | Q | AUC | |
|---|---|---|---|---|
| MAPK14|P38_PT180_Y182-R-V | -3.86 | 0.0001831 | 0.0319 | 0.6624 |
Figure S2. Get High-res Image As an example, this figure shows the association of MAPK14|P38_PT180_Y182-R-V to 'GENDER'. P value = 0.000183 with T-test analysis.
2 genes related to 'RADIATIONS.RADIATION.REGIMENINDICATION'.
Table S6. Basic characteristics of clinical feature: 'RADIATIONS.RADIATION.REGIMENINDICATION'
| RADIATIONS.RADIATION.REGIMENINDICATION | Labels | N |
| NO | 58 | |
| YES | 154 | |
| Significant markers | N = 2 | |
| Higher in YES | 0 | |
| Higher in NO | 2 |
Table S7. Get Full Table List of 2 genes differentially expressed by 'RADIATIONS.RADIATION.REGIMENINDICATION'
| T(pos if higher in 'YES') | ttestP | Q | AUC | |
|---|---|---|---|---|
| BCL2|BCL-2-R-C | -4.31 | 4.8e-05 | 0.00835 | 0.7071 |
| COL6A1|COLLAGEN_VI-R-V | -3.99 | 0.0001411 | 0.0244 | 0.6773 |
Figure S3. Get High-res Image As an example, this figure shows the association of BCL2|BCL-2-R-C to 'RADIATIONS.RADIATION.REGIMENINDICATION'. P value = 4.8e-05 with T-test analysis.
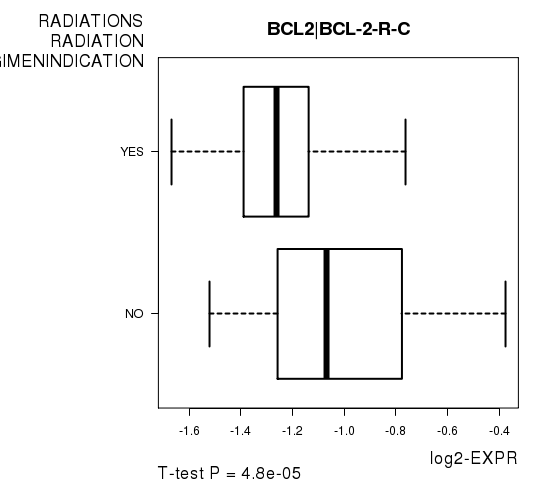
Table S8. Basic characteristics of clinical feature: 'NUMBERPACKYEARSSMOKED'
| NUMBERPACKYEARSSMOKED | Mean (SD) | 48.65 (38) |
| Significant markers | N = 1 | |
| pos. correlated | 1 | |
| neg. correlated | 0 |
Table S9. Get Full Table List of one gene significantly correlated to 'NUMBERPACKYEARSSMOKED' by Spearman correlation test
| SpearmanCorr | corrP | Q | |
|---|---|---|---|
| CHEK2|CHK2-M-C | 0.3495 | 0.0002242 | 0.039 |
Figure S4. Get High-res Image As an example, this figure shows the association of CHEK2|CHK2-M-C to 'NUMBERPACKYEARSSMOKED'. P value = 0.000224 with Spearman correlation analysis. The straight line presents the best linear regression.
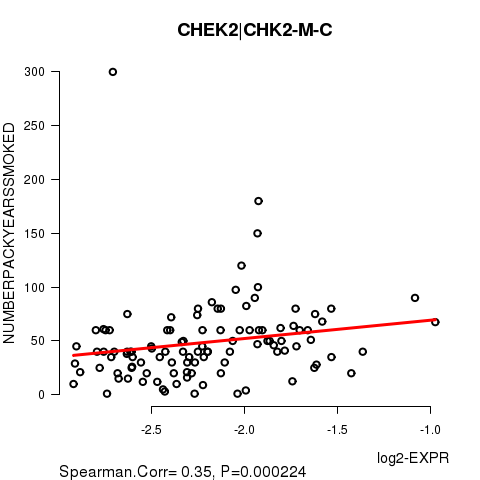
Table S10. Basic characteristics of clinical feature: 'YEAROFTOBACCOSMOKINGONSET'
| YEAROFTOBACCOSMOKINGONSET | Mean (SD) | 1964.27 (12) |
| Significant markers | N = 0 |
Table S11. Basic characteristics of clinical feature: 'LYMPH.NODE.METASTASIS'
| LYMPH.NODE.METASTASIS | Labels | N |
| N0 | 72 | |
| N1 | 21 | |
| N2 | 4 | |
| N2A | 4 | |
| N2B | 45 | |
| N2C | 26 | |
| N3 | 4 | |
| NX | 34 | |
| Significant markers | N = 0 |
Table S12. Basic characteristics of clinical feature: 'NUMBER.OF.LYMPH.NODES'
| NUMBER.OF.LYMPH.NODES | Mean (SD) | 2.86 (5.1) |
| Significant markers | N = 3 | |
| pos. correlated | 0 | |
| neg. correlated | 3 |
Table S13. Get Full Table List of 3 genes significantly correlated to 'NUMBER.OF.LYMPH.NODES' by Spearman correlation test
| SpearmanCorr | corrP | Q | |
|---|---|---|---|
| ANXA1|ANNEXIN_I-R-V | -0.3328 | 9.218e-06 | 0.0016 |
| SRC|SRC_PY416-R-C | -0.2985 | 7.711e-05 | 0.0133 |
| YAP1|YAP_PS127-R-C | -0.2805 | 0.0002115 | 0.0364 |
Figure S5. Get High-res Image As an example, this figure shows the association of ANXA1|ANNEXIN_I-R-V to 'NUMBER.OF.LYMPH.NODES'. P value = 9.22e-06 with Spearman correlation analysis. The straight line presents the best linear regression.
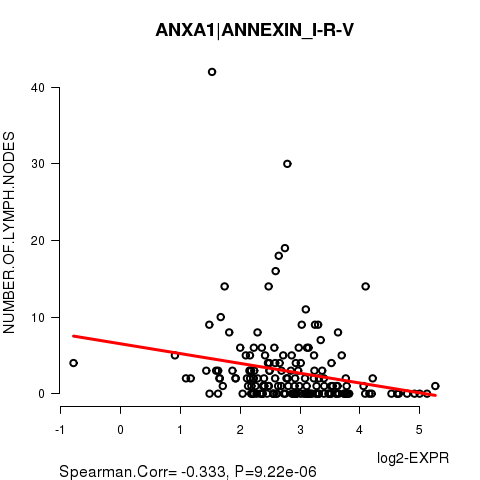
Table S14. Basic characteristics of clinical feature: 'NEOPLASM.DISEASESTAGE'
| NEOPLASM.DISEASESTAGE | Labels | N |
| STAGE I | 9 | |
| STAGE II | 39 | |
| STAGE III | 31 | |
| STAGE IVA | 117 | |
| STAGE IVB | 4 | |
| Significant markers | N = 2 |
Table S15. Get Full Table List of 2 genes differentially expressed by 'NEOPLASM.DISEASESTAGE'
| ANOVA_P | Q | |
|---|---|---|
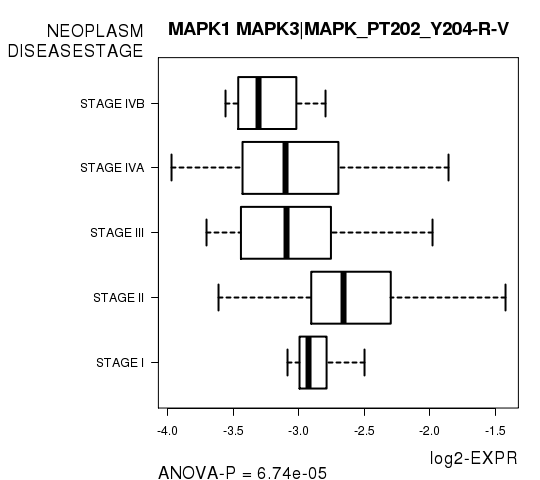
| MAPK1 MAPK3|MAPK_PT202_Y204-R-V | 6.74e-05 | 0.0117 |
| MAP2K1|MEK1_PS217_S221-R-V | 0.0001008 | 0.0174 |
Figure S6. Get High-res Image As an example, this figure shows the association of MAPK1 MAPK3|MAPK_PT202_Y204-R-V to 'NEOPLASM.DISEASESTAGE'. P value = 6.74e-05 with ANOVA analysis.
-
Expresson data file = HNSC-TP.rppa.txt
-
Clinical data file = HNSC-TP.clin.merged.picked.txt
-
Number of patients = 212
-
Number of genes = 174
-
Number of clinical features = 9
For survival clinical features, Wald's test in univariate Cox regression analysis with proportional hazards model (Andersen and Gill 1982) was used to estimate the P values using the 'coxph' function in R. Kaplan-Meier survival curves were plot using the four quartile subgroups of patients based on expression levels
For continuous numerical clinical features, Spearman's rank correlation coefficients (Spearman 1904) and two-tailed P values were estimated using 'cor.test' function in R
For two-class clinical features, two-tailed Student's t test with unequal variance (Lehmann and Romano 2005) was applied to compare the log2-expression levels between the two clinical classes using 't.test' function in R
For multi-class clinical features (ordinal or nominal), one-way analysis of variance (Howell 2002) was applied to compare the log2-expression levels between different clinical classes using 'anova' function in R
For multiple hypothesis correction, Q value is the False Discovery Rate (FDR) analogue of the P value (Benjamini and Hochberg 1995), defined as the minimum FDR at which the test may be called significant. We used the 'Benjamini and Hochberg' method of 'p.adjust' function in R to convert P values into Q values.
This is an experimental feature. The full results of the analysis summarized in this report can be downloaded from the TCGA Data Coordination Center.