This pipeline uses various statistical tests to identify mRNAs whose expression levels correlated to selected clinical features.
Testing the association between 18388 genes and 9 clinical features across 302 samples, statistically thresholded by Q value < 0.05, 6 clinical features related to at least one genes.
-
11 genes correlated to 'Time to Death'.
-
CYB5B|80777 , FGD3|89846 , TOMM34|10953 , LOC728989|728989 , FRMD5|84978 , ...
-
36 genes correlated to 'GENDER'.
-
XIST|7503 , ZFY|7544 , PRKY|5616 , RPS4Y1|6192 , DDX3Y|8653 , ...
-
6 genes correlated to 'NUMBERPACKYEARSSMOKED'.
-
GLI2|2736 , TMTC3|160418 , B4GALNT3|283358 , DPH3|285381 , MCOLN1|57192 , ...
-
2 genes correlated to 'LYMPH.NODE.METASTASIS'.
-
EPS8L2|64787 , TRIM16|10626
-
67 genes correlated to 'NUMBER.OF.LYMPH.NODES'.
-
ARL4C|10123 , TGM1|7051 , SPOCK1|6695 , MPZL2|10205 , GDPD3|79153 , ...
-
1 gene correlated to 'NEOPLASM.DISEASESTAGE'.
-
FRS2|10818
-
No genes correlated to 'AGE', 'RADIATIONS.RADIATION.REGIMENINDICATION', and 'YEAROFTOBACCOSMOKINGONSET'.
Complete statistical result table is provided in Supplement Table 1
Table 1. Get Full Table This table shows the clinical features, statistical methods used, and the number of genes that are significantly associated with each clinical feature at Q value < 0.05.
| Clinical feature | Statistical test | Significant genes | Associated with | Associated with | ||
|---|---|---|---|---|---|---|
| Time to Death | Cox regression test | N=11 | shorter survival | N=4 | longer survival | N=7 |
| AGE | Spearman correlation test | N=0 | ||||
| GENDER | t test | N=36 | male | N=14 | female | N=22 |
| RADIATIONS RADIATION REGIMENINDICATION | t test | N=0 | ||||
| NUMBERPACKYEARSSMOKED | Spearman correlation test | N=6 | higher numberpackyearssmoked | N=4 | lower numberpackyearssmoked | N=2 |
| YEAROFTOBACCOSMOKINGONSET | Spearman correlation test | N=0 | ||||
| LYMPH NODE METASTASIS | ANOVA test | N=2 | ||||
| NUMBER OF LYMPH NODES | Spearman correlation test | N=67 | higher number.of.lymph.nodes | N=22 | lower number.of.lymph.nodes | N=45 |
| NEOPLASM DISEASESTAGE | ANOVA test | N=1 |
Table S1. Basic characteristics of clinical feature: 'Time to Death'
| Time to Death | Duration (Months) | 0.1-210.9 (median=14.8) |
| censored | N = 179 | |
| death | N = 120 | |
| Significant markers | N = 11 | |
| associated with shorter survival | 4 | |
| associated with longer survival | 7 |
Table S2. Get Full Table List of top 10 genes significantly associated with 'Time to Death' by Cox regression test
| HazardRatio | Wald_P | Q | C_index | |
|---|---|---|---|---|
| CYB5B|80777 | 2.5 | 2.522e-08 | 0.00046 | 0.63 |
| FGD3|89846 | 0.63 | 7.202e-08 | 0.0013 | 0.335 |
| TOMM34|10953 | 2.3 | 1.373e-07 | 0.0025 | 0.647 |
| LOC728989|728989 | 0.64 | 3.751e-07 | 0.0069 | 0.331 |
| FRMD5|84978 | 1.27 | 7.547e-07 | 0.014 | 0.658 |
| TP53INP1|94241 | 0.64 | 7.624e-07 | 0.014 | 0.357 |
| ZNF266|10781 | 0.45 | 1.227e-06 | 0.023 | 0.362 |
| SLC35E2|728661 | 0.57 | 1.769e-06 | 0.033 | 0.381 |
| SLC25A45|283130 | 0.59 | 1.933e-06 | 0.036 | 0.362 |
| POLR2C|5432 | 2.6 | 2.355e-06 | 0.043 | 0.613 |
Figure S1. Get High-res Image As an example, this figure shows the association of CYB5B|80777 to 'Time to Death'. four curves present the cumulative survival rates of 4 quartile subsets of patients. P value = 2.52e-08 with univariate Cox regression analysis using continuous log-2 expression values.
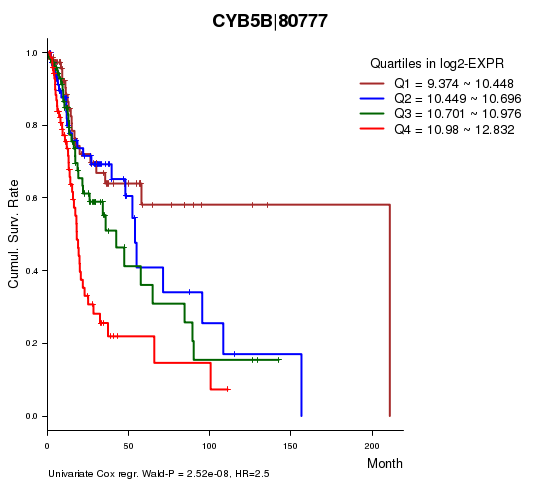
Table S3. Basic characteristics of clinical feature: 'AGE'
| AGE | Mean (SD) | 61.05 (12) |
| Significant markers | N = 0 |
Table S4. Basic characteristics of clinical feature: 'GENDER'
| GENDER | Labels | N |
| FEMALE | 81 | |
| MALE | 221 | |
| Significant markers | N = 36 | |
| Higher in MALE | 14 | |
| Higher in FEMALE | 22 |
Table S5. Get Full Table List of top 10 genes differentially expressed by 'GENDER'
| T(pos if higher in 'MALE') | ttestP | Q | AUC | |
|---|---|---|---|---|
| XIST|7503 | -46.26 | 2.87e-115 | 5.28e-111 | 0.9985 |
| ZFY|7544 | 42.16 | 4.214e-96 | 7.75e-92 | 0.9957 |
| PRKY|5616 | 28.23 | 2.038e-64 | 3.75e-60 | 0.9946 |
| RPS4Y1|6192 | 36.84 | 1.284e-57 | 2.36e-53 | 0.9997 |
| DDX3Y|8653 | 36.45 | 1.494e-50 | 2.75e-46 | 0.9958 |
| USP9Y|8287 | 32.22 | 2.389e-43 | 4.39e-39 | 0.9982 |
| TSIX|9383 | -18.22 | 3.823e-39 | 7.03e-35 | 0.9761 |
| UTY|7404 | 28.95 | 5.546e-36 | 1.02e-31 | 0.9933 |
| KDM5D|8284 | 30.36 | 1.94e-35 | 3.56e-31 | 0.997 |
| NLGN4Y|22829 | 21.67 | 1.267e-27 | 2.33e-23 | 0.9887 |
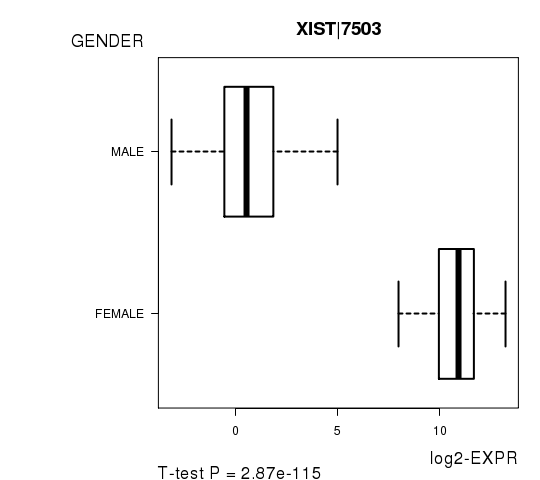
Figure S2. Get High-res Image As an example, this figure shows the association of XIST|7503 to 'GENDER'. P value = 2.87e-115 with T-test analysis.
No gene related to 'RADIATIONS.RADIATION.REGIMENINDICATION'.
Table S6. Basic characteristics of clinical feature: 'RADIATIONS.RADIATION.REGIMENINDICATION'
| RADIATIONS.RADIATION.REGIMENINDICATION | Labels | N |
| NO | 78 | |
| YES | 224 | |
| Significant markers | N = 0 |
Table S7. Basic characteristics of clinical feature: 'NUMBERPACKYEARSSMOKED'
| NUMBERPACKYEARSSMOKED | Mean (SD) | 49.8 (37) |
| Significant markers | N = 6 | |
| pos. correlated | 4 | |
| neg. correlated | 2 |
Table S8. Get Full Table List of 6 genes significantly correlated to 'NUMBERPACKYEARSSMOKED' by Spearman correlation test
| SpearmanCorr | corrP | Q | |
|---|---|---|---|
| GLI2|2736 | 0.3738 | 6.517e-07 | 0.012 |
| TMTC3|160418 | 0.3711 | 7.902e-07 | 0.0145 |
| B4GALNT3|283358 | 0.3606 | 1.692e-06 | 0.0311 |
| DPH3|285381 | -0.3602 | 1.748e-06 | 0.0321 |
| MCOLN1|57192 | -0.3574 | 2.116e-06 | 0.0389 |
| KCNQ5|56479 | 0.3557 | 2.388e-06 | 0.0439 |
Figure S3. Get High-res Image As an example, this figure shows the association of GLI2|2736 to 'NUMBERPACKYEARSSMOKED'. P value = 6.52e-07 with Spearman correlation analysis. The straight line presents the best linear regression.
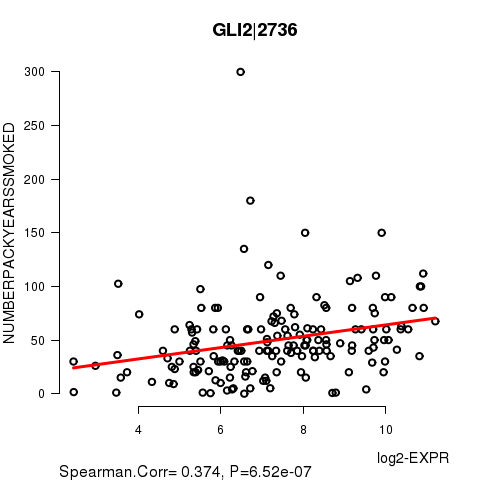
Table S9. Basic characteristics of clinical feature: 'YEAROFTOBACCOSMOKINGONSET'
| YEAROFTOBACCOSMOKINGONSET | Mean (SD) | 1964.56 (12) |
| Significant markers | N = 0 |
Table S10. Basic characteristics of clinical feature: 'LYMPH.NODE.METASTASIS'
| LYMPH.NODE.METASTASIS | Labels | N |
| N0 | 99 | |
| N1 | 33 | |
| N2 | 6 | |
| N2A | 4 | |
| N2B | 55 | |
| N2C | 32 | |
| N3 | 5 | |
| NX | 60 | |
| Significant markers | N = 2 |
Table S11. Get Full Table List of 2 genes differentially expressed by 'LYMPH.NODE.METASTASIS'
| ANOVA_P | Q | |
|---|---|---|
| EPS8L2|64787 | 1.729e-06 | 0.0318 |
| TRIM16|10626 | 1.994e-06 | 0.0367 |
Figure S4. Get High-res Image As an example, this figure shows the association of EPS8L2|64787 to 'LYMPH.NODE.METASTASIS'. P value = 1.73e-06 with ANOVA analysis.
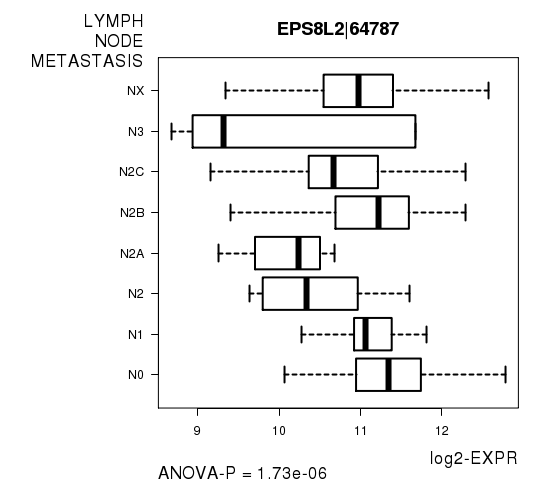
Table S12. Basic characteristics of clinical feature: 'NUMBER.OF.LYMPH.NODES'
| NUMBER.OF.LYMPH.NODES | Mean (SD) | 2.68 (5.3) |
| Significant markers | N = 67 | |
| pos. correlated | 22 | |
| neg. correlated | 45 |
Table S13. Get Full Table List of top 10 genes significantly correlated to 'NUMBER.OF.LYMPH.NODES' by Spearman correlation test
| SpearmanCorr | corrP | Q | |
|---|---|---|---|
| ARL4C|10123 | 0.3894 | 1.129e-09 | 2.08e-05 |
| TGM1|7051 | -0.377 | 4.13e-09 | 7.59e-05 |
| SPOCK1|6695 | 0.3751 | 4.982e-09 | 9.16e-05 |
| MPZL2|10205 | -0.3628 | 1.691e-08 | 0.000311 |
| GDPD3|79153 | -0.3526 | 4.445e-08 | 0.000817 |
| PCGF2|7703 | 0.3509 | 5.229e-08 | 0.000961 |
| ABLIM1|3983 | -0.3502 | 5.59e-08 | 0.00103 |
| SPRR2F|6705 | -0.3492 | 7.509e-08 | 0.00138 |
| C1ORF216|127703 | 0.3464 | 7.901e-08 | 0.00145 |
| SLC13A4|26266 | -0.3466 | 8.279e-08 | 0.00152 |
Figure S5. Get High-res Image As an example, this figure shows the association of ARL4C|10123 to 'NUMBER.OF.LYMPH.NODES'. P value = 1.13e-09 with Spearman correlation analysis. The straight line presents the best linear regression.
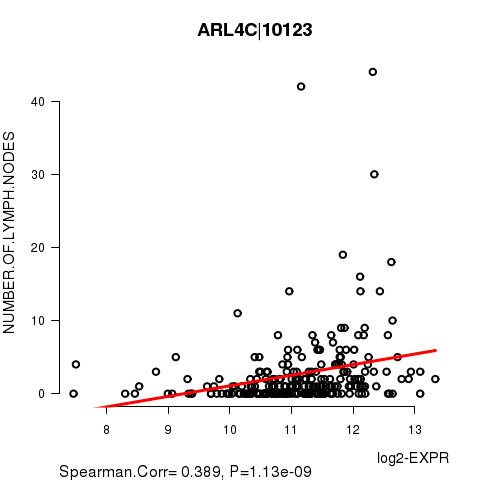
Table S14. Basic characteristics of clinical feature: 'NEOPLASM.DISEASESTAGE'
| NEOPLASM.DISEASESTAGE | Labels | N |
| STAGE I | 16 | |
| STAGE II | 47 | |
| STAGE III | 41 | |
| STAGE IVA | 147 | |
| STAGE IVB | 6 | |
| Significant markers | N = 1 |
Table S15. Get Full Table List of one gene differentially expressed by 'NEOPLASM.DISEASESTAGE'
| ANOVA_P | Q | |
|---|---|---|
| FRS2|10818 | 8.906e-08 | 0.00164 |
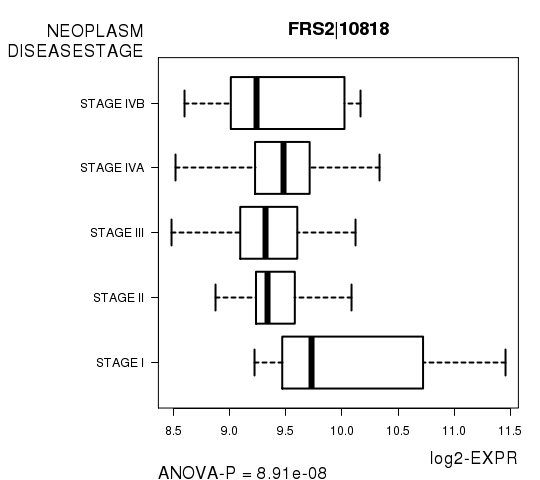
Figure S6. Get High-res Image As an example, this figure shows the association of FRS2|10818 to 'NEOPLASM.DISEASESTAGE'. P value = 8.91e-08 with ANOVA analysis.
-
Expresson data file = HNSC-TP.uncv2.mRNAseq_RSEM_normalized_log2.txt
-
Clinical data file = HNSC-TP.clin.merged.picked.txt
-
Number of patients = 302
-
Number of genes = 18388
-
Number of clinical features = 9
For survival clinical features, Wald's test in univariate Cox regression analysis with proportional hazards model (Andersen and Gill 1982) was used to estimate the P values using the 'coxph' function in R. Kaplan-Meier survival curves were plot using the four quartile subgroups of patients based on expression levels
For continuous numerical clinical features, Spearman's rank correlation coefficients (Spearman 1904) and two-tailed P values were estimated using 'cor.test' function in R
For two-class clinical features, two-tailed Student's t test with unequal variance (Lehmann and Romano 2005) was applied to compare the log2-expression levels between the two clinical classes using 't.test' function in R
For multi-class clinical features (ordinal or nominal), one-way analysis of variance (Howell 2002) was applied to compare the log2-expression levels between different clinical classes using 'anova' function in R
For multiple hypothesis correction, Q value is the False Discovery Rate (FDR) analogue of the P value (Benjamini and Hochberg 1995), defined as the minimum FDR at which the test may be called significant. We used the 'Benjamini and Hochberg' method of 'p.adjust' function in R to convert P values into Q values.
This is an experimental feature. The full results of the analysis summarized in this report can be downloaded from the TCGA Data Coordination Center.