This pipeline uses various statistical tests to identify genes whose promoter methylation levels correlated to selected clinical features.
Testing the association between 19761 genes and 4 clinical features across 22 samples, statistically thresholded by Q value < 0.05, 2 clinical features related to at least one genes.
-
768 genes correlated to 'LYMPH.NODE.METASTASIS'.
-
FADS1 , MIR1908 , ZNF167 , AIFM2 , SNX32 , ...
-
24 genes correlated to 'NEOPLASM.DISEASESTAGE'.
-
HS3ST2 , FAM135B , SOX21 , SPTBN4 , ODZ3 , ...
-
No genes correlated to 'AGE', and 'GENDER'.
Complete statistical result table is provided in Supplement Table 1
Table 1. Get Full Table This table shows the clinical features, statistical methods used, and the number of genes that are significantly associated with each clinical feature at Q value < 0.05.
| Clinical feature | Statistical test | Significant genes | Associated with | Associated with | ||
|---|---|---|---|---|---|---|
| AGE | Spearman correlation test | N=0 | ||||
| GENDER | t test | N=0 | ||||
| LYMPH NODE METASTASIS | ANOVA test | N=768 | ||||
| NEOPLASM DISEASESTAGE | ANOVA test | N=24 |
Table S1. Basic characteristics of clinical feature: 'AGE'
| AGE | Mean (SD) | 51.64 (15) |
| Significant markers | N = 0 |
Table S2. Basic characteristics of clinical feature: 'GENDER'
| GENDER | Labels | N |
| FEMALE | 10 | |
| MALE | 12 | |
| Significant markers | N = 0 |
Table S3. Basic characteristics of clinical feature: 'LYMPH.NODE.METASTASIS'
| LYMPH.NODE.METASTASIS | Labels | N |
| N0 | 11 | |
| N1 | 1 | |
| NX | 10 | |
| Significant markers | N = 768 |
Table S4. Get Full Table List of top 10 genes differentially expressed by 'LYMPH.NODE.METASTASIS'
| ANOVA_P | Q | |
|---|---|---|
| FADS1 | 1.168e-40 | 2.31e-36 |
| MIR1908 | 1.168e-40 | 2.31e-36 |
| ZNF167 | 1.509e-37 | 2.98e-33 |
| AIFM2 | 1.537e-35 | 3.04e-31 |
| SNX32 | 4.807e-35 | 9.5e-31 |
| XKR6 | 6.997e-35 | 1.38e-30 |
| C4ORF19 | 9.398e-33 | 1.86e-28 |
| C3ORF75 | 6.289e-31 | 1.24e-26 |
| DLGAP3 | 8.335e-31 | 1.65e-26 |
| TTC23L | 1.321e-30 | 2.61e-26 |
Figure S1. Get High-res Image As an example, this figure shows the association of FADS1 to 'LYMPH.NODE.METASTASIS'. P value = 1.17e-40 with ANOVA analysis.
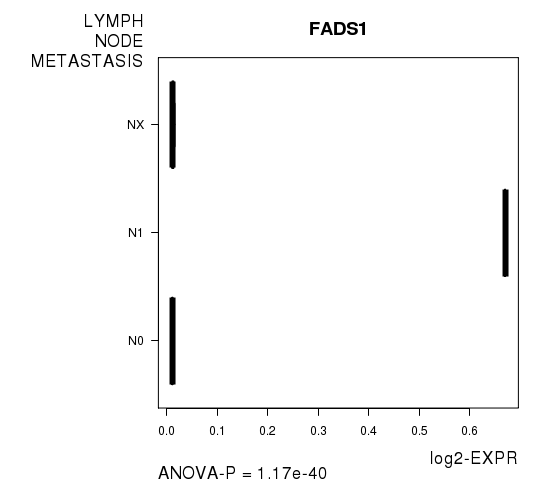
Table S5. Basic characteristics of clinical feature: 'NEOPLASM.DISEASESTAGE'
| NEOPLASM.DISEASESTAGE | Labels | N |
| STAGE I | 8 | |
| STAGE II | 10 | |
| STAGE III | 2 | |
| STAGE IV | 2 | |
| Significant markers | N = 24 |
Table S6. Get Full Table List of top 10 genes differentially expressed by 'NEOPLASM.DISEASESTAGE'
| ANOVA_P | Q | |
|---|---|---|
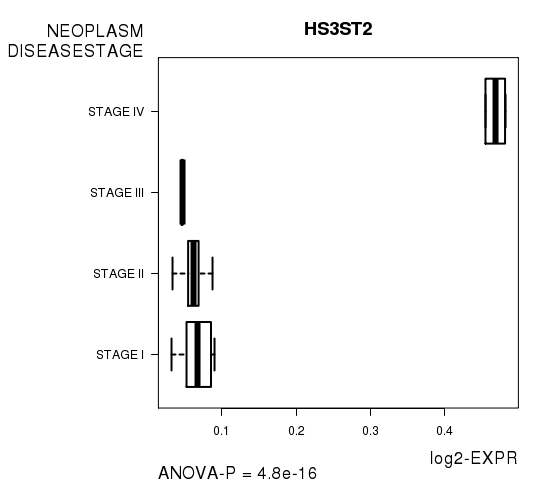
| HS3ST2 | 4.797e-16 | 9.48e-12 |
| FAM135B | 5.538e-13 | 1.09e-08 |
| SOX21 | 5.114e-12 | 1.01e-07 |
| SPTBN4 | 5.706e-12 | 1.13e-07 |
| ODZ3 | 7.982e-12 | 1.58e-07 |
| FLJ44606 | 6.038e-11 | 1.19e-06 |
| IGFBP3 | 6.8e-11 | 1.34e-06 |
| SHE | 3.694e-10 | 7.3e-06 |
| TDRD10 | 3.694e-10 | 7.3e-06 |
| SEMA3E | 6.015e-10 | 1.19e-05 |
Figure S2. Get High-res Image As an example, this figure shows the association of HS3ST2 to 'NEOPLASM.DISEASESTAGE'. P value = 4.8e-16 with ANOVA analysis.
-
Expresson data file = KICH-TP.meth.by_min_expr_corr.data.txt
-
Clinical data file = KICH-TP.clin.merged.picked.txt
-
Number of patients = 22
-
Number of genes = 19761
-
Number of clinical features = 4
For continuous numerical clinical features, Spearman's rank correlation coefficients (Spearman 1904) and two-tailed P values were estimated using 'cor.test' function in R
For two-class clinical features, two-tailed Student's t test with unequal variance (Lehmann and Romano 2005) was applied to compare the log2-expression levels between the two clinical classes using 't.test' function in R
For multi-class clinical features (ordinal or nominal), one-way analysis of variance (Howell 2002) was applied to compare the log2-expression levels between different clinical classes using 'anova' function in R
For multiple hypothesis correction, Q value is the False Discovery Rate (FDR) analogue of the P value (Benjamini and Hochberg 1995), defined as the minimum FDR at which the test may be called significant. We used the 'Benjamini and Hochberg' method of 'p.adjust' function in R to convert P values into Q values.
This is an experimental feature. The full results of the analysis summarized in this report can be downloaded from the TCGA Data Coordination Center.