This pipeline uses various statistical tests to identify miRs whose expression levels correlated to selected clinical features.
Testing the association between 469 genes and 5 clinical features across 25 samples, statistically thresholded by Q value < 0.05, 1 clinical feature related to at least one genes.
-
1 gene correlated to 'LYMPH.NODE.METASTASIS'.
-
HSA-MIR-1537
-
No genes correlated to 'AGE', 'GENDER', 'DISTANT.METASTASIS', and 'NEOPLASM.DISEASESTAGE'.
Complete statistical result table is provided in Supplement Table 1
Table 1. Get Full Table This table shows the clinical features, statistical methods used, and the number of genes that are significantly associated with each clinical feature at Q value < 0.05.
| Clinical feature | Statistical test | Significant genes | Associated with | Associated with | ||
|---|---|---|---|---|---|---|
| AGE | Spearman correlation test | N=0 | ||||
| GENDER | t test | N=0 | ||||
| DISTANT METASTASIS | ANOVA test | N=0 | ||||
| LYMPH NODE METASTASIS | ANOVA test | N=1 | ||||
| NEOPLASM DISEASESTAGE | ANOVA test | N=0 |
Table S1. Basic characteristics of clinical feature: 'AGE'
| AGE | Mean (SD) | 52.32 (15) |
| Significant markers | N = 0 |
Table S2. Basic characteristics of clinical feature: 'GENDER'
| GENDER | Labels | N |
| FEMALE | 11 | |
| MALE | 14 | |
| Significant markers | N = 0 |
Table S3. Basic characteristics of clinical feature: 'DISTANT.METASTASIS'
| DISTANT.METASTASIS | Labels | N |
| M0 | 2 | |
| M1 | 2 | |
| MX | 3 | |
| Significant markers | N = 0 |
Table S4. Basic characteristics of clinical feature: 'LYMPH.NODE.METASTASIS'
| LYMPH.NODE.METASTASIS | Labels | N |
| N0 | 13 | |
| N1 | 2 | |
| NX | 10 | |
| Significant markers | N = 1 |
Table S5. Get Full Table List of one gene differentially expressed by 'LYMPH.NODE.METASTASIS'
| ANOVA_P | Q | |
|---|---|---|
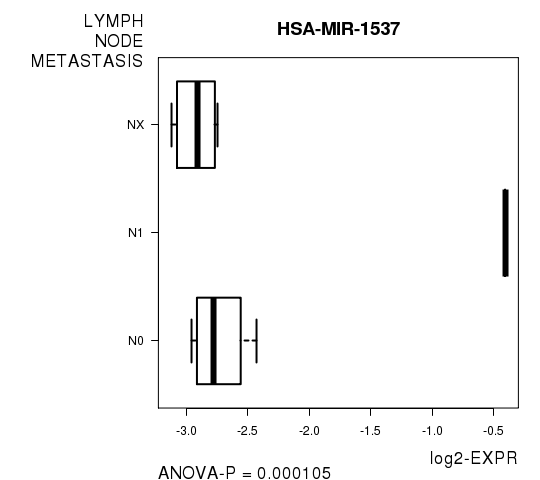
| HSA-MIR-1537 | 0.0001046 | 0.049 |
Figure S1. Get High-res Image As an example, this figure shows the association of HSA-MIR-1537 to 'LYMPH.NODE.METASTASIS'. P value = 0.000105 with ANOVA analysis.
-
Expresson data file = KICH-TP.miRseq_RPKM_log2.txt
-
Clinical data file = KICH-TP.clin.merged.picked.txt
-
Number of patients = 25
-
Number of genes = 469
-
Number of clinical features = 5
For continuous numerical clinical features, Spearman's rank correlation coefficients (Spearman 1904) and two-tailed P values were estimated using 'cor.test' function in R
For two-class clinical features, two-tailed Student's t test with unequal variance (Lehmann and Romano 2005) was applied to compare the log2-expression levels between the two clinical classes using 't.test' function in R
For multi-class clinical features (ordinal or nominal), one-way analysis of variance (Howell 2002) was applied to compare the log2-expression levels between different clinical classes using 'anova' function in R
For multiple hypothesis correction, Q value is the False Discovery Rate (FDR) analogue of the P value (Benjamini and Hochberg 1995), defined as the minimum FDR at which the test may be called significant. We used the 'Benjamini and Hochberg' method of 'p.adjust' function in R to convert P values into Q values.
This is an experimental feature. The full results of the analysis summarized in this report can be downloaded from the TCGA Data Coordination Center.