This pipeline computes the correlation between significant arm-level copy number variations (cnvs) and selected clinical features.
Testing the association between copy number variation 71 arm-level results and 8 clinical features across 493 patients, 4 significant findings detected with Q value < 0.25.
-
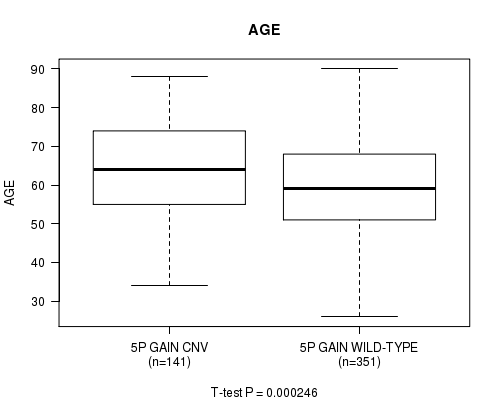
5p gain cnv correlated to 'AGE'.
-
5q gain cnv correlated to 'AGE'.
-
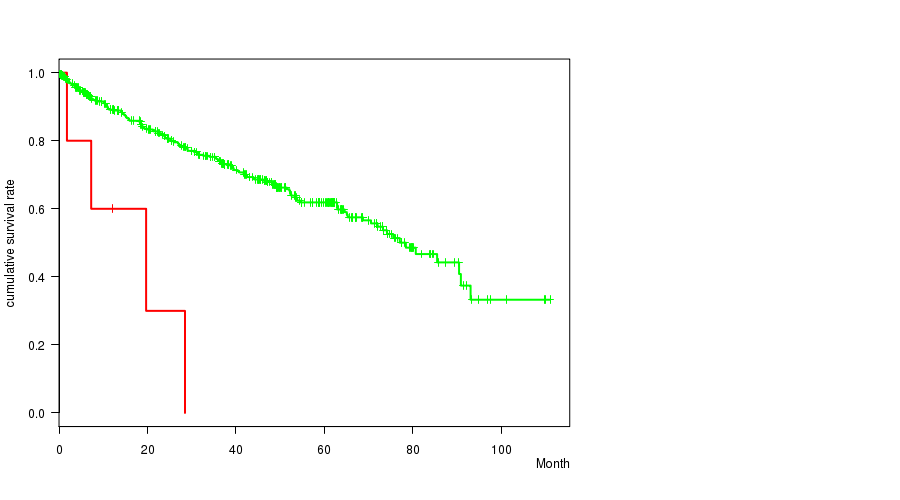
11p loss cnv correlated to 'Time to Death'.
-
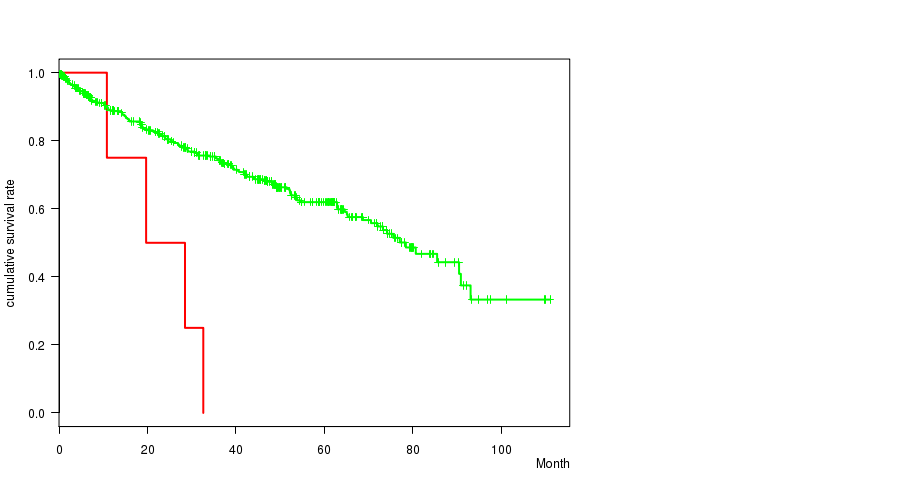
19p loss cnv correlated to 'Time to Death'.
Table 1. Get Full Table Overview of the association between significant copy number variation of 71 arm-level results and 8 clinical features. Shown in the table are P values (Q values). Thresholded by Q value < 0.25, 4 significant findings detected.
|
Clinical Features |
Time to Death |
AGE | GENDER |
KARNOFSKY PERFORMANCE SCORE |
DISTANT METASTASIS |
LYMPH NODE METASTASIS |
TUMOR STAGECODE |
NEOPLASM DISEASESTAGE |
||
| nCNV (%) | nWild-Type | logrank test | t-test | Fisher's exact test | t-test | Fisher's exact test | Fisher's exact test | t-test | Fisher's exact test | |
| 5p gain | 0 (0%) | 352 |
0.124 (1.00) |
0.000246 (0.114) |
0.116 (1.00) |
0.563 (1.00) |
0.783 (1.00) |
0.383 (1.00) |
0.246 (1.00) |
|
| 5q gain | 0 (0%) | 337 |
0.297 (1.00) |
0.00037 (0.171) |
0.156 (1.00) |
0.482 (1.00) |
0.594 (1.00) |
0.302 (1.00) |
0.368 (1.00) |
|
| 11p loss | 0 (0%) | 488 |
3.9e-05 (0.0182) |
0.943 (1.00) |
0.663 (1.00) |
0.569 (1.00) |
0.162 (1.00) |
0.838 (1.00) |
||
| 19p loss | 0 (0%) | 489 |
0.000514 (0.238) |
0.89 (1.00) |
0.612 (1.00) |
1 (1.00) |
1 (1.00) |
0.0681 (1.00) |
||
| 1p gain | 0 (0%) | 488 |
0.498 (1.00) |
0.942 (1.00) |
1 (1.00) |
1 (1.00) |
0.162 (1.00) |
0.148 (1.00) |
||
| 1q gain | 0 (0%) | 461 |
0.96 (1.00) |
0.185 (1.00) |
0.565 (1.00) |
0.115 (1.00) |
0.803 (1.00) |
0.598 (1.00) |
0.0358 (1.00) |
|
| 2p gain | 0 (0%) | 445 |
0.58 (1.00) |
0.14 (1.00) |
0.201 (1.00) |
0.563 (1.00) |
0.206 (1.00) |
0.64 (1.00) |
0.209 (1.00) |
|
| 2q gain | 0 (0%) | 444 |
0.411 (1.00) |
0.205 (1.00) |
0.0387 (1.00) |
0.159 (1.00) |
0.208 (1.00) |
0.76 (1.00) |
0.274 (1.00) |
|
| 3p gain | 0 (0%) | 486 |
0.95 (1.00) |
0.429 (1.00) |
0.243 (1.00) |
0.295 (1.00) |
0.326 (1.00) |
0.12 (1.00) |
||
| 3q gain | 0 (0%) | 465 |
0.372 (1.00) |
0.941 (1.00) |
1 (1.00) |
0.0261 (1.00) |
0.174 (1.00) |
0.164 (1.00) |
0.256 (1.00) |
|
| 4p gain | 0 (0%) | 485 |
0.235 (1.00) |
0.875 (1.00) |
0.72 (1.00) |
0.616 (1.00) |
0.144 (1.00) |
0.107 (1.00) |
||
| 4q gain | 0 (0%) | 485 |
0.653 (1.00) |
0.389 (1.00) |
1 (1.00) |
0.616 (1.00) |
0.144 (1.00) |
0.28 (1.00) |
||
| 6p gain | 0 (0%) | 487 |
0.224 (1.00) |
0.236 (1.00) |
1 (1.00) |
1 (1.00) |
0.547 (1.00) |
0.709 (1.00) |
||
| 6q gain | 0 (0%) | 488 |
0.183 (1.00) |
0.442 (1.00) |
0.663 (1.00) |
0.569 (1.00) |
0.336 (1.00) |
0.367 (1.00) |
||
| 7p gain | 0 (0%) | 366 |
0.862 (1.00) |
0.314 (1.00) |
0.0522 (1.00) |
0.893 (1.00) |
0.0451 (1.00) |
0.165 (1.00) |
0.192 (1.00) |
|
| 7q gain | 0 (0%) | 364 |
0.517 (1.00) |
0.38 (1.00) |
0.0673 (1.00) |
0.699 (1.00) |
0.00661 (1.00) |
0.503 (1.00) |
0.0464 (1.00) |
|
| 8p gain | 0 (0%) | 479 |
0.574 (1.00) |
0.761 (1.00) |
0.0417 (1.00) |
0.757 (1.00) |
0.462 (1.00) |
0.759 (1.00) |
0.00133 (0.614) |
|
| 8q gain | 0 (0%) | 459 |
0.856 (1.00) |
0.427 (1.00) |
0.192 (1.00) |
0.471 (1.00) |
1 (1.00) |
0.248 (1.00) |
0.00273 (1.00) |
|
| 9p gain | 0 (0%) | 485 |
0.123 (1.00) |
0.0377 (1.00) |
0.0232 (1.00) |
0.616 (1.00) |
1 (1.00) |
0.41 (1.00) |
||
| 9q gain | 0 (0%) | 485 |
0.769 (1.00) |
0.97 (1.00) |
0.457 (1.00) |
0.356 (1.00) |
1 (1.00) |
0.0841 (1.00) |
||
| 10p gain | 0 (0%) | 487 |
0.72 (1.00) |
0.511 (1.00) |
0.422 (1.00) |
0.233 (1.00) |
1 (1.00) |
0.269 (1.00) |
||
| 10q gain | 0 (0%) | 489 |
0.511 (1.00) |
0.169 (1.00) |
0.123 (1.00) |
0.489 (1.00) |
0.677 (1.00) |
0.328 (1.00) |
||
| 11p gain | 0 (0%) | 476 |
0.974 (1.00) |
0.8 (1.00) |
0.608 (1.00) |
0.115 (1.00) |
0.16 (1.00) |
0.271 (1.00) |
0.0189 (1.00) |
|
| 11q gain | 0 (0%) | 478 |
0.317 (1.00) |
0.811 (1.00) |
0.409 (1.00) |
0.713 (1.00) |
0.467 (1.00) |
0.0475 (1.00) |
||
| 12p gain | 0 (0%) | 415 |
0.111 (1.00) |
0.115 (1.00) |
0.364 (1.00) |
0.404 (1.00) |
0.122 (1.00) |
0.288 (1.00) |
0.0369 (1.00) |
|
| 12q gain | 0 (0%) | 414 |
0.146 (1.00) |
0.179 (1.00) |
0.302 (1.00) |
0.404 (1.00) |
0.125 (1.00) |
0.362 (1.00) |
0.0282 (1.00) |
|
| 13q gain | 0 (0%) | 479 |
0.291 (1.00) |
0.851 (1.00) |
0.779 (1.00) |
1 (1.00) |
0.134 (1.00) |
0.262 (1.00) |
||
| 14q gain | 0 (0%) | 488 |
0.438 (1.00) |
0.524 (1.00) |
1 (1.00) |
0.569 (1.00) |
0.0522 (1.00) |
0.131 (1.00) |
||
| 15q gain | 0 (0%) | 479 |
0.868 (1.00) |
0.939 (1.00) |
0.779 (1.00) |
0.462 (1.00) |
0.505 (1.00) |
0.431 (1.00) |
||
| 16p gain | 0 (0%) | 428 |
0.611 (1.00) |
0.0654 (1.00) |
0.212 (1.00) |
0.4 (1.00) |
0.713 (1.00) |
0.103 (1.00) |
0.774 (1.00) |
|
| 16q gain | 0 (0%) | 435 |
0.487 (1.00) |
0.0864 (1.00) |
0.106 (1.00) |
0.191 (1.00) |
1 (1.00) |
0.0982 (1.00) |
0.796 (1.00) |
|
| 17p gain | 0 (0%) | 477 |
0.456 (1.00) |
0.533 (1.00) |
0.795 (1.00) |
0.149 (1.00) |
0.553 (1.00) |
0.0825 (1.00) |
||
| 17q gain | 0 (0%) | 471 |
0.143 (1.00) |
0.539 (1.00) |
0.647 (1.00) |
0.161 (1.00) |
0.553 (1.00) |
0.726 (1.00) |
0.483 (1.00) |
|
| 18p gain | 0 (0%) | 475 |
0.0884 (1.00) |
0.782 (1.00) |
0.0223 (1.00) |
0.333 (1.00) |
0.472 (1.00) |
0.709 (1.00) |
||
| 18q gain | 0 (0%) | 475 |
0.0884 (1.00) |
0.782 (1.00) |
0.0223 (1.00) |
0.333 (1.00) |
0.472 (1.00) |
0.709 (1.00) |
||
| 19p gain | 0 (0%) | 468 |
0.935 (1.00) |
0.703 (1.00) |
1 (1.00) |
0.161 (1.00) |
0.251 (1.00) |
0.24 (1.00) |
0.432 (1.00) |
|
| 19q gain | 0 (0%) | 465 |
0.884 (1.00) |
0.709 (1.00) |
0.683 (1.00) |
0.161 (1.00) |
0.174 (1.00) |
0.242 (1.00) |
0.4 (1.00) |
|
| 20p gain | 0 (0%) | 427 |
0.274 (1.00) |
0.268 (1.00) |
0.0127 (1.00) |
0.315 (1.00) |
0.0429 (1.00) |
0.428 (1.00) |
0.0101 (1.00) |
|
| 20q gain | 0 (0%) | 425 |
0.428 (1.00) |
0.22 (1.00) |
0.0195 (1.00) |
0.315 (1.00) |
0.106 (1.00) |
0.555 (1.00) |
0.0166 (1.00) |
|
| 21q gain | 0 (0%) | 460 |
0.339 (1.00) |
0.324 (1.00) |
0.851 (1.00) |
0.161 (1.00) |
1 (1.00) |
0.72 (1.00) |
0.844 (1.00) |
|
| 22q gain | 0 (0%) | 468 |
0.964 (1.00) |
0.83 (1.00) |
0.526 (1.00) |
0.251 (1.00) |
0.813 (1.00) |
0.432 (1.00) |
||
| Xq gain | 0 (0%) | 484 |
0.06 (1.00) |
0.791 (1.00) |
0.0705 (1.00) |
0.0357 (1.00) |
1 (1.00) |
0.0184 (1.00) |
||
| 1p loss | 0 (0%) | 461 |
0.877 (1.00) |
0.0984 (1.00) |
0.565 (1.00) |
0.115 (1.00) |
0.45 (1.00) |
0.501 (1.00) |
0.0661 (1.00) |
|
| 1q loss | 0 (0%) | 473 |
0.504 (1.00) |
0.775 (1.00) |
0.474 (1.00) |
0.753 (1.00) |
0.917 (1.00) |
0.364 (1.00) |
||
| 2p loss | 0 (0%) | 483 |
0.471 (1.00) |
0.932 (1.00) |
0.506 (1.00) |
1 (1.00) |
0.548 (1.00) |
0.498 (1.00) |
||
| 2q loss | 0 (0%) | 482 |
0.856 (1.00) |
0.983 (1.00) |
0.344 (1.00) |
1 (1.00) |
0.701 (1.00) |
0.786 (1.00) |
||
| 3p loss | 0 (0%) | 189 |
0.605 (1.00) |
0.263 (1.00) |
0.0797 (1.00) |
0.906 (1.00) |
0.0145 (1.00) |
0.327 (1.00) |
0.0343 (1.00) |
|
| 3q loss | 0 (0%) | 420 |
0.932 (1.00) |
0.00515 (1.00) |
0.00215 (0.986) |
0.573 (1.00) |
0.729 (1.00) |
0.0453 (1.00) |
0.462 (1.00) |
|
| 4p loss | 0 (0%) | 458 |
0.0602 (1.00) |
0.558 (1.00) |
0.854 (1.00) |
0.0176 (1.00) |
0.808 (1.00) |
1 (1.00) |
0.125 (1.00) |
|
| 4q loss | 0 (0%) | 465 |
0.0183 (1.00) |
0.992 (1.00) |
0.841 (1.00) |
0.0261 (1.00) |
0.174 (1.00) |
0.679 (1.00) |
0.0235 (1.00) |
|
| 6p loss | 0 (0%) | 435 |
0.235 (1.00) |
0.187 (1.00) |
0.00303 (1.00) |
0.499 (1.00) |
0.439 (1.00) |
0.034 (1.00) |
0.776 (1.00) |
|
| 6q loss | 0 (0%) | 411 |
0.548 (1.00) |
0.719 (1.00) |
0.127 (1.00) |
0.851 (1.00) |
0.868 (1.00) |
0.00727 (1.00) |
0.707 (1.00) |
|
| 8p loss | 0 (0%) | 396 |
0.528 (1.00) |
0.0663 (1.00) |
0.192 (1.00) |
0.0817 (1.00) |
0.531 (1.00) |
0.132 (1.00) |
0.801 (1.00) |
|
| 8q loss | 0 (0%) | 454 |
0.347 (1.00) |
0.592 (1.00) |
0.0226 (1.00) |
0.00419 (1.00) |
0.489 (1.00) |
0.261 (1.00) |
0.812 (1.00) |
|
| 9p loss | 0 (0%) | 406 |
0.0111 (1.00) |
0.0624 (1.00) |
0.0061 (1.00) |
0.0261 (1.00) |
0.0209 (1.00) |
0.665 (1.00) |
0.0496 (1.00) |
|
| 9q loss | 0 (0%) | 401 |
0.00542 (1.00) |
0.034 (1.00) |
0.00764 (1.00) |
0.0473 (1.00) |
0.0035 (1.00) |
0.933 (1.00) |
0.00169 (0.775) |
|
| 10p loss | 0 (0%) | 461 |
0.507 (1.00) |
0.49 (1.00) |
0.565 (1.00) |
0.0261 (1.00) |
0.803 (1.00) |
0.198 (1.00) |
0.884 (1.00) |
|
| 10q loss | 0 (0%) | 445 |
0.742 (1.00) |
0.258 (1.00) |
0.268 (1.00) |
0.0535 (1.00) |
0.677 (1.00) |
0.0712 (1.00) |
0.68 (1.00) |
|
| 11q loss | 0 (0%) | 486 |
0.148 (1.00) |
0.638 (1.00) |
0.43 (1.00) |
1 (1.00) |
0.326 (1.00) |
1 (1.00) |
||
| 13q loss | 0 (0%) | 462 |
0.0012 (0.555) |
0.0513 (1.00) |
0.334 (1.00) |
0.00419 (1.00) |
0.0394 (1.00) |
0.838 (1.00) |
0.00477 (1.00) |
|
| 14q loss | 0 (0%) | 335 |
0.251 (1.00) |
0.203 (1.00) |
0.188 (1.00) |
0.508 (1.00) |
0.142 (1.00) |
0.0814 (1.00) |
0.0231 (1.00) |
|
| 15q loss | 0 (0%) | 481 |
0.257 (1.00) |
0.13 (1.00) |
1 (1.00) |
0.408 (1.00) |
0.386 (1.00) |
0.272 (1.00) |
||
| 16q loss | 0 (0%) | 488 |
0.0864 (1.00) |
0.0696 (1.00) |
0.663 (1.00) |
0.569 (1.00) |
0.73 (1.00) |
0.0627 (1.00) |
||
| 17p loss | 0 (0%) | 468 |
0.0387 (1.00) |
0.658 (1.00) |
0.288 (1.00) |
0.0473 (1.00) |
0.0396 (1.00) |
0.592 (1.00) |
0.189 (1.00) |
|
| 17q loss | 0 (0%) | 481 |
0.697 (1.00) |
0.831 (1.00) |
0.232 (1.00) |
1 (1.00) |
0.609 (1.00) |
0.471 (1.00) |
||
| 18p loss | 0 (0%) | 447 |
0.317 (1.00) |
0.106 (1.00) |
0.626 (1.00) |
0.518 (1.00) |
0.204 (1.00) |
0.814 (1.00) |
0.333 (1.00) |
|
| 18q loss | 0 (0%) | 445 |
0.699 (1.00) |
0.22 (1.00) |
0.268 (1.00) |
0.518 (1.00) |
0.292 (1.00) |
0.856 (1.00) |
0.664 (1.00) |
|
| 20p loss | 0 (0%) | 487 |
0.751 (1.00) |
0.967 (1.00) |
1 (1.00) |
1 (1.00) |
1 (1.00) |
0.931 (1.00) |
||
| 21q loss | 0 (0%) | 461 |
0.779 (1.00) |
0.944 (1.00) |
1 (1.00) |
0.45 (1.00) |
0.565 (1.00) |
0.169 (1.00) |
||
| 22q loss | 0 (0%) | 482 |
0.228 (1.00) |
0.0446 (1.00) |
0.344 (1.00) |
1 (1.00) |
1 (1.00) |
0.196 (1.00) |
||
| Xq loss | 0 (0%) | 484 |
0.886 (1.00) |
0.739 (1.00) |
0.0308 (1.00) |
0.367 (1.00) |
0.346 (1.00) |
0.343 (1.00) |
P value = 0.000246 (t-test), Q value = 0.11
Table S1. Gene #9: '5p gain' versus Clinical Feature #2: 'AGE'
| nPatients | Mean (Std.Dev) | |
|---|---|---|
| ALL | 492 | 60.6 (12.2) |
| 5P GAIN CNV | 141 | 63.7 (12.0) |
| 5P GAIN WILD-TYPE | 351 | 59.3 (12.1) |
Figure S1. Get High-res Image Gene #9: '5p gain' versus Clinical Feature #2: 'AGE'
P value = 0.00037 (t-test), Q value = 0.17
Table S2. Gene #10: '5q gain' versus Clinical Feature #2: 'AGE'
| nPatients | Mean (Std.Dev) | |
|---|---|---|
| ALL | 492 | 60.6 (12.2) |
| 5Q GAIN CNV | 155 | 63.5 (12.3) |
| 5Q GAIN WILD-TYPE | 337 | 59.2 (11.9) |
Figure S2. Get High-res Image Gene #10: '5q gain' versus Clinical Feature #2: 'AGE'

P value = 3.9e-05 (logrank test), Q value = 0.018
Table S3. Gene #57: '11p loss' versus Clinical Feature #1: 'Time to Death'
| nPatients | nDeath | Duration Range (Median), Month | |
|---|---|---|---|
| ALL | 490 | 158 | 0.1 - 111.0 (35.2) |
| 11P LOSS CNV | 5 | 4 | 1.8 - 28.5 (12.1) |
| 11P LOSS WILD-TYPE | 485 | 154 | 0.1 - 111.0 (35.5) |
Figure S3. Get High-res Image Gene #57: '11p loss' versus Clinical Feature #1: 'Time to Death'
P value = 0.000514 (logrank test), Q value = 0.24
Table S4. Gene #67: '19p loss' versus Clinical Feature #1: 'Time to Death'
| nPatients | nDeath | Duration Range (Median), Month | |
|---|---|---|---|
| ALL | 490 | 158 | 0.1 - 111.0 (35.2) |
| 19P LOSS CNV | 4 | 4 | 10.8 - 32.6 (24.1) |
| 19P LOSS WILD-TYPE | 486 | 154 | 0.1 - 111.0 (35.5) |
Figure S4. Get High-res Image Gene #67: '19p loss' versus Clinical Feature #1: 'Time to Death'
-
Mutation data file = broad_values_by_arm.mutsig.cluster.txt
-
Clinical data file = KIRC-TP.clin.merged.picked.txt
-
Number of patients = 493
-
Number of significantly arm-level cnvs = 71
-
Number of selected clinical features = 8
-
Exclude genes that fewer than K tumors have mutations, K = 3
For survival clinical features, the Kaplan-Meier survival curves of tumors with and without gene mutations were plotted and the statistical significance P values were estimated by logrank test (Bland and Altman 2004) using the 'survdiff' function in R
For continuous numerical clinical features, two-tailed Student's t test with unequal variance (Lehmann and Romano 2005) was applied to compare the clinical values between tumors with and without gene mutations using 't.test' function in R
For binary or multi-class clinical features (nominal or ordinal), two-tailed Fisher's exact tests (Fisher 1922) were used to estimate the P values using the 'fisher.test' function in R
For multiple hypothesis correction, Q value is the False Discovery Rate (FDR) analogue of the P value (Benjamini and Hochberg 1995), defined as the minimum FDR at which the test may be called significant. We used the 'Benjamini and Hochberg' method of 'p.adjust' function in R to convert P values into Q values.
This is an experimental feature. The full results of the analysis summarized in this report can be downloaded from the TCGA Data Coordination Center.