This pipeline computes the correlation between significantly recurrent gene mutations and selected clinical features.
Testing the association between mutation status of 10 genes and 8 clinical features across 293 patients, 5 significant findings detected with Q value < 0.25.
-
BAP1 mutation correlated to 'GENDER', 'DISTANT.METASTASIS', and 'NEOPLASM.DISEASESTAGE'.
-
TP53 mutation correlated to 'Time to Death'.
-
EBPL mutation correlated to 'GENDER'.
Table 1. Get Full Table Overview of the association between mutation status of 10 genes and 8 clinical features. Shown in the table are P values (Q values). Thresholded by Q value < 0.25, 5 significant findings detected.
|
Clinical Features |
Time to Death |
AGE | GENDER |
KARNOFSKY PERFORMANCE SCORE |
DISTANT METASTASIS |
LYMPH NODE METASTASIS |
TUMOR STAGECODE |
NEOPLASM DISEASESTAGE |
||
| nMutated (%) | nWild-Type | logrank test | t-test | Fisher's exact test | t-test | Fisher's exact test | Fisher's exact test | t-test | Fisher's exact test | |
| BAP1 | 27 (9%) | 266 |
0.0136 (0.76) |
0.742 (1.00) |
0.00238 (0.14) |
0.00411 (0.238) |
0.108 (1.00) |
0.000291 (0.018) |
||
| TP53 | 6 (2%) | 287 |
0.000354 (0.0216) |
0.259 (1.00) |
0.188 (1.00) |
0.579 (1.00) |
0.169 (1.00) |
0.0221 (1.00) |
||
| EBPL | 6 (2%) | 287 |
0.48 (1.00) |
0.527 (1.00) |
0.00161 (0.0968) |
1 (1.00) |
0.0384 (1.00) |
0.0758 (1.00) |
||
| PBRM1 | 107 (37%) | 186 |
0.533 (1.00) |
0.813 (1.00) |
0.309 (1.00) |
0.429 (1.00) |
0.593 (1.00) |
0.413 (1.00) |
0.939 (1.00) |
|
| SV2C | 3 (1%) | 290 |
0.731 (1.00) |
0.0205 (1.00) |
1 (1.00) |
1 (1.00) |
0.205 (1.00) |
1 (1.00) |
||
| VHL | 138 (47%) | 155 |
0.668 (1.00) |
0.0301 (1.00) |
0.176 (1.00) |
0.359 (1.00) |
1 (1.00) |
0.491 (1.00) |
0.145 (1.00) |
|
| SETD2 | 34 (12%) | 259 |
0.762 (1.00) |
0.0994 (1.00) |
0.181 (1.00) |
0.101 (1.00) |
0.72 (1.00) |
0.0591 (1.00) |
||
| KDM5C | 18 (6%) | 275 |
0.0803 (1.00) |
0.206 (1.00) |
0.00486 (0.277) |
1 (1.00) |
0.741 (1.00) |
0.857 (1.00) |
||
| PTEN | 9 (3%) | 284 |
0.769 (1.00) |
0.219 (1.00) |
0.503 (1.00) |
0.613 (1.00) |
0.0299 (1.00) |
0.226 (1.00) |
||
| TOR1A | 3 (1%) | 290 |
0.0532 (1.00) |
0.704 (1.00) |
1 (1.00) |
1 (1.00) |
0.0562 (1.00) |
1 (1.00) |
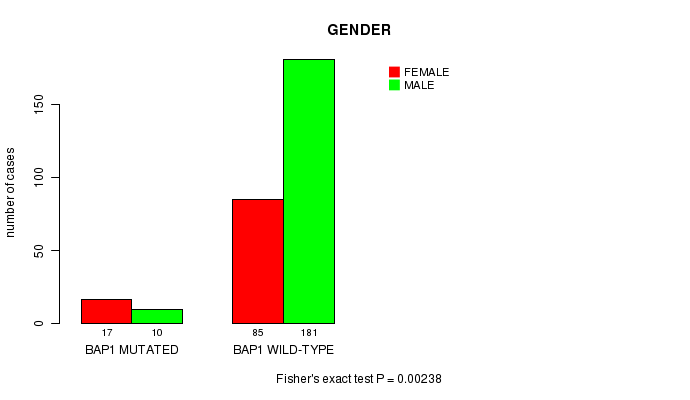
P value = 0.00238 (Fisher's exact test), Q value = 0.14
Table S1. Gene #4: 'BAP1 MUTATION STATUS' versus Clinical Feature #3: 'GENDER'
| nPatients | FEMALE | MALE |
|---|---|---|
| ALL | 102 | 191 |
| BAP1 MUTATED | 17 | 10 |
| BAP1 WILD-TYPE | 85 | 181 |
Figure S1. Get High-res Image Gene #4: 'BAP1 MUTATION STATUS' versus Clinical Feature #3: 'GENDER'
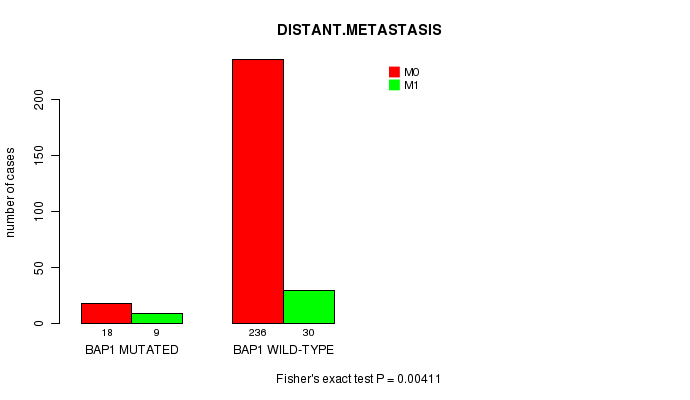
P value = 0.00411 (Fisher's exact test), Q value = 0.24
Table S2. Gene #4: 'BAP1 MUTATION STATUS' versus Clinical Feature #5: 'DISTANT.METASTASIS'
| nPatients | M0 | M1 |
|---|---|---|
| ALL | 254 | 39 |
| BAP1 MUTATED | 18 | 9 |
| BAP1 WILD-TYPE | 236 | 30 |
Figure S2. Get High-res Image Gene #4: 'BAP1 MUTATION STATUS' versus Clinical Feature #5: 'DISTANT.METASTASIS'
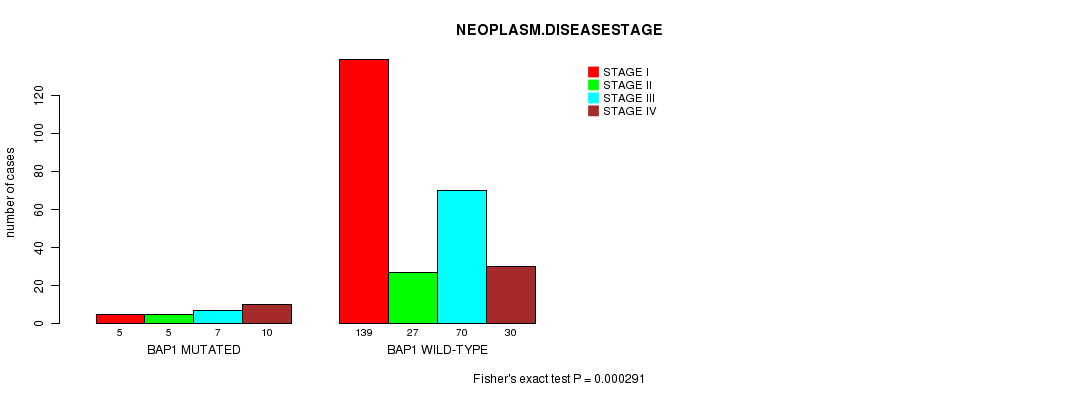
P value = 0.000291 (Fisher's exact test), Q value = 0.018
Table S3. Gene #4: 'BAP1 MUTATION STATUS' versus Clinical Feature #8: 'NEOPLASM.DISEASESTAGE'
| nPatients | STAGE I | STAGE II | STAGE III | STAGE IV |
|---|---|---|---|---|
| ALL | 144 | 32 | 77 | 40 |
| BAP1 MUTATED | 5 | 5 | 7 | 10 |
| BAP1 WILD-TYPE | 139 | 27 | 70 | 30 |
Figure S3. Get High-res Image Gene #4: 'BAP1 MUTATION STATUS' versus Clinical Feature #8: 'NEOPLASM.DISEASESTAGE'
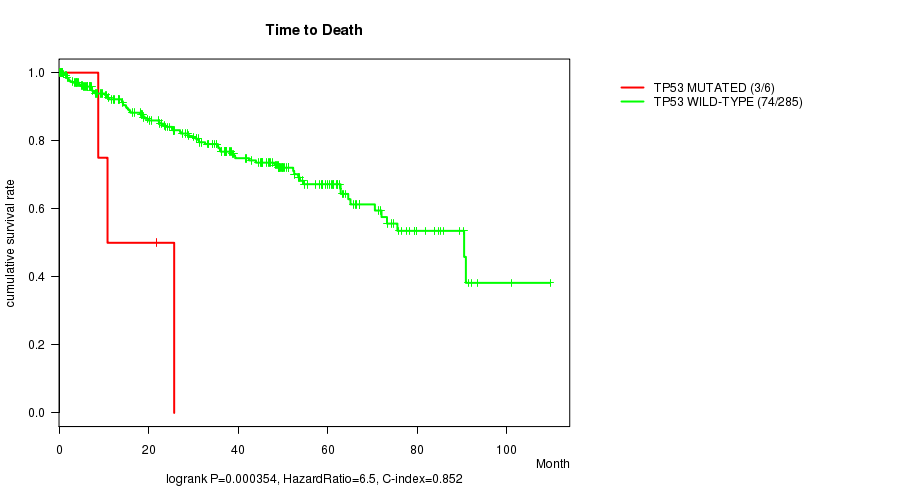
P value = 0.000354 (logrank test), Q value = 0.022
Table S4. Gene #7: 'TP53 MUTATION STATUS' versus Clinical Feature #1: 'Time to Death'
| nPatients | nDeath | Duration Range (Median), Month | |
|---|---|---|---|
| ALL | 291 | 77 | 0.1 - 109.6 (34.3) |
| TP53 MUTATED | 6 | 3 | 0.2 - 25.7 (9.8) |
| TP53 WILD-TYPE | 285 | 74 | 0.1 - 109.6 (35.2) |
Figure S4. Get High-res Image Gene #7: 'TP53 MUTATION STATUS' versus Clinical Feature #1: 'Time to Death'
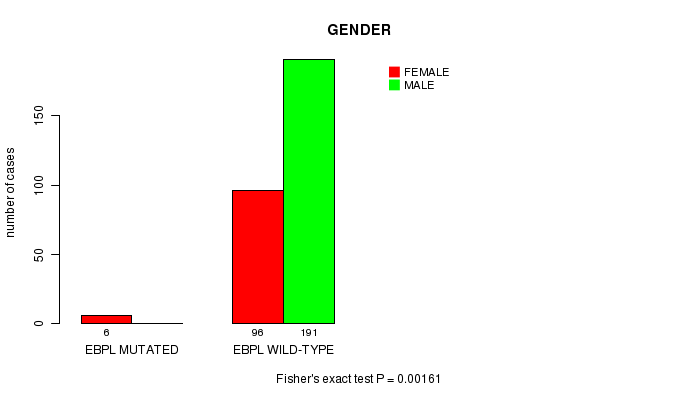
P value = 0.00161 (Fisher's exact test), Q value = 0.097
Table S5. Gene #9: 'EBPL MUTATION STATUS' versus Clinical Feature #3: 'GENDER'
| nPatients | FEMALE | MALE |
|---|---|---|
| ALL | 102 | 191 |
| EBPL MUTATED | 6 | 0 |
| EBPL WILD-TYPE | 96 | 191 |
Figure S5. Get High-res Image Gene #9: 'EBPL MUTATION STATUS' versus Clinical Feature #3: 'GENDER'
-
Mutation data file = KIRC-TP.mutsig.cluster.txt
-
Clinical data file = KIRC-TP.clin.merged.picked.txt
-
Number of patients = 293
-
Number of significantly mutated genes = 10
-
Number of selected clinical features = 8
-
Exclude genes that fewer than K tumors have mutations, K = 3
For survival clinical features, the Kaplan-Meier survival curves of tumors with and without gene mutations were plotted and the statistical significance P values were estimated by logrank test (Bland and Altman 2004) using the 'survdiff' function in R
For continuous numerical clinical features, two-tailed Student's t test with unequal variance (Lehmann and Romano 2005) was applied to compare the clinical values between tumors with and without gene mutations using 't.test' function in R
For binary or multi-class clinical features (nominal or ordinal), two-tailed Fisher's exact tests (Fisher 1922) were used to estimate the P values using the 'fisher.test' function in R
For multiple hypothesis correction, Q value is the False Discovery Rate (FDR) analogue of the P value (Benjamini and Hochberg 1995), defined as the minimum FDR at which the test may be called significant. We used the 'Benjamini and Hochberg' method of 'p.adjust' function in R to convert P values into Q values.
This is an experimental feature. The full results of the analysis summarized in this report can be downloaded from the TCGA Data Coordination Center.