This pipeline computes the correlation between significant arm-level copy number variations (cnvs) and selected clinical features.
Testing the association between copy number variation 58 arm-level results and 8 clinical features across 104 patients, 7 significant findings detected with Q value < 0.25.
-
1q gain cnv correlated to 'Time to Death'.
-
6q gain cnv correlated to 'Time to Death'.
-
7p gain cnv correlated to 'NEOPLASM.DISEASESTAGE'.
-
17p gain cnv correlated to 'NEOPLASM.DISEASESTAGE'.
-
3q loss cnv correlated to 'Time to Death'.
-
5p loss cnv correlated to 'Time to Death'.
-
17p loss cnv correlated to 'Time to Death'.
Table 1. Get Full Table Overview of the association between significant copy number variation of 58 arm-level results and 8 clinical features. Shown in the table are P values (Q values). Thresholded by Q value < 0.25, 7 significant findings detected.
|
Clinical Features |
Time to Death |
AGE | GENDER |
KARNOFSKY PERFORMANCE SCORE |
DISTANT METASTASIS |
LYMPH NODE METASTASIS |
TUMOR STAGECODE |
NEOPLASM DISEASESTAGE |
||
| nCNV (%) | nWild-Type | logrank test | t-test | Fisher's exact test | t-test | Fisher's exact test | Fisher's exact test | t-test | Fisher's exact test | |
| 1q gain | 0 (0%) | 96 |
8.75e-05 (0.0321) |
0.801 (1.00) |
0.433 (1.00) |
0.0788 (1.00) |
0.0313 (1.00) |
0.00604 (1.00) |
||
| 6q gain | 0 (0%) | 101 |
4.2e-06 (0.00155) |
0.26 (1.00) |
0.549 (1.00) |
0.00644 (1.00) |
0.084 (1.00) |
0.0498 (1.00) |
||
| 7p gain | 0 (0%) | 49 |
0.0751 (1.00) |
0.949 (1.00) |
0.0587 (1.00) |
0.184 (1.00) |
0.152 (1.00) |
0.00304 (1.00) |
0.000465 (0.169) |
|
| 17p gain | 0 (0%) | 52 |
0.231 (1.00) |
0.0507 (1.00) |
0.0208 (1.00) |
0.182 (1.00) |
0.0715 (1.00) |
0.00208 (0.746) |
0.000279 (0.102) |
|
| 3q loss | 0 (0%) | 101 |
2.4e-06 (0.000884) |
0.325 (1.00) |
1 (1.00) |
0.2 (1.00) |
0.0289 (1.00) |
0.0994 (1.00) |
||
| 5p loss | 0 (0%) | 100 |
0.000193 (0.0705) |
0.0662 (1.00) |
0.101 (1.00) |
0.626 (1.00) |
0.0258 (1.00) |
0.0994 (1.00) |
||
| 17p loss | 0 (0%) | 99 |
1.56e-07 (5.77e-05) |
0.491 (1.00) |
0.0383 (1.00) |
0.0916 (1.00) |
0.11 (1.00) |
0.0423 (1.00) |
||
| 2p gain | 0 (0%) | 93 |
0.186 (1.00) |
0.357 (1.00) |
0.747 (1.00) |
0.541 (1.00) |
0.0429 (1.00) |
0.394 (1.00) |
0.0342 (1.00) |
|
| 2q gain | 0 (0%) | 91 |
0.342 (1.00) |
0.847 (1.00) |
0.753 (1.00) |
0.501 (1.00) |
0.0615 (1.00) |
0.106 (1.00) |
0.00852 (1.00) |
|
| 3p gain | 0 (0%) | 80 |
0.42 (1.00) |
0.92 (1.00) |
0.0815 (1.00) |
0.0792 (1.00) |
0.641 (1.00) |
0.102 (1.00) |
0.236 (1.00) |
|
| 3q gain | 0 (0%) | 78 |
0.293 (1.00) |
0.859 (1.00) |
0.0322 (1.00) |
0.197 (1.00) |
0.614 (1.00) |
0.145 (1.00) |
0.399 (1.00) |
|
| 4p gain | 0 (0%) | 100 |
0.0677 (1.00) |
0.0422 (1.00) |
1 (1.00) |
0.0285 (1.00) |
0.0513 (1.00) |
0.0498 (1.00) |
||
| 4q gain | 0 (0%) | 101 |
0.696 (1.00) |
0.0416 (1.00) |
1 (1.00) |
0.114 (1.00) |
||||
| 5p gain | 0 (0%) | 94 |
0.754 (1.00) |
0.382 (1.00) |
0.725 (1.00) |
0.397 (1.00) |
0.389 (1.00) |
0.332 (1.00) |
0.176 (1.00) |
|
| 5q gain | 0 (0%) | 94 |
0.302 (1.00) |
0.612 (1.00) |
0.725 (1.00) |
0.397 (1.00) |
0.485 (1.00) |
0.332 (1.00) |
0.404 (1.00) |
|
| 6p gain | 0 (0%) | 100 |
0.0735 (1.00) |
0.365 (1.00) |
0.301 (1.00) |
0.00664 (1.00) |
0.0877 (1.00) |
0.0762 (1.00) |
||
| 7q gain | 0 (0%) | 48 |
0.0751 (1.00) |
0.949 (1.00) |
0.0938 (1.00) |
0.184 (1.00) |
0.199 (1.00) |
0.00197 (0.713) |
0.00172 (0.622) |
|
| 8p gain | 0 (0%) | 99 |
0.568 (1.00) |
0.241 (1.00) |
0.661 (1.00) |
0.73 (1.00) |
0.0484 (1.00) |
0.16 (1.00) |
||
| 8q gain | 0 (0%) | 97 |
0.00461 (1.00) |
0.621 (1.00) |
0.68 (1.00) |
0.482 (1.00) |
0.00251 (0.897) |
0.00872 (1.00) |
||
| 10p gain | 0 (0%) | 100 |
0.489 (1.00) |
0.801 (1.00) |
1 (1.00) |
1 (1.00) |
0.782 (1.00) |
|||
| 10q gain | 0 (0%) | 101 |
0.489 (1.00) |
0.801 (1.00) |
0.549 (1.00) |
1 (1.00) |
1 (1.00) |
|||
| 12p gain | 0 (0%) | 73 |
0.979 (1.00) |
0.658 (1.00) |
0.0225 (1.00) |
0.248 (1.00) |
0.412 (1.00) |
0.558 (1.00) |
0.347 (1.00) |
|
| 12q gain | 0 (0%) | 73 |
0.979 (1.00) |
0.658 (1.00) |
0.0225 (1.00) |
0.248 (1.00) |
0.412 (1.00) |
0.558 (1.00) |
0.347 (1.00) |
|
| 13q gain | 0 (0%) | 93 |
0.722 (1.00) |
0.237 (1.00) |
0.747 (1.00) |
0.197 (1.00) |
1 (1.00) |
0.47 (1.00) |
0.74 (1.00) |
|
| 16p gain | 0 (0%) | 60 |
0.55 (1.00) |
0.438 (1.00) |
0.0106 (1.00) |
0.529 (1.00) |
0.657 (1.00) |
0.284 (1.00) |
0.861 (1.00) |
|
| 16q gain | 0 (0%) | 63 |
0.107 (1.00) |
0.55 (1.00) |
0.0317 (1.00) |
0.25 (1.00) |
0.255 (1.00) |
0.0859 (1.00) |
0.819 (1.00) |
|
| 17q gain | 0 (0%) | 42 |
0.791 (1.00) |
0.103 (1.00) |
0.203 (1.00) |
0.561 (1.00) |
0.176 (1.00) |
0.0482 (1.00) |
0.134 (1.00) |
|
| 18p gain | 0 (0%) | 98 |
0.19 (1.00) |
0.598 (1.00) |
0.661 (1.00) |
0.541 (1.00) |
0.355 (1.00) |
0.632 (1.00) |
0.458 (1.00) |
|
| 18q gain | 0 (0%) | 100 |
0.612 (1.00) |
0.572 (1.00) |
1 (1.00) |
1 (1.00) |
0.782 (1.00) |
1 (1.00) |
||
| 20p gain | 0 (0%) | 73 |
0.446 (1.00) |
0.0192 (1.00) |
0.654 (1.00) |
0.636 (1.00) |
0.519 (1.00) |
0.686 (1.00) |
0.439 (1.00) |
|
| 20q gain | 0 (0%) | 72 |
0.446 (1.00) |
0.046 (1.00) |
0.651 (1.00) |
0.636 (1.00) |
0.815 (1.00) |
0.616 (1.00) |
0.637 (1.00) |
|
| Xq gain | 0 (0%) | 100 |
0.413 (1.00) |
0.362 (1.00) |
0.101 (1.00) |
0.716 (1.00) |
0.217 (1.00) |
0.356 (1.00) |
||
| 1p loss | 0 (0%) | 93 |
0.727 (1.00) |
0.414 (1.00) |
1 (1.00) |
0.342 (1.00) |
1 (1.00) |
0.714 (1.00) |
0.539 (1.00) |
|
| 1q loss | 0 (0%) | 98 |
0.649 (1.00) |
0.825 (1.00) |
1 (1.00) |
0.342 (1.00) |
0.529 (1.00) |
1 (1.00) |
0.643 (1.00) |
|
| 3p loss | 0 (0%) | 98 |
0.207 (1.00) |
0.0519 (1.00) |
0.661 (1.00) |
0.337 (1.00) |
0.00147 (0.535) |
0.0927 (1.00) |
||
| 4p loss | 0 (0%) | 96 |
0.187 (1.00) |
0.104 (1.00) |
0.0141 (1.00) |
0.349 (1.00) |
0.0712 (1.00) |
0.051 (1.00) |
||
| 4q loss | 0 (0%) | 95 |
0.8 (1.00) |
0.414 (1.00) |
0.0557 (1.00) |
0.682 (1.00) |
0.599 (1.00) |
0.14 (1.00) |
||
| 5q loss | 0 (0%) | 100 |
0.0264 (1.00) |
0.23 (1.00) |
0.101 (1.00) |
0.626 (1.00) |
0.144 (1.00) |
0.565 (1.00) |
||
| 6p loss | 0 (0%) | 95 |
0.0291 (1.00) |
0.997 (1.00) |
0.47 (1.00) |
0.248 (1.00) |
1 (1.00) |
0.401 (1.00) |
0.335 (1.00) |
|
| 6q loss | 0 (0%) | 94 |
0.273 (1.00) |
0.361 (1.00) |
0.0756 (1.00) |
0.383 (1.00) |
0.583 (1.00) |
0.269 (1.00) |
0.483 (1.00) |
|
| 8p loss | 0 (0%) | 101 |
0.75 (1.00) |
0.404 (1.00) |
0.0329 (1.00) |
1 (1.00) |
1 (1.00) |
0.268 (1.00) |
||
| 9p loss | 0 (0%) | 91 |
0.0801 (1.00) |
0.475 (1.00) |
0.00846 (1.00) |
0.398 (1.00) |
0.386 (1.00) |
0.205 (1.00) |
0.176 (1.00) |
|
| 9q loss | 0 (0%) | 91 |
0.127 (1.00) |
0.448 (1.00) |
0.0264 (1.00) |
0.398 (1.00) |
0.577 (1.00) |
0.205 (1.00) |
0.295 (1.00) |
|
| 10p loss | 0 (0%) | 98 |
0.256 (1.00) |
0.987 (1.00) |
0.39 (1.00) |
0.397 (1.00) |
0.0916 (1.00) |
0.0553 (1.00) |
0.567 (1.00) |
|
| 10q loss | 0 (0%) | 98 |
0.0212 (1.00) |
0.666 (1.00) |
1 (1.00) |
0.397 (1.00) |
0.181 (1.00) |
0.0412 (1.00) |
0.378 (1.00) |
|
| 11p loss | 0 (0%) | 96 |
0.00469 (1.00) |
0.0515 (1.00) |
0.714 (1.00) |
0.523 (1.00) |
1 (1.00) |
0.174 (1.00) |
||
| 11q loss | 0 (0%) | 95 |
0.0212 (1.00) |
0.0668 (1.00) |
1 (1.00) |
0.485 (1.00) |
0.468 (1.00) |
0.0641 (1.00) |
||
| 13q loss | 0 (0%) | 95 |
0.0238 (1.00) |
0.428 (1.00) |
0.00521 (1.00) |
0.682 (1.00) |
0.156 (1.00) |
0.283 (1.00) |
||
| 14q loss | 0 (0%) | 85 |
0.925 (1.00) |
0.379 (1.00) |
0.418 (1.00) |
0.377 (1.00) |
0.238 (1.00) |
0.232 (1.00) |
0.421 (1.00) |
|
| 15q loss | 0 (0%) | 94 |
0.0623 (1.00) |
0.366 (1.00) |
0.725 (1.00) |
0.654 (1.00) |
1 (1.00) |
0.481 (1.00) |
0.237 (1.00) |
|
| 16q loss | 0 (0%) | 101 |
0.0329 (1.00) |
0.626 (1.00) |
0.164 (1.00) |
0.356 (1.00) |
||||
| 18p loss | 0 (0%) | 89 |
0.00201 (0.724) |
0.86 (1.00) |
1 (1.00) |
0.342 (1.00) |
0.788 (1.00) |
0.49 (1.00) |
0.276 (1.00) |
|
| 18q loss | 0 (0%) | 88 |
0.00201 (0.724) |
0.86 (1.00) |
0.773 (1.00) |
0.342 (1.00) |
0.801 (1.00) |
0.492 (1.00) |
0.138 (1.00) |
|
| 19p loss | 0 (0%) | 100 |
0.649 (1.00) |
0.582 (1.00) |
1 (1.00) |
0.626 (1.00) |
0.782 (1.00) |
0.268 (1.00) |
||
| 19q loss | 0 (0%) | 101 |
0.75 (1.00) |
0.877 (1.00) |
1 (1.00) |
1 (1.00) |
||||
| 21q loss | 0 (0%) | 93 |
0.152 (1.00) |
0.432 (1.00) |
0.497 (1.00) |
1 (1.00) |
1 (1.00) |
0.237 (1.00) |
||
| 22q loss | 0 (0%) | 84 |
0.752 (1.00) |
0.699 (1.00) |
0.109 (1.00) |
0.445 (1.00) |
0.168 (1.00) |
0.481 (1.00) |
0.208 (1.00) |
|
| Xq loss | 0 (0%) | 101 |
0.75 (1.00) |
0.915 (1.00) |
1 (1.00) |
1 (1.00) |
1 (1.00) |
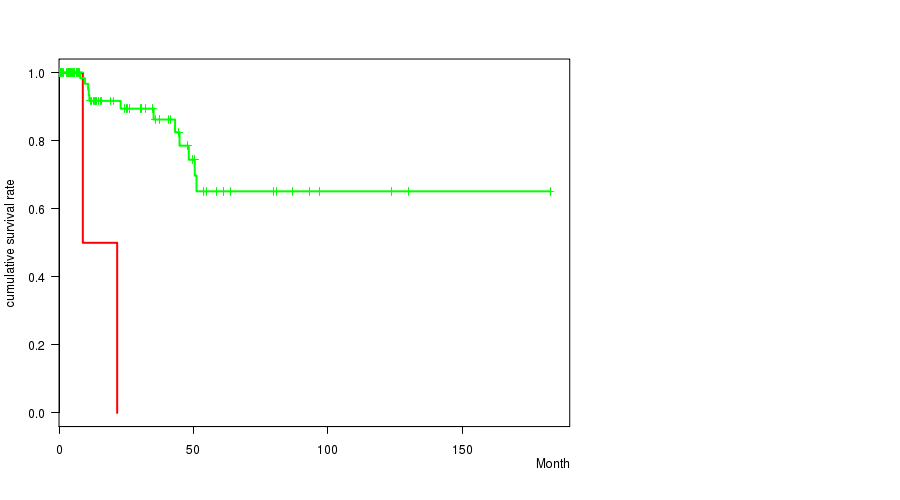
P value = 8.75e-05 (logrank test), Q value = 0.032
Table S1. Gene #1: '1q gain' versus Clinical Feature #1: 'Time to Death'
| nPatients | nDeath | Duration Range (Median), Month | |
|---|---|---|---|
| ALL | 97 | 14 | 0.0 - 182.7 (13.7) |
| 1Q GAIN CNV | 7 | 2 | 0.7 - 25.4 (7.6) |
| 1Q GAIN WILD-TYPE | 90 | 12 | 0.0 - 182.7 (14.6) |
Figure S1. Get High-res Image Gene #1: '1q gain' versus Clinical Feature #1: 'Time to Death'

P value = 4.2e-06 (logrank test), Q value = 0.0015
Table S2. Gene #11: '6q gain' versus Clinical Feature #1: 'Time to Death'
| nPatients | nDeath | Duration Range (Median), Month | |
|---|---|---|---|
| ALL | 97 | 14 | 0.0 - 182.7 (13.7) |
| 6Q GAIN CNV | 3 | 2 | 7.9 - 13.6 (9.6) |
| 6Q GAIN WILD-TYPE | 94 | 12 | 0.0 - 182.7 (14.4) |
Figure S2. Get High-res Image Gene #11: '6q gain' versus Clinical Feature #1: 'Time to Death'

P value = 0.000465 (Fisher's exact test), Q value = 0.17
Table S3. Gene #12: '7p gain' versus Clinical Feature #8: 'NEOPLASM.DISEASESTAGE'
| nPatients | STAGE I | STAGE II | STAGE III | STAGE IV |
|---|---|---|---|---|
| ALL | 53 | 7 | 24 | 9 |
| 7P GAIN CNV | 36 | 2 | 5 | 4 |
| 7P GAIN WILD-TYPE | 17 | 5 | 19 | 5 |
Figure S3. Get High-res Image Gene #12: '7p gain' versus Clinical Feature #8: 'NEOPLASM.DISEASESTAGE'

P value = 0.000279 (Fisher's exact test), Q value = 0.1
Table S4. Gene #23: '17p gain' versus Clinical Feature #8: 'NEOPLASM.DISEASESTAGE'
| nPatients | STAGE I | STAGE II | STAGE III | STAGE IV |
|---|---|---|---|---|
| ALL | 53 | 7 | 24 | 9 |
| 17P GAIN CNV | 34 | 3 | 4 | 2 |
| 17P GAIN WILD-TYPE | 19 | 4 | 20 | 7 |
Figure S4. Get High-res Image Gene #23: '17p gain' versus Clinical Feature #8: 'NEOPLASM.DISEASESTAGE'

P value = 2.4e-06 (logrank test), Q value = 0.00088
Table S5. Gene #33: '3q loss' versus Clinical Feature #1: 'Time to Death'
| nPatients | nDeath | Duration Range (Median), Month | |
|---|---|---|---|
| ALL | 97 | 14 | 0.0 - 182.7 (13.7) |
| 3Q LOSS CNV | 3 | 2 | 3.7 - 21.6 (8.8) |
| 3Q LOSS WILD-TYPE | 94 | 12 | 0.0 - 182.7 (13.9) |
Figure S5. Get High-res Image Gene #33: '3q loss' versus Clinical Feature #1: 'Time to Death'
P value = 0.000193 (logrank test), Q value = 0.071
Table S6. Gene #36: '5p loss' versus Clinical Feature #1: 'Time to Death'
| nPatients | nDeath | Duration Range (Median), Month | |
|---|---|---|---|
| ALL | 97 | 14 | 0.0 - 182.7 (13.7) |
| 5P LOSS CNV | 4 | 2 | 0.0 - 22.9 (7.4) |
| 5P LOSS WILD-TYPE | 93 | 12 | 0.0 - 182.7 (14.1) |
Figure S6. Get High-res Image Gene #36: '5p loss' versus Clinical Feature #1: 'Time to Death'

P value = 1.56e-07 (logrank test), Q value = 5.8e-05
Table S7. Gene #51: '17p loss' versus Clinical Feature #1: 'Time to Death'
| nPatients | nDeath | Duration Range (Median), Month | |
|---|---|---|---|
| ALL | 97 | 14 | 0.0 - 182.7 (13.7) |
| 17P LOSS CNV | 4 | 2 | 0.2 - 11.1 (5.2) |
| 17P LOSS WILD-TYPE | 93 | 12 | 0.0 - 182.7 (14.6) |
Figure S7. Get High-res Image Gene #51: '17p loss' versus Clinical Feature #1: 'Time to Death'

-
Mutation data file = broad_values_by_arm.mutsig.cluster.txt
-
Clinical data file = KIRP-TP.clin.merged.picked.txt
-
Number of patients = 104
-
Number of significantly arm-level cnvs = 58
-
Number of selected clinical features = 8
-
Exclude genes that fewer than K tumors have mutations, K = 3
For survival clinical features, the Kaplan-Meier survival curves of tumors with and without gene mutations were plotted and the statistical significance P values were estimated by logrank test (Bland and Altman 2004) using the 'survdiff' function in R
For continuous numerical clinical features, two-tailed Student's t test with unequal variance (Lehmann and Romano 2005) was applied to compare the clinical values between tumors with and without gene mutations using 't.test' function in R
For binary or multi-class clinical features (nominal or ordinal), two-tailed Fisher's exact tests (Fisher 1922) were used to estimate the P values using the 'fisher.test' function in R
For multiple hypothesis correction, Q value is the False Discovery Rate (FDR) analogue of the P value (Benjamini and Hochberg 1995), defined as the minimum FDR at which the test may be called significant. We used the 'Benjamini and Hochberg' method of 'p.adjust' function in R to convert P values into Q values.
This is an experimental feature. The full results of the analysis summarized in this report can be downloaded from the TCGA Data Coordination Center.