This pipeline computes the correlation between significant copy number variation (cnv focal) genes and selected clinical features.
Testing the association between copy number variation 33 arm-level results and 8 clinical features across 104 patients, 5 significant findings detected with Q value < 0.25.
-
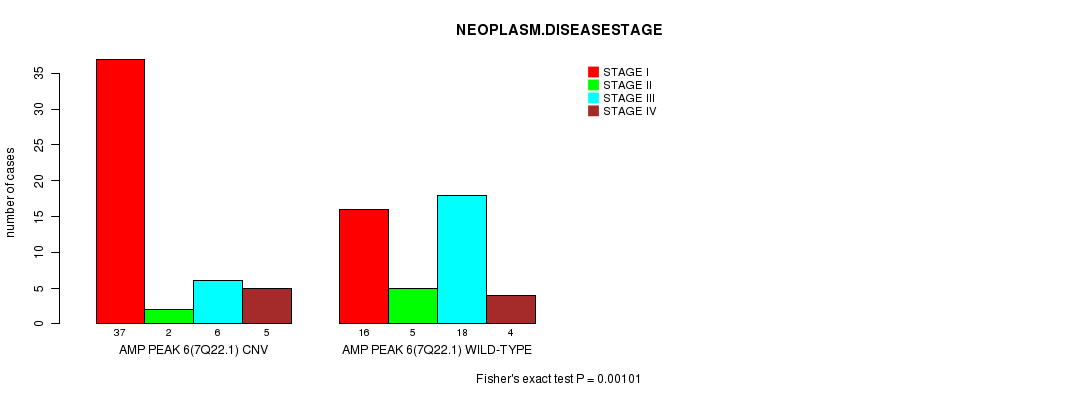
Amp Peak 6(7q22.1) cnv correlated to 'NEOPLASM.DISEASESTAGE'.
-
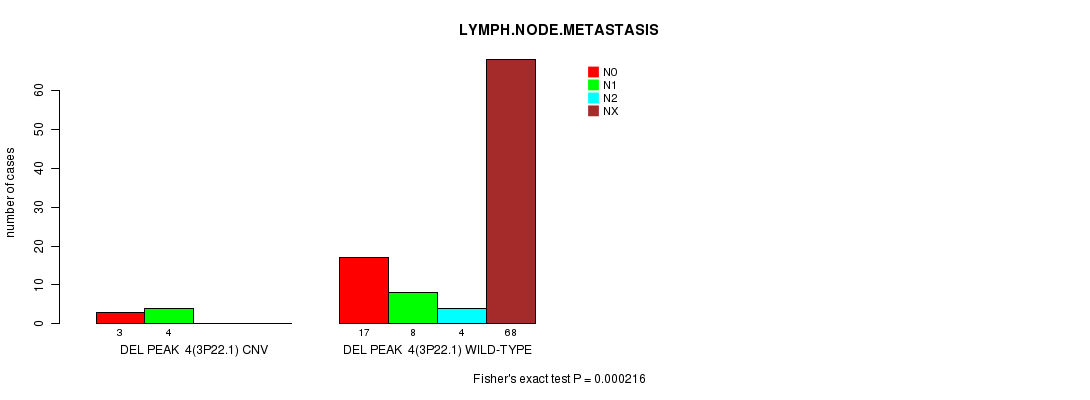
Del Peak 4(3p22.1) cnv correlated to 'LYMPH.NODE.METASTASIS'.
-
Del Peak 6(5p15.2) cnv correlated to 'Time to Death'.
-
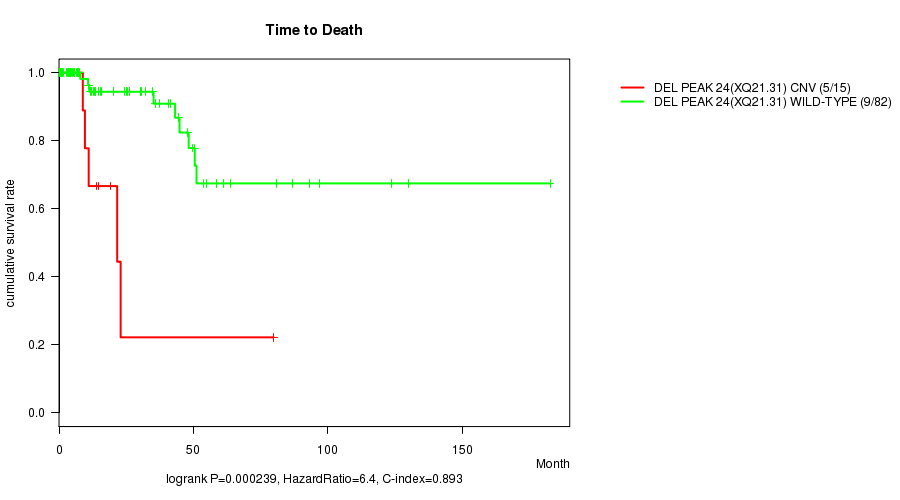
Del Peak 24(Xq21.31) cnv correlated to 'Time to Death'.
-
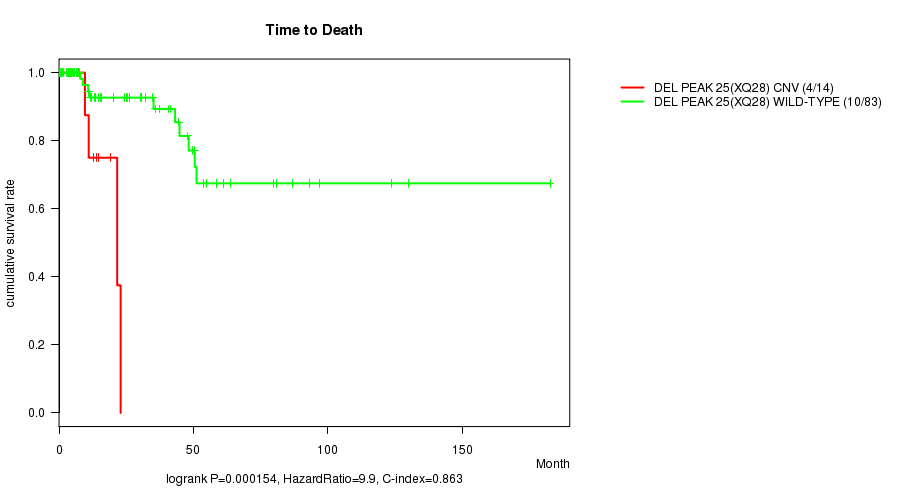
Del Peak 25(Xq28) cnv correlated to 'Time to Death'.
Table 1. Get Full Table Overview of the association between significant copy number variation of 33 arm-level results and 8 clinical features. Shown in the table are P values (Q values). Thresholded by Q value < 0.25, 5 significant findings detected.
|
Clinical Features |
Time to Death |
AGE | GENDER |
KARNOFSKY PERFORMANCE SCORE |
DISTANT METASTASIS |
LYMPH NODE METASTASIS |
TUMOR STAGECODE |
NEOPLASM DISEASESTAGE |
||
| nCNV (%) | nWild-Type | logrank test | t-test | Fisher's exact test | t-test | Fisher's exact test | Fisher's exact test | t-test | Fisher's exact test | |
| Amp Peak 6(7q22 1) | 0 (0%) | 45 |
0.0667 (1.00) |
0.815 (1.00) |
0.092 (1.00) |
0.184 (1.00) |
0.505 (1.00) |
0.0106 (1.00) |
0.00101 (0.216) |
|
| Del Peak 4(3p22 1) | 0 (0%) | 97 |
0.273 (1.00) |
0.0375 (1.00) |
1 (1.00) |
0.304 (1.00) |
0.000216 (0.0468) |
0.0455 (1.00) |
||
| Del Peak 6(5p15 2) | 0 (0%) | 98 |
0.000193 (0.0418) |
0.0215 (1.00) |
0.39 (1.00) |
0.278 (1.00) |
0.00861 (1.00) |
0.0686 (1.00) |
||
| Del Peak 24(Xq21 31) | 0 (0%) | 88 |
0.000239 (0.0515) |
0.182 (1.00) |
0.147 (1.00) |
0.398 (1.00) |
0.12 (1.00) |
0.0401 (1.00) |
0.106 (1.00) |
|
| Del Peak 25(Xq28) | 0 (0%) | 89 |
0.000154 (0.0337) |
0.248 (1.00) |
0.0793 (1.00) |
0.458 (1.00) |
0.353 (1.00) |
0.172 (1.00) |
0.221 (1.00) |
|
| Amp Peak 1(2q32 1) | 0 (0%) | 84 |
0.591 (1.00) |
0.397 (1.00) |
0.797 (1.00) |
0.501 (1.00) |
0.05 (1.00) |
0.0164 (1.00) |
0.0676 (1.00) |
|
| Amp Peak 2(3p14 1) | 0 (0%) | 77 |
0.61 (1.00) |
0.714 (1.00) |
0.235 (1.00) |
0.13 (1.00) |
0.629 (1.00) |
0.0351 (1.00) |
0.23 (1.00) |
|
| Amp Peak 3(3q26 31) | 0 (0%) | 72 |
0.279 (1.00) |
0.834 (1.00) |
0.174 (1.00) |
0.174 (1.00) |
0.257 (1.00) |
0.116 (1.00) |
0.664 (1.00) |
|
| Amp Peak 4(5q35 2) | 0 (0%) | 90 |
0.892 (1.00) |
0.967 (1.00) |
1 (1.00) |
0.397 (1.00) |
0.651 (1.00) |
0.0442 (1.00) |
0.361 (1.00) |
|
| Amp Peak 5(6p12 3) | 0 (0%) | 100 |
0.565 (1.00) |
0.352 (1.00) |
1 (1.00) |
0.213 (1.00) |
0.0877 (1.00) |
0.267 (1.00) |
||
| Amp Peak 7(17q25 2) | 0 (0%) | 34 |
0.525 (1.00) |
0.0994 (1.00) |
0.0441 (1.00) |
0.561 (1.00) |
0.0385 (1.00) |
0.531 (1.00) |
0.584 (1.00) |
|
| Amp Peak 8(19p13 2) | 0 (0%) | 91 |
0.993 (1.00) |
0.0743 (1.00) |
1 (1.00) |
0.136 (1.00) |
1 (1.00) |
1 (1.00) |
0.74 (1.00) |
|
| Amp Peak 9(19q13 11) | 0 (0%) | 100 |
0.375 (1.00) |
0.263 (1.00) |
1 (1.00) |
0.716 (1.00) |
0.178 (1.00) |
0.807 (1.00) |
||
| Del Peak 1(1p36 31) | 0 (0%) | 82 |
0.116 (1.00) |
0.66 (1.00) |
0.799 (1.00) |
0.377 (1.00) |
0.0972 (1.00) |
0.0517 (1.00) |
0.0704 (1.00) |
|
| Del Peak 2(2p11 2) | 0 (0%) | 101 |
0.359 (1.00) |
0.72 (1.00) |
1 (1.00) |
1 (1.00) |
0.725 (1.00) |
0.565 (1.00) |
||
| Del Peak 3(2q37 3) | 0 (0%) | 99 |
0.648 (1.00) |
0.335 (1.00) |
0.327 (1.00) |
0.316 (1.00) |
0.823 (1.00) |
0.0293 (1.00) |
||
| Del Peak 5(4q33) | 0 (0%) | 91 |
0.185 (1.00) |
0.393 (1.00) |
0.345 (1.00) |
0.102 (1.00) |
0.179 (1.00) |
0.114 (1.00) |
||
| Del Peak 7(5q15) | 0 (0%) | 96 |
0.606 (1.00) |
0.0544 (1.00) |
0.433 (1.00) |
0.126 (1.00) |
0.136 (1.00) |
0.158 (1.00) |
||
| Del Peak 8(5q35 2) | 0 (0%) | 96 |
0.606 (1.00) |
0.114 (1.00) |
0.433 (1.00) |
0.304 (1.00) |
0.136 (1.00) |
0.0455 (1.00) |
||
| Del Peak 9(6p12 3) | 0 (0%) | 93 |
0.273 (1.00) |
0.724 (1.00) |
0.747 (1.00) |
0.248 (1.00) |
0.849 (1.00) |
0.181 (1.00) |
0.0739 (1.00) |
|
| Del Peak 10(6q22 31) | 0 (0%) | 92 |
0.0423 (1.00) |
0.903 (1.00) |
0.0553 (1.00) |
0.383 (1.00) |
0.545 (1.00) |
0.352 (1.00) |
0.176 (1.00) |
|
| Del Peak 11(6q26) | 0 (0%) | 92 |
0.273 (1.00) |
0.808 (1.00) |
0.0553 (1.00) |
0.383 (1.00) |
0.741 (1.00) |
0.281 (1.00) |
0.141 (1.00) |
|
| Del Peak 12(9p21 3) | 0 (0%) | 87 |
0.00809 (1.00) |
0.291 (1.00) |
0.0214 (1.00) |
0.398 (1.00) |
0.0309 (1.00) |
0.0046 (0.971) |
0.00546 (1.00) |
|
| Del Peak 13(10p15 3) | 0 (0%) | 99 |
0.369 (1.00) |
0.648 (1.00) |
0.661 (1.00) |
0.145 (1.00) |
0.197 (1.00) |
0.446 (1.00) |
||
| Del Peak 14(11q22 3) | 0 (0%) | 93 |
0.00125 (0.266) |
0.0205 (1.00) |
1 (1.00) |
0.153 (1.00) |
0.419 (1.00) |
0.00963 (1.00) |
||
| Del Peak 16(14q11 2) | 0 (0%) | 80 |
0.281 (1.00) |
0.989 (1.00) |
0.623 (1.00) |
0.445 (1.00) |
0.135 (1.00) |
0.138 (1.00) |
0.125 (1.00) |
|
| Del Peak 17(14q23 3) | 0 (0%) | 81 |
0.26 (1.00) |
0.359 (1.00) |
0.461 (1.00) |
0.377 (1.00) |
0.0629 (1.00) |
0.0284 (1.00) |
0.0906 (1.00) |
|
| Del Peak 18(14q32 2) | 0 (0%) | 81 |
0.26 (1.00) |
0.327 (1.00) |
0.806 (1.00) |
0.377 (1.00) |
0.0322 (1.00) |
0.0284 (1.00) |
0.0989 (1.00) |
|
| Del Peak 19(15q14) | 0 (0%) | 90 |
0.00621 (1.00) |
0.107 (1.00) |
1 (1.00) |
0.354 (1.00) |
0.0311 (1.00) |
0.00295 (0.626) |
0.0183 (1.00) |
|
| Del Peak 20(19p13 3) | 0 (0%) | 96 |
0.124 (1.00) |
0.82 (1.00) |
0.714 (1.00) |
0.397 (1.00) |
0.482 (1.00) |
0.898 (1.00) |
0.255 (1.00) |
|
| Del Peak 21(19q13 2) | 0 (0%) | 97 |
0.258 (1.00) |
0.478 (1.00) |
1 (1.00) |
1 (1.00) |
0.44 (1.00) |
0.0474 (1.00) |
||
| Del Peak 22(19q13 42) | 0 (0%) | 96 |
0.388 (1.00) |
0.61 (1.00) |
1 (1.00) |
1 (1.00) |
0.596 (1.00) |
0.408 (1.00) |
||
| Del Peak 23(22q12 2) | 0 (0%) | 75 |
0.719 (1.00) |
0.618 (1.00) |
0.11 (1.00) |
0.445 (1.00) |
0.264 (1.00) |
0.178 (1.00) |
0.0165 (1.00) |
P value = 0.00101 (Fisher's exact test), Q value = 0.22
Table S1. Gene #6: 'Amp Peak 6(7q22.1)' versus Clinical Feature #8: 'NEOPLASM.DISEASESTAGE'
| nPatients | STAGE I | STAGE II | STAGE III | STAGE IV |
|---|---|---|---|---|
| ALL | 53 | 7 | 24 | 9 |
| AMP PEAK 6(7Q22.1) CNV | 37 | 2 | 6 | 5 |
| AMP PEAK 6(7Q22.1) WILD-TYPE | 16 | 5 | 18 | 4 |
Figure S1. Get High-res Image Gene #6: 'Amp Peak 6(7q22.1)' versus Clinical Feature #8: 'NEOPLASM.DISEASESTAGE'
P value = 0.000216 (Fisher's exact test), Q value = 0.047
Table S2. Gene #13: 'Del Peak 4(3p22.1)' versus Clinical Feature #6: 'LYMPH.NODE.METASTASIS'
| nPatients | N0 | N1 | N2 | NX |
|---|---|---|---|---|
| ALL | 20 | 12 | 4 | 68 |
| DEL PEAK 4(3P22.1) CNV | 3 | 4 | 0 | 0 |
| DEL PEAK 4(3P22.1) WILD-TYPE | 17 | 8 | 4 | 68 |
Figure S2. Get High-res Image Gene #13: 'Del Peak 4(3p22.1)' versus Clinical Feature #6: 'LYMPH.NODE.METASTASIS'
P value = 0.000193 (logrank test), Q value = 0.042
Table S3. Gene #15: 'Del Peak 6(5p15.2)' versus Clinical Feature #1: 'Time to Death'
| nPatients | nDeath | Duration Range (Median), Month | |
|---|---|---|---|
| ALL | 97 | 14 | 0.0 - 182.7 (13.7) |
| DEL PEAK 6(5P15.2) CNV | 5 | 2 | 0.0 - 22.9 (3.7) |
| DEL PEAK 6(5P15.2) WILD-TYPE | 92 | 12 | 0.0 - 182.7 (14.4) |
Figure S3. Get High-res Image Gene #15: 'Del Peak 6(5p15.2)' versus Clinical Feature #1: 'Time to Death'

P value = 0.000239 (logrank test), Q value = 0.051
Table S4. Gene #32: 'Del Peak 24(Xq21.31)' versus Clinical Feature #1: 'Time to Death'
| nPatients | nDeath | Duration Range (Median), Month | |
|---|---|---|---|
| ALL | 97 | 14 | 0.0 - 182.7 (13.7) |
| DEL PEAK 24(XQ21.31) CNV | 15 | 5 | 0.0 - 79.8 (9.6) |
| DEL PEAK 24(XQ21.31) WILD-TYPE | 82 | 9 | 0.0 - 182.7 (15.1) |
Figure S4. Get High-res Image Gene #32: 'Del Peak 24(Xq21.31)' versus Clinical Feature #1: 'Time to Death'
P value = 0.000154 (logrank test), Q value = 0.034
Table S5. Gene #33: 'Del Peak 25(Xq28)' versus Clinical Feature #1: 'Time to Death'
| nPatients | nDeath | Duration Range (Median), Month | |
|---|---|---|---|
| ALL | 97 | 14 | 0.0 - 182.7 (13.7) |
| DEL PEAK 25(XQ28) CNV | 14 | 4 | 0.0 - 22.9 (10.3) |
| DEL PEAK 25(XQ28) WILD-TYPE | 83 | 10 | 0.0 - 182.7 (15.5) |
Figure S5. Get High-res Image Gene #33: 'Del Peak 25(Xq28)' versus Clinical Feature #1: 'Time to Death'
-
Mutation data file = all_lesions.conf_99.cnv.cluster.txt
-
Clinical data file = KIRP-TP.clin.merged.picked.txt
-
Number of patients = 104
-
Number of significantly arm-level cnvs = 33
-
Number of selected clinical features = 8
-
Exclude genes that fewer than K tumors have mutations, K = 3
For survival clinical features, the Kaplan-Meier survival curves of tumors with and without gene mutations were plotted and the statistical significance P values were estimated by logrank test (Bland and Altman 2004) using the 'survdiff' function in R
For continuous numerical clinical features, two-tailed Student's t test with unequal variance (Lehmann and Romano 2005) was applied to compare the clinical values between tumors with and without gene mutations using 't.test' function in R
For binary or multi-class clinical features (nominal or ordinal), two-tailed Fisher's exact tests (Fisher 1922) were used to estimate the P values using the 'fisher.test' function in R
For multiple hypothesis correction, Q value is the False Discovery Rate (FDR) analogue of the P value (Benjamini and Hochberg 1995), defined as the minimum FDR at which the test may be called significant. We used the 'Benjamini and Hochberg' method of 'p.adjust' function in R to convert P values into Q values.
This is an experimental feature. The full results of the analysis summarized in this report can be downloaded from the TCGA Data Coordination Center.