This pipeline uses various statistical tests to identify genes whose promoter methylation levels correlated to selected clinical features.
Testing the association between 20125 genes and 7 clinical features across 85 samples, statistically thresholded by Q value < 0.05, 6 clinical features related to at least one genes.
-
41 genes correlated to 'Time to Death'.
-
SYT2 , MMP25 , TSLP , TMEM132E__1 , ALKBH6 , ...
-
2 genes correlated to 'AGE'.
-
ACOT8 , SNX21__1
-
5 genes correlated to 'GENDER'.
-
ATAD5 , CCNYL1 , NARFL , HNRNPD , PRKRIR
-
104 genes correlated to 'DISTANT.METASTASIS'.
-
ERCC2 , NFE2L1 , PCDHA1__8 , PCDHA10__5 , PCDHA11__3 , ...
-
234 genes correlated to 'LYMPH.NODE.METASTASIS'.
-
TMEM132B , C5ORF39 , LOC153684 , DUS3L , HES2 , ...
-
119 genes correlated to 'NEOPLASM.DISEASESTAGE'.
-
DLX6AS__1 , ZNF177 , GPR150 , INSM1 , NSD1 , ...
-
No genes correlated to 'KARNOFSKY.PERFORMANCE.SCORE'
Complete statistical result table is provided in Supplement Table 1
Table 1. Get Full Table This table shows the clinical features, statistical methods used, and the number of genes that are significantly associated with each clinical feature at Q value < 0.05.
| Clinical feature | Statistical test | Significant genes | Associated with | Associated with | ||
|---|---|---|---|---|---|---|
| Time to Death | Cox regression test | N=41 | shorter survival | N=40 | longer survival | N=1 |
| AGE | Spearman correlation test | N=2 | older | N=0 | younger | N=2 |
| GENDER | t test | N=5 | male | N=3 | female | N=2 |
| KARNOFSKY PERFORMANCE SCORE | Spearman correlation test | N=0 | ||||
| DISTANT METASTASIS | ANOVA test | N=104 | ||||
| LYMPH NODE METASTASIS | ANOVA test | N=234 | ||||
| NEOPLASM DISEASESTAGE | ANOVA test | N=119 |
Table S1. Basic characteristics of clinical feature: 'Time to Death'
| Time to Death | Duration (Months) | 0-182.7 (median=15.1) |
| censored | N = 66 | |
| death | N = 12 | |
| Significant markers | N = 41 | |
| associated with shorter survival | 40 | |
| associated with longer survival | 1 |
Table S2. Get Full Table List of top 10 genes significantly associated with 'Time to Death' by Cox regression test
| HazardRatio | Wald_P | Q | C_index | |
|---|---|---|---|---|
| SYT2 | 6201 | 2.382e-07 | 0.0048 | 0.834 |
| MMP25 | 1001 | 3.001e-07 | 0.006 | 0.754 |
| TSLP | 150001 | 3.756e-07 | 0.0076 | 0.622 |
| TMEM132E__1 | 47001 | 4.405e-07 | 0.0089 | 0.724 |
| ALKBH6 | 261 | 8.546e-07 | 0.017 | 0.673 |
| C19ORF46__1 | 261 | 8.546e-07 | 0.017 | 0.673 |
| NPR1 | 1501 | 8.971e-07 | 0.018 | 0.812 |
| VWA2 | 661 | 9.179e-07 | 0.018 | 0.829 |
| NT5DC2__1 | 1901 | 9.906e-07 | 0.02 | 0.79 |
| ELOVL5 | 0 | 1.063e-06 | 0.021 | 0.124 |
Figure S1. Get High-res Image As an example, this figure shows the association of SYT2 to 'Time to Death'. four curves present the cumulative survival rates of 4 quartile subsets of patients. P value = 2.38e-07 with univariate Cox regression analysis using continuous log-2 expression values.
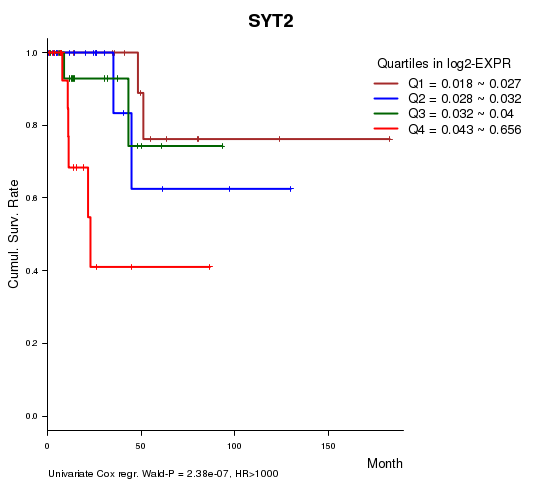
Table S3. Basic characteristics of clinical feature: 'AGE'
| AGE | Mean (SD) | 59.87 (13) |
| Significant markers | N = 2 | |
| pos. correlated | 0 | |
| neg. correlated | 2 |
Table S4. Get Full Table List of 2 genes significantly correlated to 'AGE' by Spearman correlation test
| SpearmanCorr | corrP | Q | |
|---|---|---|---|
| ACOT8 | -0.5094 | 1.02e-06 | 0.0205 |
| SNX21__1 | -0.5094 | 1.02e-06 | 0.0205 |
Figure S2. Get High-res Image As an example, this figure shows the association of ACOT8 to 'AGE'. P value = 1.02e-06 with Spearman correlation analysis. The straight line presents the best linear regression.
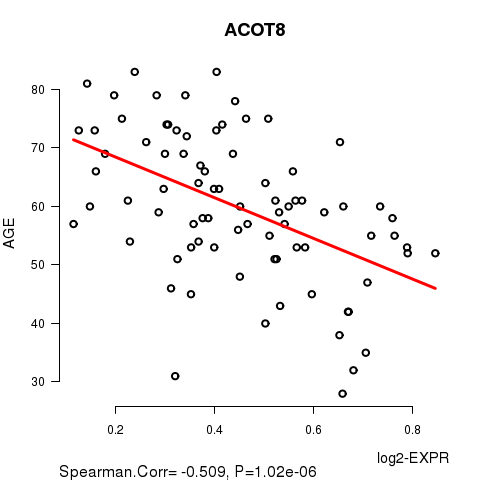
Table S5. Basic characteristics of clinical feature: 'GENDER'
| GENDER | Labels | N |
| FEMALE | 28 | |
| MALE | 57 | |
| Significant markers | N = 5 | |
| Higher in MALE | 3 | |
| Higher in FEMALE | 2 |
Table S6. Get Full Table List of 5 genes differentially expressed by 'GENDER'
| T(pos if higher in 'MALE') | ttestP | Q | AUC | |
|---|---|---|---|---|
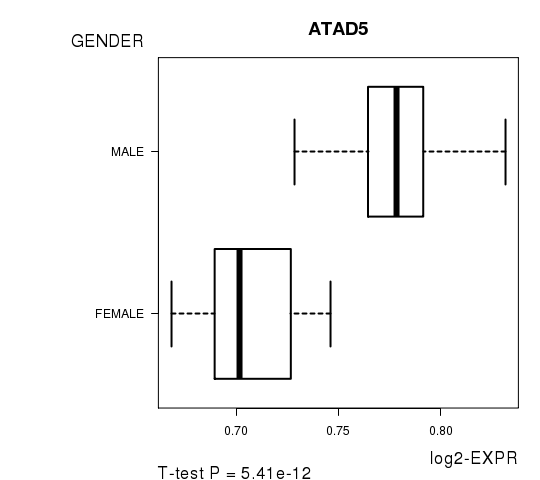
| ATAD5 | 9.29 | 5.413e-12 | 1.09e-07 | 0.9217 |
| CCNYL1 | -9.05 | 4.003e-11 | 8.06e-07 | 0.9229 |
| NARFL | -6.73 | 2.259e-09 | 4.55e-05 | 0.8158 |
| HNRNPD | 7.49 | 6.551e-09 | 0.000132 | 0.9016 |
| PRKRIR | 6.8 | 4.631e-08 | 0.000932 | 0.9117 |
Figure S3. Get High-res Image As an example, this figure shows the association of ATAD5 to 'GENDER'. P value = 5.41e-12 with T-test analysis.
No gene related to 'KARNOFSKY.PERFORMANCE.SCORE'.
Table S7. Basic characteristics of clinical feature: 'KARNOFSKY.PERFORMANCE.SCORE'
| KARNOFSKY.PERFORMANCE.SCORE | Mean (SD) | 92 (13) |
| Score | N | |
| 40 | 1 | |
| 90 | 10 | |
| 100 | 9 | |
| Significant markers | N = 0 |
Table S8. Basic characteristics of clinical feature: 'DISTANT.METASTASIS'
| DISTANT.METASTASIS | Labels | N |
| M0 | 45 | |
| M1 | 4 | |
| MX | 34 | |
| Significant markers | N = 104 |
Table S9. Get Full Table List of top 10 genes differentially expressed by 'DISTANT.METASTASIS'
| ANOVA_P | Q | |
|---|---|---|
| ERCC2 | 2.433e-10 | 4.9e-06 |
| NFE2L1 | 6.964e-10 | 1.4e-05 |
| PCDHA1__8 | 2.489e-09 | 5.01e-05 |
| PCDHA10__5 | 2.489e-09 | 5.01e-05 |
| PCDHA11__3 | 2.489e-09 | 5.01e-05 |
| PCDHA12__3 | 2.489e-09 | 5.01e-05 |
| PCDHA13__2 | 2.489e-09 | 5.01e-05 |
| PCDHA2__8 | 2.489e-09 | 5.01e-05 |
| PCDHA3__7 | 2.489e-09 | 5.01e-05 |
| PCDHA4__6 | 2.489e-09 | 5.01e-05 |
Figure S4. Get High-res Image As an example, this figure shows the association of ERCC2 to 'DISTANT.METASTASIS'. P value = 2.43e-10 with ANOVA analysis.

Table S10. Basic characteristics of clinical feature: 'LYMPH.NODE.METASTASIS'
| LYMPH.NODE.METASTASIS | Labels | N |
| N0 | 20 | |
| N1 | 10 | |
| N2 | 4 | |
| NX | 51 | |
| Significant markers | N = 234 |
Table S11. Get Full Table List of top 10 genes differentially expressed by 'LYMPH.NODE.METASTASIS'
| ANOVA_P | Q | |
|---|---|---|
| TMEM132B | 5.476e-12 | 1.1e-07 |
| C5ORF39 | 5.779e-11 | 1.16e-06 |
| LOC153684 | 5.779e-11 | 1.16e-06 |
| DUS3L | 1.105e-10 | 2.22e-06 |
| HES2 | 3.96e-10 | 7.97e-06 |
| ZNF844 | 6.358e-10 | 1.28e-05 |
| STX8__1 | 1.162e-09 | 2.34e-05 |
| WDR16 | 1.162e-09 | 2.34e-05 |
| ZNF177 | 1.315e-09 | 2.64e-05 |
| NR2E1 | 1.639e-09 | 3.3e-05 |
Figure S5. Get High-res Image As an example, this figure shows the association of TMEM132B to 'LYMPH.NODE.METASTASIS'. P value = 5.48e-12 with ANOVA analysis.

Table S12. Basic characteristics of clinical feature: 'NEOPLASM.DISEASESTAGE'
| NEOPLASM.DISEASESTAGE | Labels | N |
| STAGE I | 47 | |
| STAGE II | 5 | |
| STAGE III | 23 | |
| STAGE IV | 8 | |
| Significant markers | N = 119 |
Table S13. Get Full Table List of top 10 genes differentially expressed by 'NEOPLASM.DISEASESTAGE'
| ANOVA_P | Q | |
|---|---|---|
| DLX6AS__1 | 3.395e-11 | 6.83e-07 |
| ZNF177 | 5.437e-10 | 1.09e-05 |
| GPR150 | 8.27e-10 | 1.66e-05 |
| INSM1 | 2.648e-09 | 5.33e-05 |
| NSD1 | 3.101e-09 | 6.24e-05 |
| C2ORF55 | 3.185e-09 | 6.41e-05 |
| NRN1 | 5.148e-09 | 0.000104 |
| DIO3 | 6.111e-09 | 0.000123 |
| DLEU2 | 1.087e-08 | 0.000219 |
| TMEM132B | 1.166e-08 | 0.000235 |
Figure S6. Get High-res Image As an example, this figure shows the association of DLX6AS__1 to 'NEOPLASM.DISEASESTAGE'. P value = 3.4e-11 with ANOVA analysis.

-
Expresson data file = KIRP-TP.meth.by_min_expr_corr.data.txt
-
Clinical data file = KIRP-TP.clin.merged.picked.txt
-
Number of patients = 85
-
Number of genes = 20125
-
Number of clinical features = 7
For survival clinical features, Wald's test in univariate Cox regression analysis with proportional hazards model (Andersen and Gill 1982) was used to estimate the P values using the 'coxph' function in R. Kaplan-Meier survival curves were plot using the four quartile subgroups of patients based on expression levels
For continuous numerical clinical features, Spearman's rank correlation coefficients (Spearman 1904) and two-tailed P values were estimated using 'cor.test' function in R
For two-class clinical features, two-tailed Student's t test with unequal variance (Lehmann and Romano 2005) was applied to compare the log2-expression levels between the two clinical classes using 't.test' function in R
For multi-class clinical features (ordinal or nominal), one-way analysis of variance (Howell 2002) was applied to compare the log2-expression levels between different clinical classes using 'anova' function in R
For multiple hypothesis correction, Q value is the False Discovery Rate (FDR) analogue of the P value (Benjamini and Hochberg 1995), defined as the minimum FDR at which the test may be called significant. We used the 'Benjamini and Hochberg' method of 'p.adjust' function in R to convert P values into Q values.
This is an experimental feature. The full results of the analysis summarized in this report can be downloaded from the TCGA Data Coordination Center.