This pipeline uses various statistical tests to identify miRs whose expression levels correlated to selected clinical features.
Testing the association between 493 genes and 7 clinical features across 104 samples, statistically thresholded by Q value < 0.05, 5 clinical features related to at least one genes.
-
2 genes correlated to 'Time to Death'.
-
HSA-MIR-141 , HSA-MIR-200C
-
1 gene correlated to 'GENDER'.
-
HSA-MIR-3173
-
7 genes correlated to 'DISTANT.METASTASIS'.
-
HSA-MIR-3607 , HSA-MIR-3647 , HSA-MIR-1245 , HSA-MIR-3653 , HSA-MIR-26A-1 , ...
-
6 genes correlated to 'LYMPH.NODE.METASTASIS'.
-
HSA-MIR-200B , HSA-MIR-224 , HSA-MIR-452 , HSA-MIR-200A , HSA-MIR-217 , ...
-
5 genes correlated to 'NEOPLASM.DISEASESTAGE'.
-
HSA-MIR-224 , HSA-MIR-452 , HSA-MIR-200B , HSA-MIR-92A-1 , HSA-MIR-200A
-
No genes correlated to 'AGE', and 'KARNOFSKY.PERFORMANCE.SCORE'.
Complete statistical result table is provided in Supplement Table 1
Table 1. Get Full Table This table shows the clinical features, statistical methods used, and the number of genes that are significantly associated with each clinical feature at Q value < 0.05.
| Clinical feature | Statistical test | Significant genes | Associated with | Associated with | ||
|---|---|---|---|---|---|---|
| Time to Death | Cox regression test | N=2 | shorter survival | N=2 | longer survival | N=0 |
| AGE | Spearman correlation test | N=0 | ||||
| GENDER | t test | N=1 | male | N=1 | female | N=0 |
| KARNOFSKY PERFORMANCE SCORE | Spearman correlation test | N=0 | ||||
| DISTANT METASTASIS | ANOVA test | N=7 | ||||
| LYMPH NODE METASTASIS | ANOVA test | N=6 | ||||
| NEOPLASM DISEASESTAGE | ANOVA test | N=5 |
Table S1. Basic characteristics of clinical feature: 'Time to Death'
| Time to Death | Duration (Months) | 0-182.7 (median=13.7) |
| censored | N = 83 | |
| death | N = 14 | |
| Significant markers | N = 2 | |
| associated with shorter survival | 2 | |
| associated with longer survival | 0 |
Table S2. Get Full Table List of 2 genes significantly associated with 'Time to Death' by Cox regression test
| HazardRatio | Wald_P | Q | C_index | |
|---|---|---|---|---|
| HSA-MIR-141 | 1.66 | 1.398e-05 | 0.0069 | 0.776 |
| HSA-MIR-200C | 1.56 | 3.357e-05 | 0.017 | 0.745 |
Figure S1. Get High-res Image As an example, this figure shows the association of HSA-MIR-141 to 'Time to Death'. four curves present the cumulative survival rates of 4 quartile subsets of patients. P value = 1.4e-05 with univariate Cox regression analysis using continuous log-2 expression values.
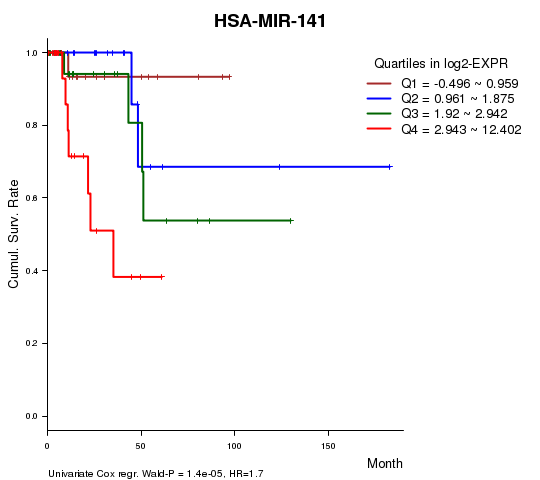
Table S3. Basic characteristics of clinical feature: 'AGE'
| AGE | Mean (SD) | 59.64 (12) |
| Significant markers | N = 0 |
Table S4. Basic characteristics of clinical feature: 'GENDER'
| GENDER | Labels | N |
| FEMALE | 34 | |
| MALE | 70 | |
| Significant markers | N = 1 | |
| Higher in MALE | 1 | |
| Higher in FEMALE | 0 |
Table S5. Get Full Table List of one gene differentially expressed by 'GENDER'
| T(pos if higher in 'MALE') | ttestP | Q | AUC | |
|---|---|---|---|---|
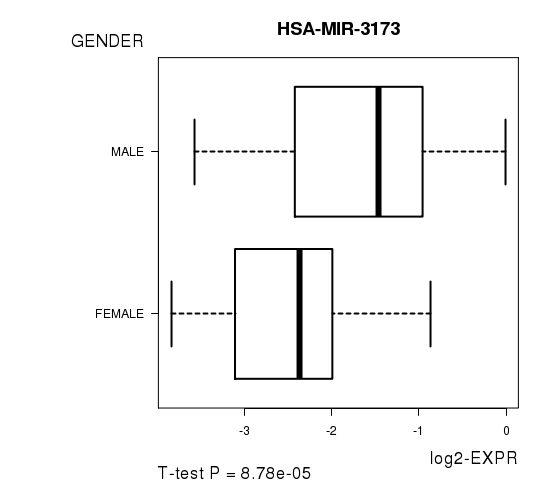
| HSA-MIR-3173 | 4.24 | 8.781e-05 | 0.0433 | 0.7756 |
Figure S2. Get High-res Image As an example, this figure shows the association of HSA-MIR-3173 to 'GENDER'. P value = 8.78e-05 with T-test analysis.
No gene related to 'KARNOFSKY.PERFORMANCE.SCORE'.
Table S6. Basic characteristics of clinical feature: 'KARNOFSKY.PERFORMANCE.SCORE'
| KARNOFSKY.PERFORMANCE.SCORE | Mean (SD) | 87.73 (23) |
| Score | N | |
| 0 | 1 | |
| 40 | 1 | |
| 90 | 11 | |
| 100 | 9 | |
| Significant markers | N = 0 |
Table S7. Basic characteristics of clinical feature: 'DISTANT.METASTASIS'
| DISTANT.METASTASIS | Labels | N |
| M0 | 55 | |
| M1 | 5 | |
| MX | 36 | |
| Significant markers | N = 7 |
Table S8. Get Full Table List of 7 genes differentially expressed by 'DISTANT.METASTASIS'
| ANOVA_P | Q | |
|---|---|---|
| HSA-MIR-3607 | 7.251e-08 | 3.57e-05 |
| HSA-MIR-3647 | 9.616e-08 | 4.73e-05 |
| HSA-MIR-1245 | 2.738e-05 | 0.0134 |
| HSA-MIR-3653 | 3.219e-05 | 0.0158 |
| HSA-MIR-26A-1 | 3.479e-05 | 0.017 |
| HSA-MIR-126 | 7.638e-05 | 0.0373 |
| HSA-MIR-1248 | 9.26e-05 | 0.0451 |
Figure S3. Get High-res Image As an example, this figure shows the association of HSA-MIR-3607 to 'DISTANT.METASTASIS'. P value = 7.25e-08 with ANOVA analysis.
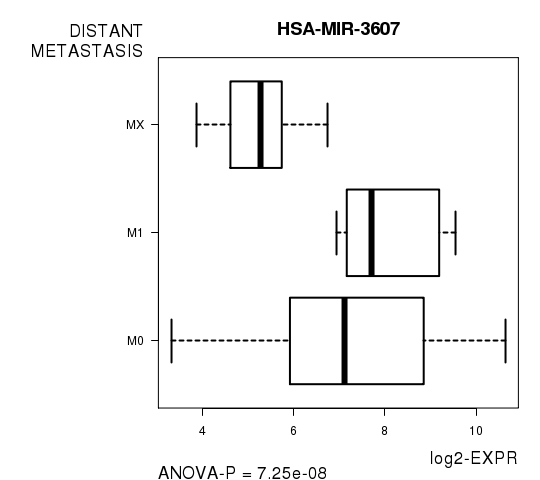
Table S9. Basic characteristics of clinical feature: 'LYMPH.NODE.METASTASIS'
| LYMPH.NODE.METASTASIS | Labels | N |
| N0 | 20 | |
| N1 | 12 | |
| N2 | 4 | |
| NX | 68 | |
| Significant markers | N = 6 |
Table S10. Get Full Table List of 6 genes differentially expressed by 'LYMPH.NODE.METASTASIS'
| ANOVA_P | Q | |
|---|---|---|
| HSA-MIR-200B | 6.946e-07 | 0.000342 |
| HSA-MIR-224 | 1.473e-06 | 0.000725 |
| HSA-MIR-452 | 1.781e-06 | 0.000874 |
| HSA-MIR-200A | 6.894e-06 | 0.00338 |
| HSA-MIR-217 | 3.341e-05 | 0.0163 |
| HSA-MIR-421 | 9.449e-05 | 0.0461 |
Figure S4. Get High-res Image As an example, this figure shows the association of HSA-MIR-200B to 'LYMPH.NODE.METASTASIS'. P value = 6.95e-07 with ANOVA analysis.
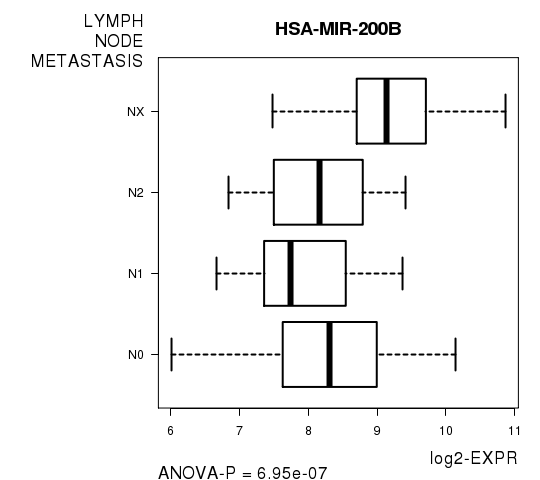
Table S11. Basic characteristics of clinical feature: 'NEOPLASM.DISEASESTAGE'
| NEOPLASM.DISEASESTAGE | Labels | N |
| STAGE I | 53 | |
| STAGE II | 7 | |
| STAGE III | 24 | |
| STAGE IV | 9 | |
| Significant markers | N = 5 |
Table S12. Get Full Table List of 5 genes differentially expressed by 'NEOPLASM.DISEASESTAGE'
| ANOVA_P | Q | |
|---|---|---|
| HSA-MIR-224 | 2.664e-06 | 0.00131 |
| HSA-MIR-452 | 1.903e-05 | 0.00936 |
| HSA-MIR-200B | 2.832e-05 | 0.0139 |
| HSA-MIR-92A-1 | 4.656e-05 | 0.0228 |
| HSA-MIR-200A | 9.274e-05 | 0.0453 |
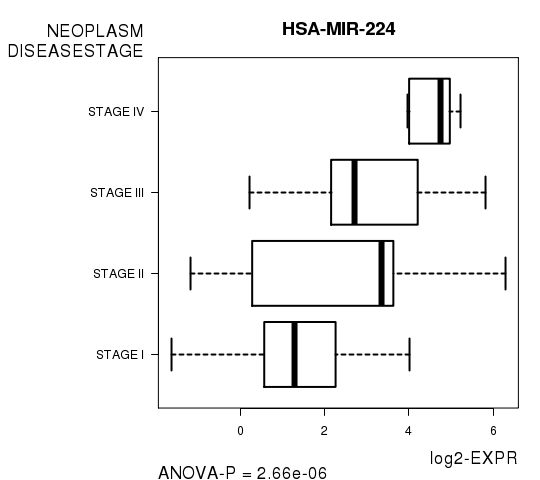
Figure S5. Get High-res Image As an example, this figure shows the association of HSA-MIR-224 to 'NEOPLASM.DISEASESTAGE'. P value = 2.66e-06 with ANOVA analysis.
-
Expresson data file = KIRP-TP.miRseq_RPKM_log2.txt
-
Clinical data file = KIRP-TP.clin.merged.picked.txt
-
Number of patients = 104
-
Number of genes = 493
-
Number of clinical features = 7
For survival clinical features, Wald's test in univariate Cox regression analysis with proportional hazards model (Andersen and Gill 1982) was used to estimate the P values using the 'coxph' function in R. Kaplan-Meier survival curves were plot using the four quartile subgroups of patients based on expression levels
For continuous numerical clinical features, Spearman's rank correlation coefficients (Spearman 1904) and two-tailed P values were estimated using 'cor.test' function in R
For two-class clinical features, two-tailed Student's t test with unequal variance (Lehmann and Romano 2005) was applied to compare the log2-expression levels between the two clinical classes using 't.test' function in R
For multi-class clinical features (ordinal or nominal), one-way analysis of variance (Howell 2002) was applied to compare the log2-expression levels between different clinical classes using 'anova' function in R
For multiple hypothesis correction, Q value is the False Discovery Rate (FDR) analogue of the P value (Benjamini and Hochberg 1995), defined as the minimum FDR at which the test may be called significant. We used the 'Benjamini and Hochberg' method of 'p.adjust' function in R to convert P values into Q values.
This is an experimental feature. The full results of the analysis summarized in this report can be downloaded from the TCGA Data Coordination Center.