This pipeline computes the correlation between significant arm-level copy number variations (cnvs) and selected clinical features.
Testing the association between copy number variation 22 arm-level results and 3 clinical features across 191 patients, 4 significant findings detected with Q value < 0.25.
-
5q loss cnv correlated to 'Time to Death'.
-
7q loss cnv correlated to 'Time to Death'.
-
18p loss cnv correlated to 'Time to Death'.
-
18q loss cnv correlated to 'Time to Death'.
Table 1. Get Full Table Overview of the association between significant copy number variation of 22 arm-level results and 3 clinical features. Shown in the table are P values (Q values). Thresholded by Q value < 0.25, 4 significant findings detected.
|
Clinical Features |
Time to Death |
AGE | GENDER | ||
| nCNV (%) | nWild-Type | logrank test | t-test | Fisher's exact test | |
| 5q loss | 0 (0%) | 185 |
0.00073 (0.0438) |
0.0601 (1.00) |
0.0325 (1.00) |
| 7q loss | 0 (0%) | 173 |
0.00315 (0.183) |
0.325 (1.00) |
0.805 (1.00) |
| 18p loss | 0 (0%) | 186 |
0.00202 (0.119) |
0.355 (1.00) |
0.0642 (1.00) |
| 18q loss | 0 (0%) | 188 |
0.000113 (0.00689) |
0.0297 (1.00) |
0.252 (1.00) |
| 1p gain | 0 (0%) | 188 |
0.0913 (1.00) |
0.592 (1.00) |
|
| 4p gain | 0 (0%) | 187 |
0.587 (1.00) |
0.425 (1.00) |
0.627 (1.00) |
| 4q gain | 0 (0%) | 187 |
0.587 (1.00) |
0.425 (1.00) |
0.627 (1.00) |
| 8p gain | 0 (0%) | 171 |
0.48 (1.00) |
0.119 (1.00) |
0.0597 (1.00) |
| 8q gain | 0 (0%) | 170 |
0.529 (1.00) |
0.168 (1.00) |
0.0382 (1.00) |
| 10q gain | 0 (0%) | 188 |
0.947 (1.00) |
0.252 (1.00) |
|
| 11p gain | 0 (0%) | 187 |
0.188 (1.00) |
1 (1.00) |
|
| 11q gain | 0 (0%) | 184 |
0.57 (1.00) |
0.0154 (0.834) |
1 (1.00) |
| 13q gain | 0 (0%) | 188 |
0.511 (1.00) |
0.592 (1.00) |
|
| 17q gain | 0 (0%) | 188 |
0.729 (1.00) |
0.29 (1.00) |
1 (1.00) |
| 19p gain | 0 (0%) | 186 |
0.347 (1.00) |
0.789 (1.00) |
0.0642 (1.00) |
| 19q gain | 0 (0%) | 186 |
0.347 (1.00) |
0.789 (1.00) |
0.0642 (1.00) |
| 21q gain | 0 (0%) | 183 |
0.0186 (0.966) |
0.616 (1.00) |
0.0732 (1.00) |
| 22q gain | 0 (0%) | 183 |
0.887 (1.00) |
0.00598 (0.341) |
0.73 (1.00) |
| 7p loss | 0 (0%) | 176 |
0.00716 (0.401) |
0.325 (1.00) |
1 (1.00) |
| 12p loss | 0 (0%) | 188 |
0.514 (1.00) |
1 (1.00) |
|
| 17p loss | 0 (0%) | 181 |
0.376 (1.00) |
0.308 (1.00) |
0.114 (1.00) |
| 17q loss | 0 (0%) | 186 |
0.0166 (0.882) |
0.0075 (0.412) |
0.378 (1.00) |
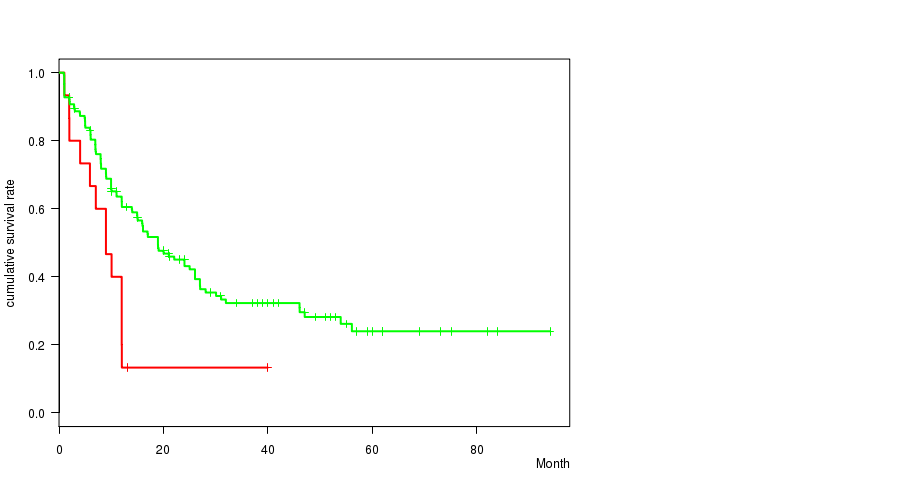
P value = 0.00073 (logrank test), Q value = 0.044
Table S1. Gene #15: '5q loss' versus Clinical Feature #1: 'Time to Death'
| nPatients | nDeath | Duration Range (Median), Month | |
|---|---|---|---|
| ALL | 168 | 106 | 0.9 - 94.1 (12.0) |
| 5Q LOSS CNV | 6 | 6 | 1.0 - 12.0 (7.0) |
| 5Q LOSS WILD-TYPE | 162 | 100 | 0.9 - 94.1 (12.5) |
Figure S1. Get High-res Image Gene #15: '5q loss' versus Clinical Feature #1: 'Time to Death'

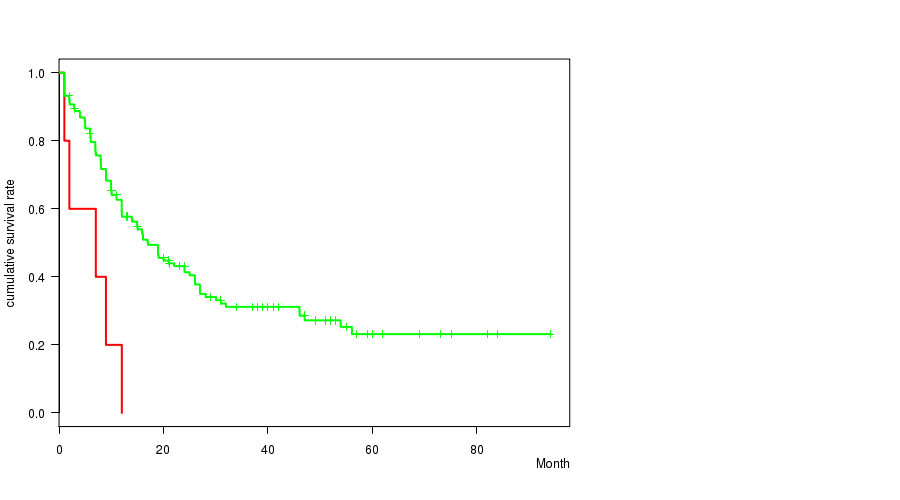
P value = 0.00315 (logrank test), Q value = 0.18
Table S2. Gene #17: '7q loss' versus Clinical Feature #1: 'Time to Death'
| nPatients | nDeath | Duration Range (Median), Month | |
|---|---|---|---|
| ALL | 168 | 106 | 0.9 - 94.1 (12.0) |
| 7Q LOSS CNV | 15 | 13 | 1.0 - 40.0 (9.0) |
| 7Q LOSS WILD-TYPE | 153 | 93 | 0.9 - 94.1 (13.9) |
Figure S2. Get High-res Image Gene #17: '7q loss' versus Clinical Feature #1: 'Time to Death'
P value = 0.00202 (logrank test), Q value = 0.12
Table S3. Gene #21: '18p loss' versus Clinical Feature #1: 'Time to Death'
| nPatients | nDeath | Duration Range (Median), Month | |
|---|---|---|---|
| ALL | 168 | 106 | 0.9 - 94.1 (12.0) |
| 18P LOSS CNV | 5 | 5 | 1.0 - 12.0 (7.0) |
| 18P LOSS WILD-TYPE | 163 | 101 | 0.9 - 94.1 (12.0) |
Figure S3. Get High-res Image Gene #21: '18p loss' versus Clinical Feature #1: 'Time to Death'
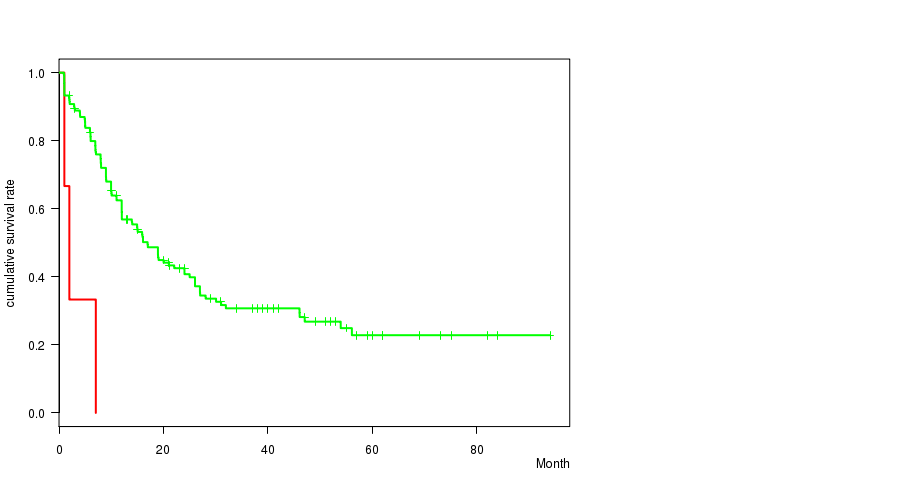
P value = 0.000113 (logrank test), Q value = 0.0069
Table S4. Gene #22: '18q loss' versus Clinical Feature #1: 'Time to Death'
| nPatients | nDeath | Duration Range (Median), Month | |
|---|---|---|---|
| ALL | 168 | 106 | 0.9 - 94.1 (12.0) |
| 18Q LOSS CNV | 3 | 3 | 1.0 - 7.0 (2.0) |
| 18Q LOSS WILD-TYPE | 165 | 103 | 0.9 - 94.1 (12.0) |
Figure S4. Get High-res Image Gene #22: '18q loss' versus Clinical Feature #1: 'Time to Death'
-
Mutation data file = broad_values_by_arm.mutsig.cluster.txt
-
Clinical data file = LAML-TB.clin.merged.picked.txt
-
Number of patients = 191
-
Number of significantly arm-level cnvs = 22
-
Number of selected clinical features = 3
-
Exclude genes that fewer than K tumors have mutations, K = 3
For survival clinical features, the Kaplan-Meier survival curves of tumors with and without gene mutations were plotted and the statistical significance P values were estimated by logrank test (Bland and Altman 2004) using the 'survdiff' function in R
For continuous numerical clinical features, two-tailed Student's t test with unequal variance (Lehmann and Romano 2005) was applied to compare the clinical values between tumors with and without gene mutations using 't.test' function in R
For binary or multi-class clinical features (nominal or ordinal), two-tailed Fisher's exact tests (Fisher 1922) were used to estimate the P values using the 'fisher.test' function in R
For multiple hypothesis correction, Q value is the False Discovery Rate (FDR) analogue of the P value (Benjamini and Hochberg 1995), defined as the minimum FDR at which the test may be called significant. We used the 'Benjamini and Hochberg' method of 'p.adjust' function in R to convert P values into Q values.
This is an experimental feature. The full results of the analysis summarized in this report can be downloaded from the TCGA Data Coordination Center.