This pipeline uses various statistical tests to identify genes whose promoter methylation levels correlated to selected clinical features.
Testing the association between 19042 genes and 3 clinical features across 191 samples, statistically thresholded by Q value < 0.05, 3 clinical features related to at least one genes.
-
2 genes correlated to 'Time to Death'.
-
AGRN , C10ORF128
-
76 genes correlated to 'AGE'.
-
TMEM20 , ANGPTL5 , KIAA1377 , JAKMIP1 , AASS , ...
-
10 genes correlated to 'GENDER'.
-
FAM35A , GLUD1 , AP2B1 , DKFZP434L187 , KIF4B , ...
Complete statistical result table is provided in Supplement Table 1
Table 1. Get Full Table This table shows the clinical features, statistical methods used, and the number of genes that are significantly associated with each clinical feature at Q value < 0.05.
| Clinical feature | Statistical test | Significant genes | Associated with | Associated with | ||
|---|---|---|---|---|---|---|
| Time to Death | Cox regression test | N=2 | shorter survival | N=1 | longer survival | N=1 |
| AGE | Spearman correlation test | N=76 | older | N=17 | younger | N=59 |
| GENDER | t test | N=10 | male | N=5 | female | N=5 |
Table S1. Basic characteristics of clinical feature: 'Time to Death'
| Time to Death | Duration (Months) | 0.9-94.1 (median=12) |
| censored | N = 62 | |
| death | N = 102 | |
| Significant markers | N = 2 | |
| associated with shorter survival | 1 | |
| associated with longer survival | 1 |
Table S2. Get Full Table List of 2 genes significantly associated with 'Time to Death' by Cox regression test
| HazardRatio | Wald_P | Q | C_index | |
|---|---|---|---|---|
| AGRN | 66000001 | 2.987e-08 | 0.00057 | 0.537 |
| C10ORF128 | 0.12 | 1.526e-07 | 0.0029 | 0.369 |
Figure S1. Get High-res Image As an example, this figure shows the association of AGRN to 'Time to Death'. four curves present the cumulative survival rates of 4 quartile subsets of patients. P value = 2.99e-08 with univariate Cox regression analysis using continuous log-2 expression values.
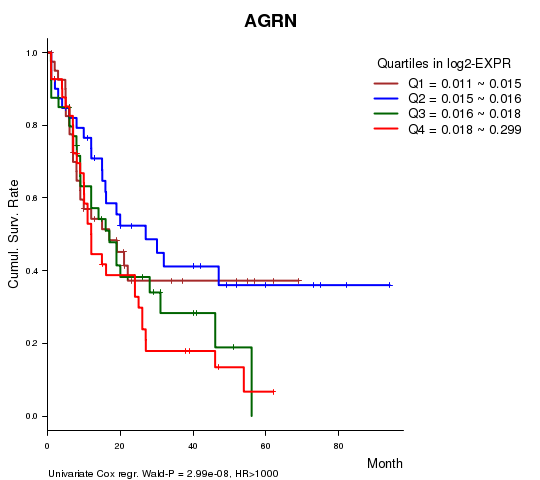
Table S3. Basic characteristics of clinical feature: 'AGE'
| AGE | Mean (SD) | 55.23 (16) |
| Significant markers | N = 76 | |
| pos. correlated | 17 | |
| neg. correlated | 59 |
Table S4. Get Full Table List of top 10 genes significantly correlated to 'AGE' by Spearman correlation test
| SpearmanCorr | corrP | Q | |
|---|---|---|---|
| TMEM20 | -0.4738 | 4.429e-12 | 8.43e-08 |
| ANGPTL5 | -0.441 | 1.719e-10 | 3.27e-06 |
| KIAA1377 | -0.441 | 1.719e-10 | 3.27e-06 |
| JAKMIP1 | -0.4335 | 3.735e-10 | 7.11e-06 |
| AASS | -0.4136 | 2.737e-09 | 5.21e-05 |
| CD96 | 0.3975 | 1.239e-08 | 0.000236 |
| TBC1D12 | -0.3954 | 1.504e-08 | 0.000286 |
| SCN3B | -0.3944 | 1.652e-08 | 0.000315 |
| CAMK2D | -0.3843 | 4.038e-08 | 0.000769 |
| ABCB4 | -0.3843 | 4.052e-08 | 0.000771 |
Figure S2. Get High-res Image As an example, this figure shows the association of TMEM20 to 'AGE'. P value = 4.43e-12 with Spearman correlation analysis. The straight line presents the best linear regression.
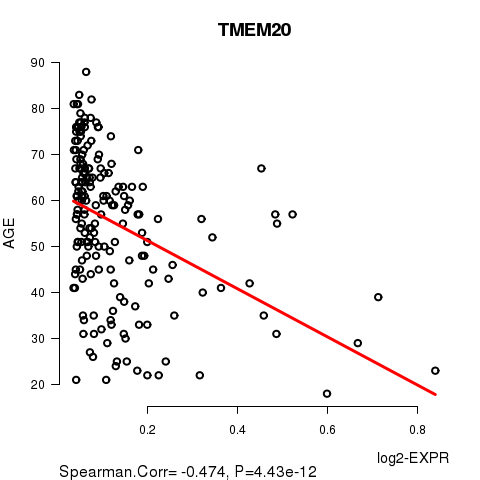
Table S5. Basic characteristics of clinical feature: 'GENDER'
| GENDER | Labels | N |
| FEMALE | 88 | |
| MALE | 103 | |
| Significant markers | N = 10 | |
| Higher in MALE | 5 | |
| Higher in FEMALE | 5 |
Table S6. Get Full Table List of 10 genes differentially expressed by 'GENDER'
| T(pos if higher in 'MALE') | ttestP | Q | AUC | |
|---|---|---|---|---|
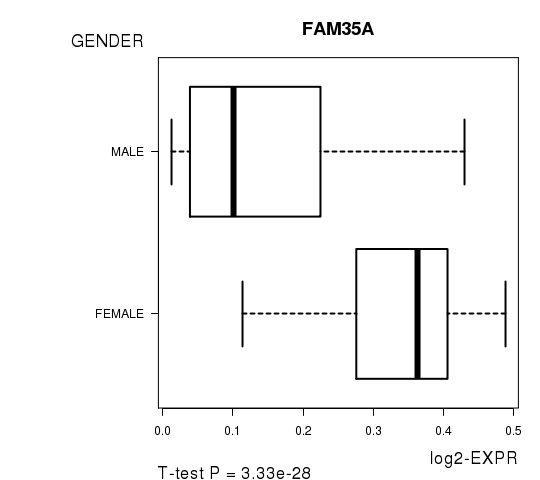
| FAM35A | -13.12 | 3.328e-28 | 6.34e-24 | 0.894 |
| GLUD1 | -13.12 | 3.328e-28 | 6.34e-24 | 0.894 |
| AP2B1 | -12.67 | 2.899e-26 | 5.52e-22 | 0.8994 |
| DKFZP434L187 | 12.48 | 3.728e-26 | 7.1e-22 | 0.9379 |
| KIF4B | -11.88 | 1.296e-23 | 2.47e-19 | 0.865 |
| CROCC | -10.49 | 2.034e-20 | 3.87e-16 | 0.8828 |
| LOC389791__1 | 5.54 | 1.026e-07 | 0.00195 | 0.7112 |
| PTGES2__1 | 5.54 | 1.026e-07 | 0.00195 | 0.7112 |
| ATP5J | 5.25 | 4.392e-07 | 0.00836 | 0.7381 |
| GABPA__1 | 5.25 | 4.392e-07 | 0.00836 | 0.7381 |
Figure S3. Get High-res Image As an example, this figure shows the association of FAM35A to 'GENDER'. P value = 3.33e-28 with T-test analysis.
-
Expresson data file = LAML-TB.meth.by_min_expr_corr.data.txt
-
Clinical data file = LAML-TB.clin.merged.picked.txt
-
Number of patients = 191
-
Number of genes = 19042
-
Number of clinical features = 3
For survival clinical features, Wald's test in univariate Cox regression analysis with proportional hazards model (Andersen and Gill 1982) was used to estimate the P values using the 'coxph' function in R. Kaplan-Meier survival curves were plot using the four quartile subgroups of patients based on expression levels
For continuous numerical clinical features, Spearman's rank correlation coefficients (Spearman 1904) and two-tailed P values were estimated using 'cor.test' function in R
For two-class clinical features, two-tailed Student's t test with unequal variance (Lehmann and Romano 2005) was applied to compare the log2-expression levels between the two clinical classes using 't.test' function in R
For multiple hypothesis correction, Q value is the False Discovery Rate (FDR) analogue of the P value (Benjamini and Hochberg 1995), defined as the minimum FDR at which the test may be called significant. We used the 'Benjamini and Hochberg' method of 'p.adjust' function in R to convert P values into Q values.
This is an experimental feature. The full results of the analysis summarized in this report can be downloaded from the TCGA Data Coordination Center.