This pipeline computes the correlation between significantly recurrent gene mutations and selected clinical features.
Testing the association between mutation status of 7 genes and 3 clinical features across 196 patients, 3 significant findings detected with Q value < 0.25.
-
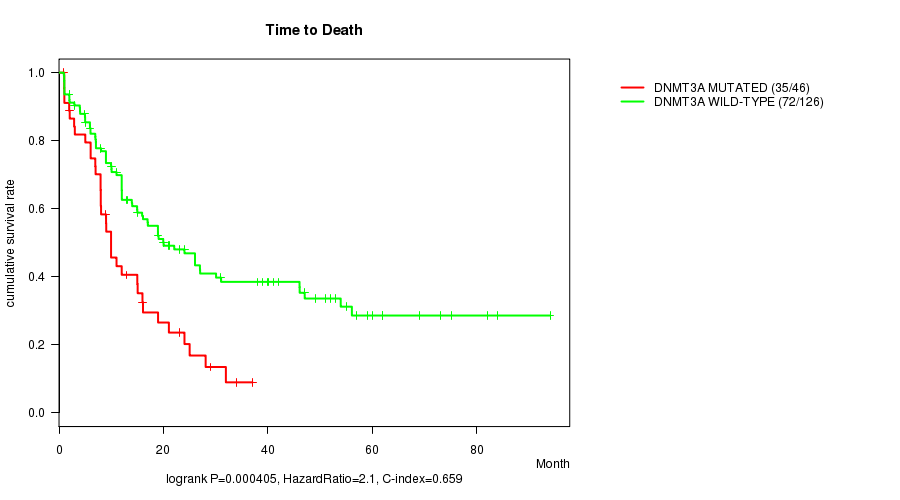
DNMT3A mutation correlated to 'Time to Death'.
-
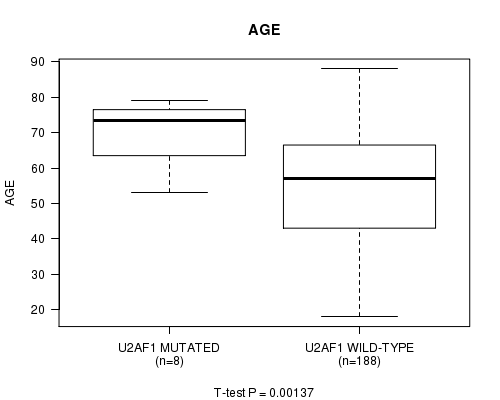
U2AF1 mutation correlated to 'AGE'.
-
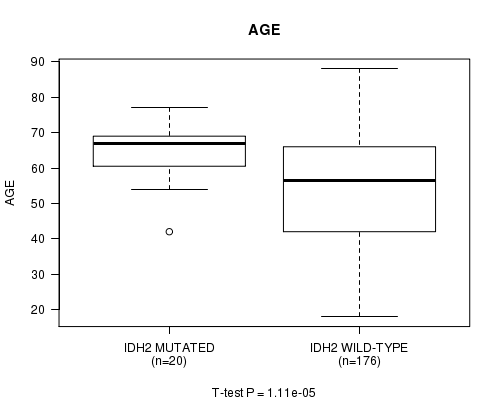
IDH2 mutation correlated to 'AGE'.
Table 1. Get Full Table Overview of the association between mutation status of 7 genes and 3 clinical features. Shown in the table are P values (Q values). Thresholded by Q value < 0.25, 3 significant findings detected.
|
Clinical Features |
Time to Death |
AGE | GENDER | ||
| nMutated (%) | nWild-Type | logrank test | t-test | Fisher's exact test | |
| DNMT3A | 51 (26%) | 145 |
0.000405 (0.00811) |
0.0653 (1.00) |
0.328 (1.00) |
| U2AF1 | 8 (4%) | 188 |
0.614 (1.00) |
0.00137 (0.026) |
0.0703 (1.00) |
| IDH2 | 20 (10%) | 176 |
0.448 (1.00) |
1.11e-05 (0.000233) |
0.815 (1.00) |
| FLT3 | 56 (29%) | 140 |
0.085 (1.00) |
0.563 (1.00) |
0.754 (1.00) |
| IDH1 | 19 (10%) | 177 |
0.81 (1.00) |
0.304 (1.00) |
0.633 (1.00) |
| NPM1 | 54 (28%) | 142 |
0.112 (1.00) |
0.968 (1.00) |
0.262 (1.00) |
| NRAS | 15 (8%) | 181 |
0.851 (1.00) |
0.287 (1.00) |
1 (1.00) |
P value = 0.000405 (logrank test), Q value = 0.0081
Table S1. Gene #1: 'DNMT3A MUTATION STATUS' versus Clinical Feature #1: 'Time to Death'
| nPatients | nDeath | Duration Range (Median), Month | |
|---|---|---|---|
| ALL | 172 | 107 | 0.9 - 94.1 (12.0) |
| DNMT3A MUTATED | 46 | 35 | 0.9 - 37.0 (9.0) |
| DNMT3A WILD-TYPE | 126 | 72 | 0.9 - 94.1 (15.0) |
Figure S1. Get High-res Image Gene #1: 'DNMT3A MUTATION STATUS' versus Clinical Feature #1: 'Time to Death'
P value = 0.00137 (t-test), Q value = 0.026
Table S2. Gene #2: 'U2AF1 MUTATION STATUS' versus Clinical Feature #2: 'AGE'
| nPatients | Mean (Std.Dev) | |
|---|---|---|
| ALL | 196 | 55.1 (16.2) |
| U2AF1 MUTATED | 8 | 69.9 (9.0) |
| U2AF1 WILD-TYPE | 188 | 54.5 (16.1) |
Figure S2. Get High-res Image Gene #2: 'U2AF1 MUTATION STATUS' versus Clinical Feature #2: 'AGE'
P value = 1.11e-05 (t-test), Q value = 0.00023
Table S3. Gene #4: 'IDH2 MUTATION STATUS' versus Clinical Feature #2: 'AGE'
| nPatients | Mean (Std.Dev) | |
|---|---|---|
| ALL | 196 | 55.1 (16.2) |
| IDH2 MUTATED | 20 | 64.8 (8.0) |
| IDH2 WILD-TYPE | 176 | 54.0 (16.5) |
Figure S3. Get High-res Image Gene #4: 'IDH2 MUTATION STATUS' versus Clinical Feature #2: 'AGE'
-
Mutation data file = LAML-TB.mutsig.cluster.txt
-
Clinical data file = LAML-TB.clin.merged.picked.txt
-
Number of patients = 196
-
Number of significantly mutated genes = 7
-
Number of selected clinical features = 3
-
Exclude genes that fewer than K tumors have mutations, K = 3
For survival clinical features, the Kaplan-Meier survival curves of tumors with and without gene mutations were plotted and the statistical significance P values were estimated by logrank test (Bland and Altman 2004) using the 'survdiff' function in R
For continuous numerical clinical features, two-tailed Student's t test with unequal variance (Lehmann and Romano 2005) was applied to compare the clinical values between tumors with and without gene mutations using 't.test' function in R
For binary or multi-class clinical features (nominal or ordinal), two-tailed Fisher's exact tests (Fisher 1922) were used to estimate the P values using the 'fisher.test' function in R
For multiple hypothesis correction, Q value is the False Discovery Rate (FDR) analogue of the P value (Benjamini and Hochberg 1995), defined as the minimum FDR at which the test may be called significant. We used the 'Benjamini and Hochberg' method of 'p.adjust' function in R to convert P values into Q values.
This is an experimental feature. The full results of the analysis summarized in this report can be downloaded from the TCGA Data Coordination Center.