This pipeline uses various statistical tests to identify miRs whose expression levels correlated to selected clinical features.
Testing the association between 354 genes and 3 clinical features across 188 samples, statistically thresholded by Q value < 0.05, 3 clinical features related to at least one genes.
-
7 genes correlated to 'Time to Death'.
-
HSA-MIR-362 , HSA-MIR-532 , HSA-MIR-181B-1 , HSA-MIR-502 , HSA-MIR-660 , ...
-
5 genes correlated to 'AGE'.
-
HSA-MIR-598 , HSA-MIR-766 , HSA-MIR-29B-1 , HSA-MIR-20B , HSA-MIR-363
-
3 genes correlated to 'GENDER'.
-
HSA-MIR-107 , HSA-MIR-1226 , HSA-MIR-505
Complete statistical result table is provided in Supplement Table 1
Table 1. Get Full Table This table shows the clinical features, statistical methods used, and the number of genes that are significantly associated with each clinical feature at Q value < 0.05.
| Clinical feature | Statistical test | Significant genes | Associated with | Associated with | ||
|---|---|---|---|---|---|---|
| Time to Death | Cox regression test | N=7 | shorter survival | N=6 | longer survival | N=1 |
| AGE | Spearman correlation test | N=5 | older | N=4 | younger | N=1 |
| GENDER | t test | N=3 | male | N=3 | female | N=0 |
Table S1. Basic characteristics of clinical feature: 'Time to Death'
| Time to Death | Duration (Months) | 0.9-94.1 (median=12) |
| censored | N = 62 | |
| death | N = 100 | |
| Significant markers | N = 7 | |
| associated with shorter survival | 6 | |
| associated with longer survival | 1 |
Table S2. Get Full Table List of 7 genes significantly associated with 'Time to Death' by Cox regression test
| HazardRatio | Wald_P | Q | C_index | |
|---|---|---|---|---|
| HSA-MIR-362 | 1.51 | 2.917e-06 | 0.001 | 0.669 |
| HSA-MIR-532 | 1.48 | 9.616e-06 | 0.0034 | 0.668 |
| HSA-MIR-181B-1 | 0.77 | 8.478e-05 | 0.03 | 0.378 |
| HSA-MIR-502 | 1.43 | 8.721e-05 | 0.031 | 0.644 |
| HSA-MIR-660 | 1.43 | 9.931e-05 | 0.035 | 0.643 |
| HSA-MIR-501 | 1.33 | 0.000109 | 0.038 | 0.641 |
| HSA-MIR-188 | 1.38 | 0.0001184 | 0.041 | 0.635 |
Figure S1. Get High-res Image As an example, this figure shows the association of HSA-MIR-362 to 'Time to Death'. four curves present the cumulative survival rates of 4 quartile subsets of patients. P value = 2.92e-06 with univariate Cox regression analysis using continuous log-2 expression values.
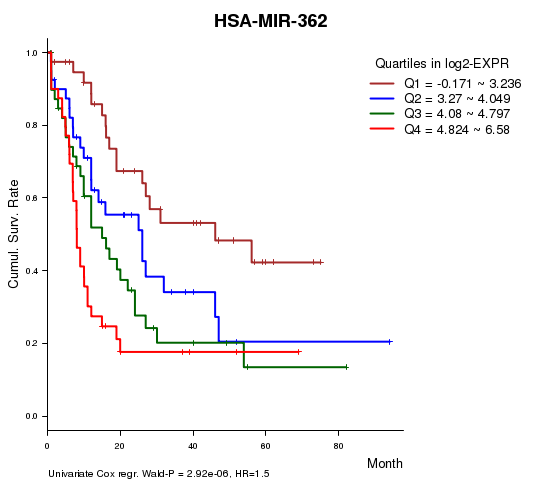
Table S3. Basic characteristics of clinical feature: 'AGE'
| AGE | Mean (SD) | 54.89 (16) |
| Significant markers | N = 5 | |
| pos. correlated | 4 | |
| neg. correlated | 1 |
Table S4. Get Full Table List of 5 genes significantly correlated to 'AGE' by Spearman correlation test
| SpearmanCorr | corrP | Q | |
|---|---|---|---|
| HSA-MIR-598 | 0.3159 | 1.653e-05 | 0.00585 |
| HSA-MIR-766 | -0.2945 | 4.1e-05 | 0.0145 |
| HSA-MIR-29B-1 | 0.2923 | 4.689e-05 | 0.0165 |
| HSA-MIR-20B | 0.2895 | 5.577e-05 | 0.0196 |
| HSA-MIR-363 | 0.2772 | 0.0001175 | 0.0411 |
Figure S2. Get High-res Image As an example, this figure shows the association of HSA-MIR-598 to 'AGE'. P value = 1.65e-05 with Spearman correlation analysis. The straight line presents the best linear regression.
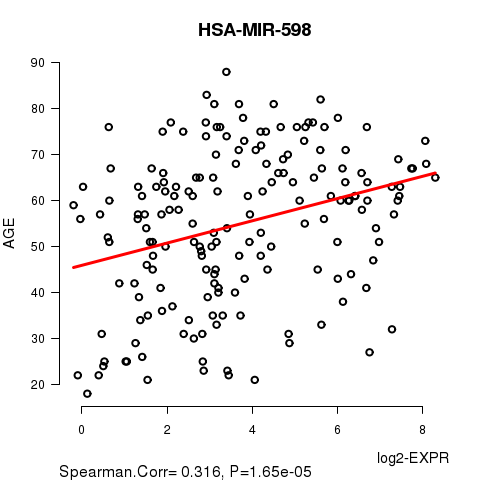
Table S5. Basic characteristics of clinical feature: 'GENDER'
| GENDER | Labels | N |
| FEMALE | 87 | |
| MALE | 101 | |
| Significant markers | N = 3 | |
| Higher in MALE | 3 | |
| Higher in FEMALE | 0 |
Table S6. Get Full Table List of 3 genes differentially expressed by 'GENDER'
| T(pos if higher in 'MALE') | ttestP | Q | AUC | |
|---|---|---|---|---|
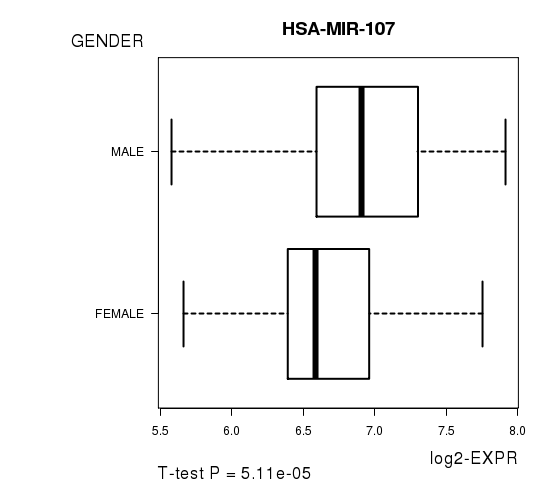
| HSA-MIR-107 | 4.15 | 5.109e-05 | 0.0181 | 0.6711 |
| HSA-MIR-1226 | 4.03 | 8.43e-05 | 0.0298 | 0.6651 |
| HSA-MIR-505 | 4.02 | 8.681e-05 | 0.0306 | 0.6749 |
Figure S3. Get High-res Image As an example, this figure shows the association of HSA-MIR-107 to 'GENDER'. P value = 5.11e-05 with T-test analysis.
-
Expresson data file = LAML-TB.miRseq_RPKM_log2.txt
-
Clinical data file = LAML-TB.clin.merged.picked.txt
-
Number of patients = 188
-
Number of genes = 354
-
Number of clinical features = 3
For survival clinical features, Wald's test in univariate Cox regression analysis with proportional hazards model (Andersen and Gill 1982) was used to estimate the P values using the 'coxph' function in R. Kaplan-Meier survival curves were plot using the four quartile subgroups of patients based on expression levels
For continuous numerical clinical features, Spearman's rank correlation coefficients (Spearman 1904) and two-tailed P values were estimated using 'cor.test' function in R
For two-class clinical features, two-tailed Student's t test with unequal variance (Lehmann and Romano 2005) was applied to compare the log2-expression levels between the two clinical classes using 't.test' function in R
For multiple hypothesis correction, Q value is the False Discovery Rate (FDR) analogue of the P value (Benjamini and Hochberg 1995), defined as the minimum FDR at which the test may be called significant. We used the 'Benjamini and Hochberg' method of 'p.adjust' function in R to convert P values into Q values.
This is an experimental feature. The full results of the analysis summarized in this report can be downloaded from the TCGA Data Coordination Center.