This pipeline uses various statistical tests to identify genes whose promoter methylation levels correlated to selected clinical features.
Testing the association between 20213 genes and 6 clinical features across 203 samples, statistically thresholded by Q value < 0.05, 4 clinical features related to at least one genes.
-
408 genes correlated to 'Time to Death'.
-
HS3ST4 , SSTR1 , GALNT14 , RAB6C , HPD , ...
-
158 genes correlated to 'AGE'.
-
CD163L1 , HOXD8 , LOC150786 , ADAMTSL3 , PAX9 , ...
-
15 genes correlated to 'GENDER'.
-
ALG11__1 , UTP14C , POLDIP3 , RNU12 , FAM35A , ...
-
911 genes correlated to 'HISTOLOGICAL.TYPE'.
-
BVES , REST , SNAPC2 , MAPKAP1 , SLC2A4RG , ...
-
No genes correlated to 'KARNOFSKY.PERFORMANCE.SCORE', and 'RADIATIONS.RADIATION.REGIMENINDICATION'.
Complete statistical result table is provided in Supplement Table 1
Table 1. Get Full Table This table shows the clinical features, statistical methods used, and the number of genes that are significantly associated with each clinical feature at Q value < 0.05.
| Clinical feature | Statistical test | Significant genes | Associated with | Associated with | ||
|---|---|---|---|---|---|---|
| Time to Death | Cox regression test | N=408 | shorter survival | N=65 | longer survival | N=343 |
| AGE | Spearman correlation test | N=158 | older | N=126 | younger | N=32 |
| GENDER | t test | N=15 | male | N=6 | female | N=9 |
| KARNOFSKY PERFORMANCE SCORE | Spearman correlation test | N=0 | ||||
| HISTOLOGICAL TYPE | ANOVA test | N=911 | ||||
| RADIATIONS RADIATION REGIMENINDICATION | t test | N=0 |
Table S1. Basic characteristics of clinical feature: 'Time to Death'
| Time to Death | Duration (Months) | 0-211.2 (median=13.3) |
| censored | N = 157 | |
| death | N = 45 | |
| Significant markers | N = 408 | |
| associated with shorter survival | 65 | |
| associated with longer survival | 343 |
Table S2. Get Full Table List of top 10 genes significantly associated with 'Time to Death' by Cox regression test
| HazardRatio | Wald_P | Q | C_index | |
|---|---|---|---|---|
| HS3ST4 | 191 | 3.757e-12 | 7.6e-08 | 0.771 |
| SSTR1 | 131 | 4.744e-11 | 9.6e-07 | 0.782 |
| GALNT14 | 121 | 6.344e-11 | 1.3e-06 | 0.793 |
| RAB6C | 1701 | 9.804e-11 | 2e-06 | 0.8 |
| HPD | 0 | 1.005e-10 | 2e-06 | 0.291 |
| ZNF492 | 76 | 1.119e-10 | 2.3e-06 | 0.675 |
| ATF3 | 0 | 1.236e-10 | 2.5e-06 | 0.276 |
| LPAR3 | 161 | 1.417e-10 | 2.9e-06 | 0.751 |
| CD274 | 0.01 | 2.172e-10 | 4.4e-06 | 0.283 |
| TLK1 | 0.02 | 5.083e-10 | 1e-05 | 0.279 |
Figure S1. Get High-res Image As an example, this figure shows the association of HS3ST4 to 'Time to Death'. four curves present the cumulative survival rates of 4 quartile subsets of patients. P value = 3.76e-12 with univariate Cox regression analysis using continuous log-2 expression values.
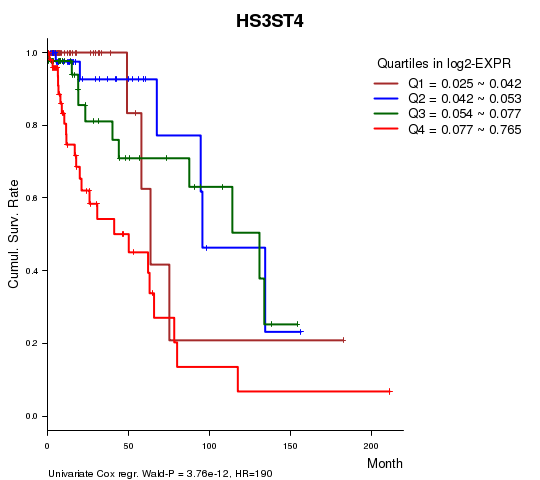
Table S3. Basic characteristics of clinical feature: 'AGE'
| AGE | Mean (SD) | 42.88 (13) |
| Significant markers | N = 158 | |
| pos. correlated | 126 | |
| neg. correlated | 32 |
Table S4. Get Full Table List of top 10 genes significantly correlated to 'AGE' by Spearman correlation test
| SpearmanCorr | corrP | Q | |
|---|---|---|---|
| CD163L1 | 0.5388 | 1.106e-16 | 2.24e-12 |
| HOXD8 | 0.5203 | 1.77e-15 | 3.58e-11 |
| LOC150786 | 0.519 | 2.138e-15 | 4.32e-11 |
| ADAMTSL3 | 0.4994 | 3.358e-14 | 6.79e-10 |
| PAX9 | 0.498 | 4.052e-14 | 8.19e-10 |
| SLC18A2 | 0.4886 | 1.417e-13 | 2.86e-09 |
| GALNT14 | 0.4805 | 4.034e-13 | 8.15e-09 |
| RAB6C | 0.4757 | 7.395e-13 | 1.49e-08 |
| SSTR4 | 0.4709 | 1.34e-12 | 2.71e-08 |
| HOXD11 | 0.4625 | 3.748e-12 | 7.57e-08 |
Figure S2. Get High-res Image As an example, this figure shows the association of CD163L1 to 'AGE'. P value = 1.11e-16 with Spearman correlation analysis. The straight line presents the best linear regression.
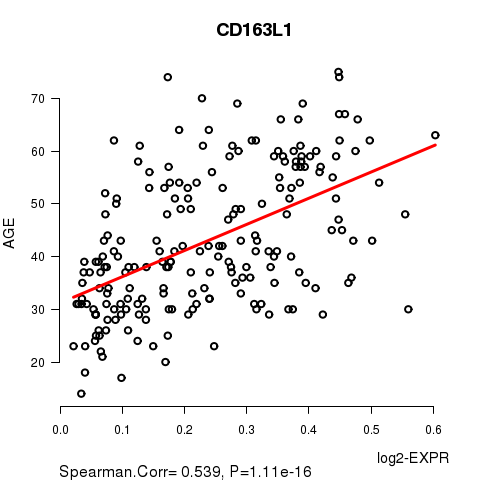
Table S5. Basic characteristics of clinical feature: 'GENDER'
| GENDER | Labels | N |
| FEMALE | 88 | |
| MALE | 115 | |
| Significant markers | N = 15 | |
| Higher in MALE | 6 | |
| Higher in FEMALE | 9 |
Table S6. Get Full Table List of top 10 genes differentially expressed by 'GENDER'
| T(pos if higher in 'MALE') | ttestP | Q | AUC | |
|---|---|---|---|---|
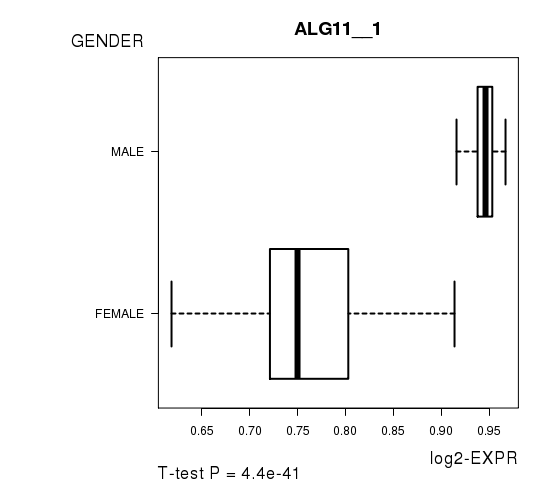
| ALG11__1 | 21.3 | 4.404e-41 | 8.9e-37 | 0.977 |
| UTP14C | 21.3 | 4.404e-41 | 8.9e-37 | 0.977 |
| POLDIP3 | -14.87 | 1.692e-30 | 3.42e-26 | 0.9379 |
| RNU12 | -14.87 | 1.692e-30 | 3.42e-26 | 0.9379 |
| FAM35A | -10.91 | 5.274e-22 | 1.07e-17 | 0.8348 |
| GLUD1 | -10.91 | 5.274e-22 | 1.07e-17 | 0.8348 |
| WBP11P1 | 8.78 | 1.634e-15 | 3.3e-11 | 0.8367 |
| TFDP1 | -7.35 | 6.298e-12 | 1.27e-07 | 0.8641 |
| KIF4B | -6.92 | 1.284e-10 | 2.59e-06 | 0.7491 |
| ZNF839 | -6.06 | 8.311e-09 | 0.000168 | 0.7737 |
Figure S3. Get High-res Image As an example, this figure shows the association of ALG11__1 to 'GENDER'. P value = 4.4e-41 with T-test analysis.
No gene related to 'KARNOFSKY.PERFORMANCE.SCORE'.
Table S7. Basic characteristics of clinical feature: 'KARNOFSKY.PERFORMANCE.SCORE'
| KARNOFSKY.PERFORMANCE.SCORE | Mean (SD) | 88.43 (11) |
| Significant markers | N = 0 |
Table S8. Basic characteristics of clinical feature: 'HISTOLOGICAL.TYPE'
| HISTOLOGICAL.TYPE | Labels | N |
| ASTROCYTOMA | 60 | |
| OLIGOASTROCYTOMA | 55 | |
| OLIGODENDROGLIOMA | 87 | |
| Significant markers | N = 911 |
Table S9. Get Full Table List of top 10 genes differentially expressed by 'HISTOLOGICAL.TYPE'
| ANOVA_P | Q | |
|---|---|---|
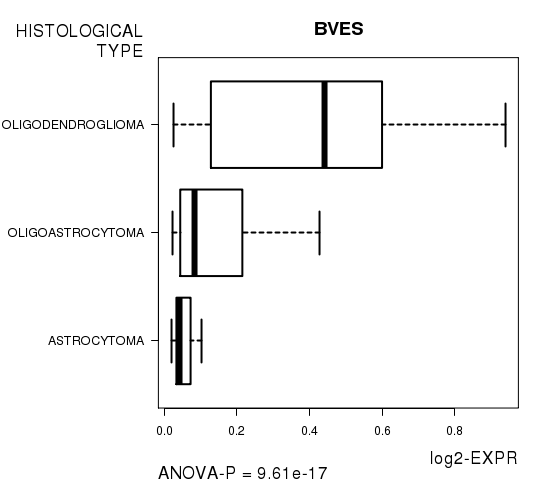
| BVES | 9.613e-17 | 1.94e-12 |
| REST | 5.037e-16 | 1.02e-11 |
| SNAPC2 | 1.844e-15 | 3.73e-11 |
| MAPKAP1 | 1.856e-15 | 3.75e-11 |
| SLC2A4RG | 1.927e-15 | 3.89e-11 |
| GLIS3 | 7.083e-15 | 1.43e-10 |
| TMEM51 | 1.125e-14 | 2.27e-10 |
| CBX2 | 2.836e-14 | 5.73e-10 |
| S100PBP__1 | 4.039e-14 | 8.16e-10 |
| EMP1 | 4.181e-14 | 8.45e-10 |
Figure S4. Get High-res Image As an example, this figure shows the association of BVES to 'HISTOLOGICAL.TYPE'. P value = 9.61e-17 with ANOVA analysis.
No gene related to 'RADIATIONS.RADIATION.REGIMENINDICATION'.
Table S10. Basic characteristics of clinical feature: 'RADIATIONS.RADIATION.REGIMENINDICATION'
| RADIATIONS.RADIATION.REGIMENINDICATION | Labels | N |
| NO | 76 | |
| YES | 127 | |
| Significant markers | N = 0 |
-
Expresson data file = LGG-TP.meth.by_min_expr_corr.data.txt
-
Clinical data file = LGG-TP.clin.merged.picked.txt
-
Number of patients = 203
-
Number of genes = 20213
-
Number of clinical features = 6
For survival clinical features, Wald's test in univariate Cox regression analysis with proportional hazards model (Andersen and Gill 1982) was used to estimate the P values using the 'coxph' function in R. Kaplan-Meier survival curves were plot using the four quartile subgroups of patients based on expression levels
For continuous numerical clinical features, Spearman's rank correlation coefficients (Spearman 1904) and two-tailed P values were estimated using 'cor.test' function in R
For two-class clinical features, two-tailed Student's t test with unequal variance (Lehmann and Romano 2005) was applied to compare the log2-expression levels between the two clinical classes using 't.test' function in R
For multi-class clinical features (ordinal or nominal), one-way analysis of variance (Howell 2002) was applied to compare the log2-expression levels between different clinical classes using 'anova' function in R
For multiple hypothesis correction, Q value is the False Discovery Rate (FDR) analogue of the P value (Benjamini and Hochberg 1995), defined as the minimum FDR at which the test may be called significant. We used the 'Benjamini and Hochberg' method of 'p.adjust' function in R to convert P values into Q values.
This is an experimental feature. The full results of the analysis summarized in this report can be downloaded from the TCGA Data Coordination Center.