This pipeline computes the correlation between significantly recurrent gene mutations and selected clinical features.
Testing the association between mutation status of 16 genes and 6 clinical features across 204 patients, 10 significant findings detected with Q value < 0.25.
-
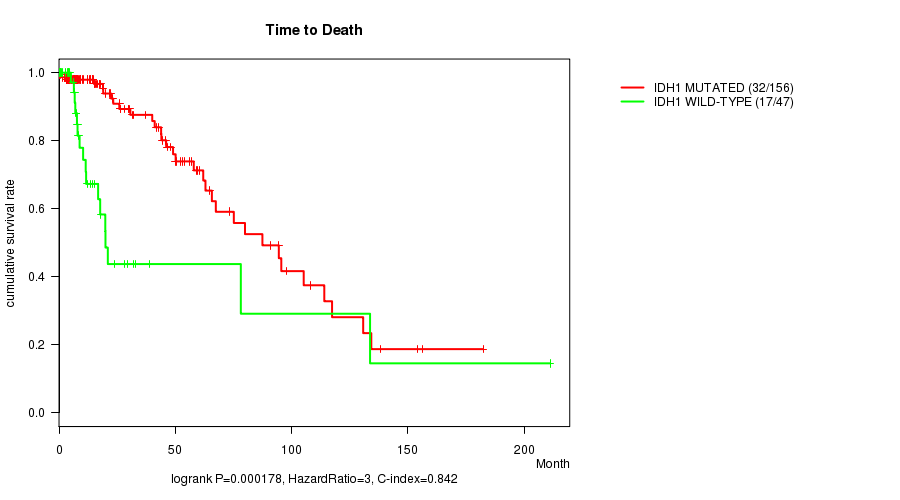
IDH1 mutation correlated to 'Time to Death'.
-
TP53 mutation correlated to 'AGE', 'HISTOLOGICAL.TYPE', and 'RADIATIONS.RADIATION.REGIMENINDICATION'.
-
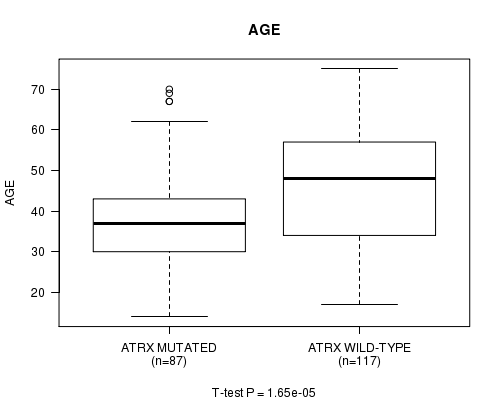
ATRX mutation correlated to 'AGE' and 'HISTOLOGICAL.TYPE'.
-
CIC mutation correlated to 'HISTOLOGICAL.TYPE'.
-
FUBP1 mutation correlated to 'HISTOLOGICAL.TYPE'.
-
NOTCH1 mutation correlated to 'HISTOLOGICAL.TYPE'.
-
PTEN mutation correlated to 'HISTOLOGICAL.TYPE'.
Table 1. Get Full Table Overview of the association between mutation status of 16 genes and 6 clinical features. Shown in the table are P values (Q values). Thresholded by Q value < 0.25, 10 significant findings detected.
|
Clinical Features |
Time to Death |
AGE | GENDER |
KARNOFSKY PERFORMANCE SCORE |
HISTOLOGICAL TYPE |
RADIATIONS RADIATION REGIMENINDICATION |
||
| nMutated (%) | nWild-Type | logrank test | t-test | Fisher's exact test | t-test | Fisher's exact test | Fisher's exact test | |
| TP53 | 105 (51%) | 99 |
0.17 (1.00) |
1.1e-06 (9.83e-05) |
0.157 (1.00) |
0.45 (1.00) |
4.95e-07 (4.46e-05) |
0.000926 (0.0768) |
| ATRX | 87 (43%) | 117 |
0.106 (1.00) |
1.65e-05 (0.00145) |
0.476 (1.00) |
0.522 (1.00) |
5.21e-05 (0.00453) |
0.0294 (1.00) |
| IDH1 | 157 (77%) | 47 |
0.000178 (0.0153) |
0.0292 (1.00) |
0.0186 (1.00) |
0.842 (1.00) |
0.00713 (0.571) |
0.173 (1.00) |
| CIC | 40 (20%) | 164 |
0.0807 (1.00) |
0.587 (1.00) |
0.723 (1.00) |
0.718 (1.00) |
1.25e-09 (1.13e-07) |
0.106 (1.00) |
| FUBP1 | 22 (11%) | 182 |
0.743 (1.00) |
0.00634 (0.514) |
1 (1.00) |
0.711 (1.00) |
0.000973 (0.0798) |
0.822 (1.00) |
| NOTCH1 | 18 (9%) | 186 |
0.777 (1.00) |
0.0158 (1.00) |
0.318 (1.00) |
0.119 (1.00) |
0.000211 (0.0179) |
0.801 (1.00) |
| PTEN | 11 (5%) | 193 |
0.279 (1.00) |
0.0305 (1.00) |
0.532 (1.00) |
0.000493 (0.0414) |
0.754 (1.00) |
|
| IL32 | 5 (2%) | 199 |
0.00837 (0.662) |
0.285 (1.00) |
1 (1.00) |
0.14 (1.00) |
1 (1.00) |
0.159 (1.00) |
| IDH2 | 8 (4%) | 196 |
0.532 (1.00) |
0.148 (1.00) |
1 (1.00) |
0.0399 (1.00) |
1 (1.00) |
|
| PIK3R1 | 14 (7%) | 190 |
0.196 (1.00) |
0.0624 (1.00) |
0.403 (1.00) |
0.674 (1.00) |
0.603 (1.00) |
0.783 (1.00) |
| PIK3CA | 19 (9%) | 185 |
0.778 (1.00) |
0.47 (1.00) |
0.808 (1.00) |
0.351 (1.00) |
0.148 (1.00) |
1 (1.00) |
| CREBZF | 4 (2%) | 200 |
0.648 (1.00) |
0.22 (1.00) |
0.312 (1.00) |
0.291 (1.00) |
0.477 (1.00) |
1 (1.00) |
| TIMD4 | 5 (2%) | 199 |
0.103 (1.00) |
0.175 (1.00) |
0.652 (1.00) |
0.14 (1.00) |
1 (1.00) |
0.65 (1.00) |
| EMG1 | 4 (2%) | 200 |
0.53 (1.00) |
0.583 (1.00) |
0.64 (1.00) |
0.581 (1.00) |
0.302 (1.00) |
|
| NOX4 | 5 (2%) | 199 |
0.475 (1.00) |
0.494 (1.00) |
1 (1.00) |
0.727 (1.00) |
0.382 (1.00) |
|
| ZNF57 | 6 (3%) | 198 |
0.249 (1.00) |
0.759 (1.00) |
0.242 (1.00) |
0.149 (1.00) |
1 (1.00) |
P value = 0.000178 (logrank test), Q value = 0.015
Table S1. Gene #3: 'IDH1 MUTATION STATUS' versus Clinical Feature #1: 'Time to Death'
| nPatients | nDeath | Duration Range (Median), Month | |
|---|---|---|---|
| ALL | 203 | 49 | 0.0 - 211.2 (13.4) |
| IDH1 MUTATED | 156 | 32 | 0.0 - 182.3 (15.2) |
| IDH1 WILD-TYPE | 47 | 17 | 0.1 - 211.2 (8.4) |
Figure S1. Get High-res Image Gene #3: 'IDH1 MUTATION STATUS' versus Clinical Feature #1: 'Time to Death'
P value = 1.1e-06 (t-test), Q value = 9.8e-05
Table S2. Gene #4: 'TP53 MUTATION STATUS' versus Clinical Feature #2: 'AGE'
| nPatients | Mean (Std.Dev) | |
|---|---|---|
| ALL | 204 | 43.0 (13.3) |
| TP53 MUTATED | 105 | 38.7 (11.8) |
| TP53 WILD-TYPE | 99 | 47.6 (13.3) |
Figure S2. Get High-res Image Gene #4: 'TP53 MUTATION STATUS' versus Clinical Feature #2: 'AGE'

P value = 4.95e-07 (Fisher's exact test), Q value = 4.5e-05
Table S3. Gene #4: 'TP53 MUTATION STATUS' versus Clinical Feature #5: 'HISTOLOGICAL.TYPE'
| nPatients | ASTROCYTOMA | OLIGOASTROCYTOMA | OLIGODENDROGLIOMA |
|---|---|---|---|
| ALL | 61 | 53 | 89 |
| TP53 MUTATED | 39 | 38 | 27 |
| TP53 WILD-TYPE | 22 | 15 | 62 |
Figure S3. Get High-res Image Gene #4: 'TP53 MUTATION STATUS' versus Clinical Feature #5: 'HISTOLOGICAL.TYPE'

P value = 0.000926 (Fisher's exact test), Q value = 0.077
Table S4. Gene #4: 'TP53 MUTATION STATUS' versus Clinical Feature #6: 'RADIATIONS.RADIATION.REGIMENINDICATION'
| nPatients | NO | YES |
|---|---|---|
| ALL | 80 | 124 |
| TP53 MUTATED | 53 | 52 |
| TP53 WILD-TYPE | 27 | 72 |
Figure S4. Get High-res Image Gene #4: 'TP53 MUTATION STATUS' versus Clinical Feature #6: 'RADIATIONS.RADIATION.REGIMENINDICATION'

P value = 1.65e-05 (t-test), Q value = 0.0014
Table S5. Gene #5: 'ATRX MUTATION STATUS' versus Clinical Feature #2: 'AGE'
| nPatients | Mean (Std.Dev) | |
|---|---|---|
| ALL | 204 | 43.0 (13.3) |
| ATRX MUTATED | 87 | 38.5 (12.1) |
| ATRX WILD-TYPE | 117 | 46.4 (13.2) |
Figure S5. Get High-res Image Gene #5: 'ATRX MUTATION STATUS' versus Clinical Feature #2: 'AGE'
P value = 5.21e-05 (Fisher's exact test), Q value = 0.0045
Table S6. Gene #5: 'ATRX MUTATION STATUS' versus Clinical Feature #5: 'HISTOLOGICAL.TYPE'
| nPatients | ASTROCYTOMA | OLIGOASTROCYTOMA | OLIGODENDROGLIOMA |
|---|---|---|---|
| ALL | 61 | 53 | 89 |
| ATRX MUTATED | 29 | 34 | 24 |
| ATRX WILD-TYPE | 32 | 19 | 65 |
Figure S6. Get High-res Image Gene #5: 'ATRX MUTATION STATUS' versus Clinical Feature #5: 'HISTOLOGICAL.TYPE'

P value = 1.25e-09 (Fisher's exact test), Q value = 1.1e-07
Table S7. Gene #6: 'CIC MUTATION STATUS' versus Clinical Feature #5: 'HISTOLOGICAL.TYPE'
| nPatients | ASTROCYTOMA | OLIGOASTROCYTOMA | OLIGODENDROGLIOMA |
|---|---|---|---|
| ALL | 61 | 53 | 89 |
| CIC MUTATED | 2 | 3 | 35 |
| CIC WILD-TYPE | 59 | 50 | 54 |
Figure S7. Get High-res Image Gene #6: 'CIC MUTATION STATUS' versus Clinical Feature #5: 'HISTOLOGICAL.TYPE'

P value = 0.000973 (Fisher's exact test), Q value = 0.08
Table S8. Gene #7: 'FUBP1 MUTATION STATUS' versus Clinical Feature #5: 'HISTOLOGICAL.TYPE'
| nPatients | ASTROCYTOMA | OLIGOASTROCYTOMA | OLIGODENDROGLIOMA |
|---|---|---|---|
| ALL | 61 | 53 | 89 |
| FUBP1 MUTATED | 2 | 2 | 18 |
| FUBP1 WILD-TYPE | 59 | 51 | 71 |
Figure S8. Get High-res Image Gene #7: 'FUBP1 MUTATION STATUS' versus Clinical Feature #5: 'HISTOLOGICAL.TYPE'

P value = 0.000211 (Fisher's exact test), Q value = 0.018
Table S9. Gene #8: 'NOTCH1 MUTATION STATUS' versus Clinical Feature #5: 'HISTOLOGICAL.TYPE'
| nPatients | ASTROCYTOMA | OLIGOASTROCYTOMA | OLIGODENDROGLIOMA |
|---|---|---|---|
| ALL | 61 | 53 | 89 |
| NOTCH1 MUTATED | 1 | 1 | 16 |
| NOTCH1 WILD-TYPE | 60 | 52 | 73 |
Figure S9. Get High-res Image Gene #8: 'NOTCH1 MUTATION STATUS' versus Clinical Feature #5: 'HISTOLOGICAL.TYPE'

P value = 0.000493 (Fisher's exact test), Q value = 0.041
Table S10. Gene #12: 'PTEN MUTATION STATUS' versus Clinical Feature #5: 'HISTOLOGICAL.TYPE'
| nPatients | ASTROCYTOMA | OLIGOASTROCYTOMA | OLIGODENDROGLIOMA |
|---|---|---|---|
| ALL | 61 | 53 | 89 |
| PTEN MUTATED | 9 | 0 | 2 |
| PTEN WILD-TYPE | 52 | 53 | 87 |
Figure S10. Get High-res Image Gene #12: 'PTEN MUTATION STATUS' versus Clinical Feature #5: 'HISTOLOGICAL.TYPE'

-
Mutation data file = LGG-TP.mutsig.cluster.txt
-
Clinical data file = LGG-TP.clin.merged.picked.txt
-
Number of patients = 204
-
Number of significantly mutated genes = 16
-
Number of selected clinical features = 6
-
Exclude genes that fewer than K tumors have mutations, K = 3
For survival clinical features, the Kaplan-Meier survival curves of tumors with and without gene mutations were plotted and the statistical significance P values were estimated by logrank test (Bland and Altman 2004) using the 'survdiff' function in R
For continuous numerical clinical features, two-tailed Student's t test with unequal variance (Lehmann and Romano 2005) was applied to compare the clinical values between tumors with and without gene mutations using 't.test' function in R
For binary or multi-class clinical features (nominal or ordinal), two-tailed Fisher's exact tests (Fisher 1922) were used to estimate the P values using the 'fisher.test' function in R
For multiple hypothesis correction, Q value is the False Discovery Rate (FDR) analogue of the P value (Benjamini and Hochberg 1995), defined as the minimum FDR at which the test may be called significant. We used the 'Benjamini and Hochberg' method of 'p.adjust' function in R to convert P values into Q values.
This is an experimental feature. The full results of the analysis summarized in this report can be downloaded from the TCGA Data Coordination Center.