This report serves to describe the mutational landscape and properties of a given individual set, as well as rank genes and genesets according to mutational significance. MutSig v2.0 and MutSigCV v0.9 merged result was used to generate the results found in this report.
-
Working with individual set: LGG-TP
-
Number of patients in set: 217
The input for this pipeline is a set of individuals with the following files associated for each:
-
An annotated .maf file describing the mutations called for the respective individual, and their properties.
-
A .wig file that contains information about the coverage of the sample.
-
MAF used for this analysis:LGG-TP.final_analysis_set.maf
-
Significantly mutated genes (q ≤ 0.1): 16
-
Mutations seen in COSMIC: 425
-
Significantly mutated genes in COSMIC territory: 13
-
Significantly mutated genesets: 100
-
Read 217 MAFs of type "Broad"
-
Total number of mutations in input MAFs: 27275
-
After removing 13 mutations outside chr1-24: 27262
-
After removing 590 blacklisted mutations: 26672
-
After removing 573 noncoding mutations: 26099
-
Number of mutations before filtering: 26099
-
After removing 361 mutations outside gene set: 25738
-
After removing 101 mutations outside category set: 25637
-
After removing 3 "impossible" mutations in
-
gene-patient-category bins of zero coverage: 25172
Table 1. Get Full Table Table representing breakdown of mutations by type.
| type | count |
|---|---|
| Frame_Shift_Del | 584 |
| Frame_Shift_Ins | 291 |
| In_Frame_Del | 299 |
| In_Frame_Ins | 13 |
| Missense_Mutation | 16460 |
| Nonsense_Mutation | 1024 |
| Nonstop_Mutation | 13 |
| Silent | 6454 |
| Splice_Site | 453 |
| Translation_Start_Site | 46 |
| Total | 25637 |
Table 2. Get Full Table A breakdown of mutation rates per category discovered for this individual set.
| category | n | N | rate | rate_per_mb | relative_rate | exp_ns_s_ratio |
|---|---|---|---|---|---|---|
| *CpG->T | 5399 | 352259750 | 0.000015 | 15 | 5.1 | 2.1 |
| *Cp(A/C/T)->T | 3600 | 2893376300 | 1.2e-06 | 1.2 | 0.41 | 1.7 |
| A->G | 2256 | 3122700650 | 7.2e-07 | 0.72 | 0.24 | 2.3 |
| transver | 5250 | 6368336700 | 8.2e-07 | 0.82 | 0.27 | 5 |
| indel+null | 2587 | 6368336700 | 4.1e-07 | 0.41 | 0.13 | NaN |
| double_null | 89 | 6368336700 | 1.4e-08 | 0.014 | 0.0046 | NaN |
| Total | 19181 | 6368336700 | 3e-06 | 3 | 1 | 3.5 |
The x axis represents the samples. The y axis represents the exons, one row per exon, and they are sorted by average coverage across samples. For exons with exactly the same average coverage, they are sorted next by the %GC of the exon. (The secondary sort is especially useful for the zero-coverage exons at the bottom).
Figure 1.
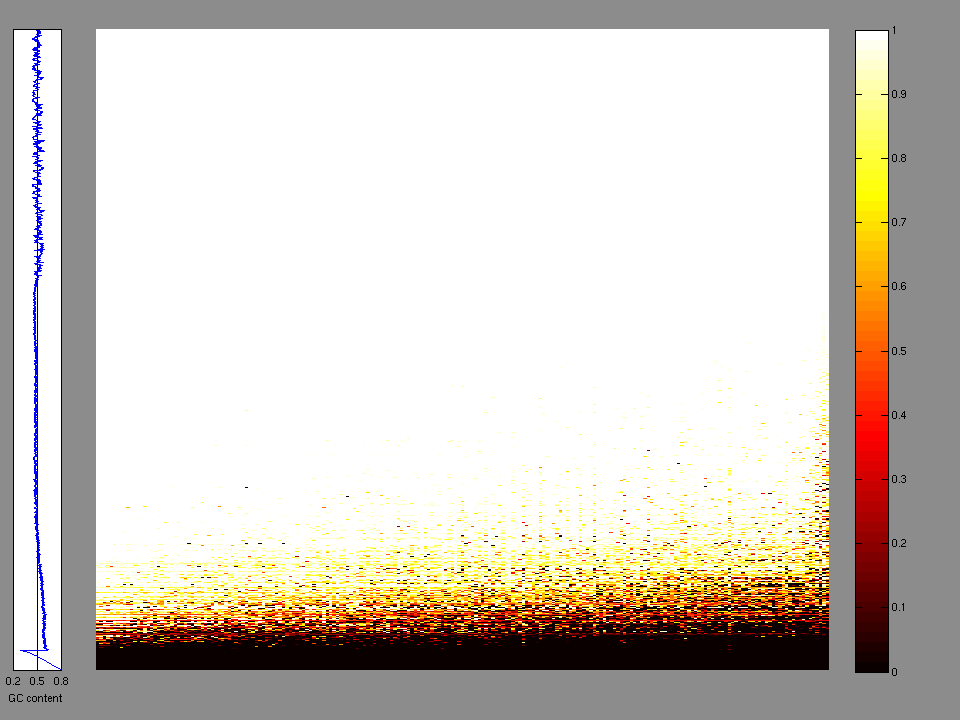
Figure 2. Patients counts and rates file used to generate this plot: LGG-TP.patients.counts_and_rates.txt
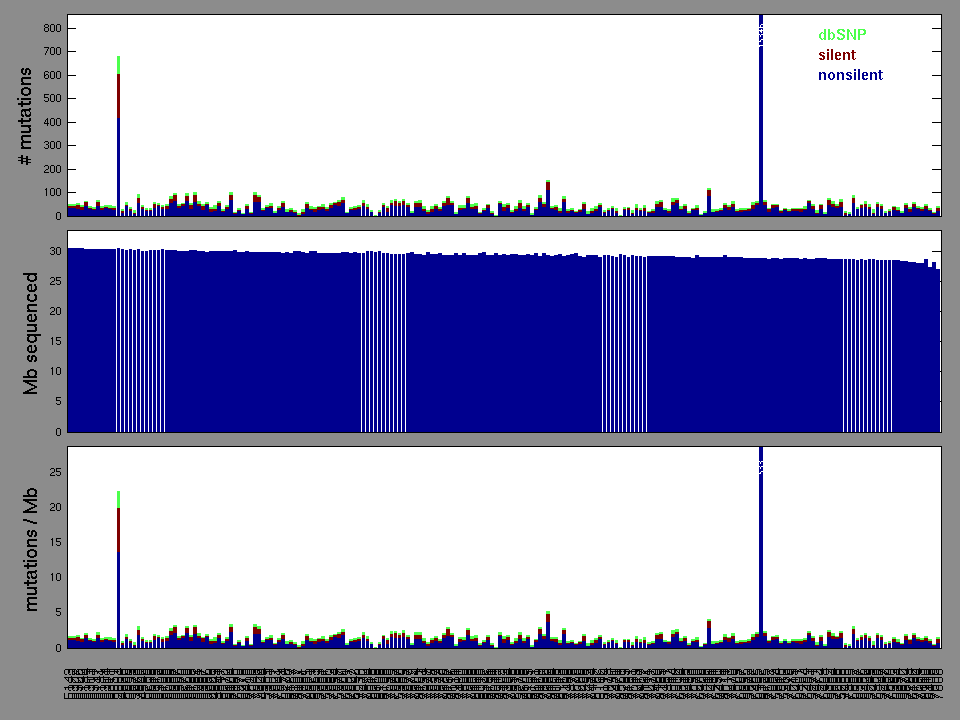
Figure 3. Needs description.

Figure 4. Needs description.

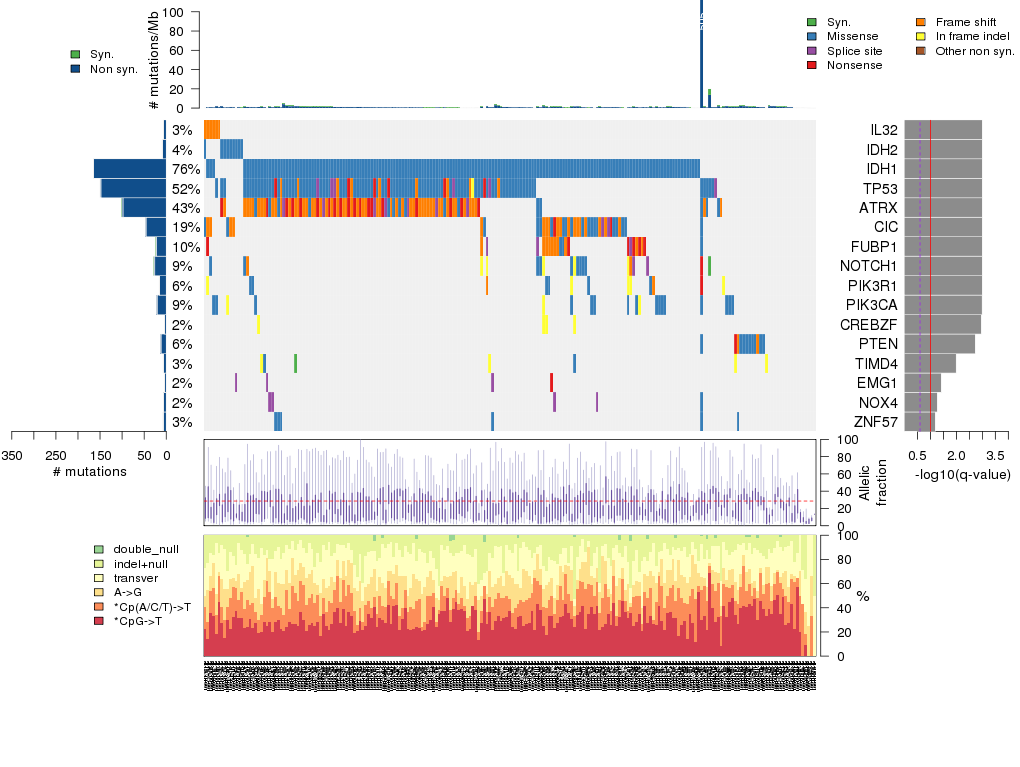
Figure 5. Get High-res Image The matrix in the center of the figure represents individual mutations in patient samples, color-coded by type of mutation, for the significantly mutated genes. The rate of synonymous and non-synonymous mutations is displayed at the top of the matrix. The barplot on the left of the matrix shows the number of mutations in each gene. The percentages represent the fraction of tumors with at least one mutation in the specified gene. The barplot to the right of the matrix displays the q-values for the most significantly mutated genes. The purple boxplots below the matrix (only displayed if required columns are present in the provided MAF) represent the distributions of allelic fractions observed in each sample. The plot at the bottom represents the base substitution distribution of individual samples, using the same categories that were used to calculate significance.
Column Descriptions:
-
N = number of sequenced bases in this gene across the individual set
-
n = number of (nonsilent) mutations in this gene across the individual set
-
npat = number of patients (individuals) with at least one nonsilent mutation
-
nsite = number of unique sites having a non-silent mutation
-
nsil = number of silent mutations in this gene across the individual set
-
n1 = number of nonsilent mutations of type: *CpG->T
-
n2 = number of nonsilent mutations of type: *Cp(A/C/T)->T
-
n3 = number of nonsilent mutations of type: A->G
-
n4 = number of nonsilent mutations of type: transver
-
n5 = number of nonsilent mutations of type: indel+null
-
n6 = number of nonsilent mutations of type: double_null
-
p_cons = p-value for enrichment of mutations at evolutionarily most-conserved sites in gene
-
p_joint = p-value for clustering + conservation
-
p = p-value (overall)
-
q = q-value, False Discovery Rate (Benjamini-Hochberg procedure)
Table 3. Get Full Table A Ranked List of Significantly Mutated Genes. Number of significant genes found: 16. Number of genes displayed: 35. Click on a gene name to display its stick figure depicting the distribution of mutations and mutation types across the chosen gene (this feature may not be available for all significant genes).
| rank | gene | description | N | n | npat | nsite | nsil | n1 | n2 | n3 | n4 | n5 | n6 | p_cons | p_joint | p_cv | p | q |
|---|---|---|---|---|---|---|---|---|---|---|---|---|---|---|---|---|---|---|
| 1 | IL32 | interleukin 32 | 113894 | 6 | 6 | 1 | 0 | 0 | 0 | 0 | 0 | 6 | 0 | 0.98 | 0 | 4.7e-09 | 0 | 0 |
| 2 | IDH2 | isocitrate dehydrogenase 2 (NADP+), mitochondrial | 252948 | 9 | 9 | 3 | 0 | 0 | 6 | 0 | 3 | 0 | 0 | 1 | 0 | 0.000074 | 0 | 0 |
| 3 | IDH1 | isocitrate dehydrogenase 1 (NADP+), soluble | 275139 | 165 | 165 | 2 | 0 | 155 | 0 | 0 | 10 | 0 | 0 | 1 | 0 | 3.3e-16 | 0 | 0 |
| 4 | TP53 | tumor protein p53 | 267086 | 148 | 113 | 76 | 2 | 58 | 15 | 21 | 31 | 20 | 3 | 0 | 0 | 1.1e-16 | 0 | 0 |
| 5 | ATRX | alpha thalassemia/mental retardation syndrome X-linked (RAD54 homolog, S. cerevisiae) | 1632339 | 98 | 93 | 87 | 3 | 2 | 4 | 8 | 6 | 73 | 5 | 0.46 | 0.23 | 2.6e-15 | 2.1e-14 | 7.5e-11 |
| 6 | CIC | capicua homolog (Drosophila) | 909824 | 46 | 41 | 39 | 0 | 17 | 1 | 1 | 5 | 21 | 1 | 0.88 | 0.2 | 6.2e-15 | 4.3e-14 | 1.3e-10 |
| 7 | FUBP1 | far upstream element (FUSE) binding protein 1 | 428208 | 22 | 22 | 21 | 2 | 0 | 0 | 1 | 2 | 19 | 0 | 0.9 | 0.56 | 8.5e-15 | 1.6e-13 | 4.2e-10 |
| 8 | NOTCH1 | Notch homolog 1, translocation-associated (Drosophila) | 1333631 | 26 | 19 | 23 | 3 | 4 | 3 | 1 | 6 | 9 | 3 | 0.027 | 0.000043 | 1.4e-09 | 1.9e-12 | 4.4e-09 |
| 9 | PIK3R1 | phosphoinositide-3-kinase, regulatory subunit 1 (alpha) | 512641 | 15 | 14 | 13 | 1 | 1 | 2 | 3 | 0 | 9 | 0 | 0.85 | 0.021 | 4.7e-09 | 2.4e-09 | 4.8e-06 |
| 10 | PIK3CA | phosphoinositide-3-kinase, catalytic, alpha polypeptide | 712138 | 21 | 19 | 13 | 0 | 0 | 7 | 7 | 3 | 4 | 0 | 0.016 | 0.02 | 1.7e-08 | 7.6e-09 | 0.000014 |
| 11 | CREBZF | CREB/ATF bZIP transcription factor | 224089 | 4 | 4 | 1 | 0 | 0 | 0 | 0 | 0 | 4 | 0 | 0.32 | 6e-06 | 0.00044 | 5.4e-08 | 0.000089 |
| 12 | PTEN | phosphatase and tensin homolog (mutated in multiple advanced cancers 1) | 263317 | 12 | 12 | 12 | 0 | 1 | 1 | 1 | 6 | 3 | 0 | 0.26 | 0.43 | 7.1e-08 | 5.6e-07 | 0.00084 |
| 13 | TIMD4 | T-cell immunoglobulin and mucin domain containing 4 | 254458 | 6 | 6 | 3 | 1 | 0 | 1 | 0 | 1 | 4 | 0 | 0.58 | 0.012 | 0.000036 | 6.6e-06 | 0.0091 |
| 14 | EMG1 | EMG1 nucleolar protein homolog (S. cerevisiae) | 148063 | 4 | 4 | 2 | 0 | 0 | 0 | 0 | 0 | 4 | 0 | 0.74 | 0.13 | 0.000015 | 0.000028 | 0.036 |
| 15 | NOX4 | NADPH oxidase 4 | 390044 | 6 | 5 | 3 | 0 | 0 | 1 | 1 | 0 | 4 | 0 | 0.54 | 0.0072 | 0.00045 | 0.000044 | 0.053 |
| 16 | ZNF57 | zinc finger protein 57 | 363748 | 7 | 6 | 4 | 0 | 1 | 1 | 1 | 4 | 0 | 0 | 1 | 0.00014 | 0.03 | 0.000056 | 0.064 |
| 17 | SCAF1 | SR-related CTD-associated factor 1 | 428190 | 4 | 4 | 2 | 1 | 1 | 0 | 0 | 0 | 3 | 0 | 0.18 | 0.0031 | 0.025 | 0.0008 | 0.84 |
| 18 | SMARCA4 | SWI/SNF related, matrix associated, actin dependent regulator of chromatin, subfamily a, member 4 | 980041 | 13 | 13 | 11 | 4 | 3 | 0 | 1 | 5 | 4 | 0 | 0.37 | 0.052 | 0.0015 | 0.00081 | 0.84 |
| 19 | CRIPAK | cysteine-rich PAK1 inhibitor | 288496 | 5 | 5 | 4 | 2 | 1 | 0 | 0 | 1 | 3 | 0 | 0.61 | 0.48 | 0.00017 | 0.00084 | 0.84 |
| 20 | TCF12 | transcription factor 12 (HTF4, helix-loop-helix transcription factors 4) | 492075 | 10 | 9 | 9 | 0 | 0 | 0 | 0 | 0 | 10 | 0 | 0.33 | 0.4 | 0.00021 | 0.00085 | 0.84 |
| 21 | ZCCHC12 | zinc finger, CCHC domain containing 12 | 263212 | 3 | 3 | 1 | 0 | 3 | 0 | 0 | 0 | 0 | 0 | 0.74 | 0.0058 | 0.079 | 0.004 | 1 |
| 22 | EGFR | epidermal growth factor receptor (erythroblastic leukemia viral (v-erb-b) oncogene homolog, avian) | 854034 | 12 | 10 | 9 | 0 | 1 | 4 | 0 | 6 | 1 | 0 | 0.044 | 0.036 | 0.016 | 0.0049 | 1 |
| 23 | EIF1AX | eukaryotic translation initiation factor 1A, X-linked | 95665 | 2 | 2 | 2 | 1 | 1 | 0 | 1 | 0 | 0 | 0 | 0.35 | 0.017 | 0.041 | 0.0057 | 1 |
| 24 | C22orf33 | chromosome 22 open reading frame 33 | 127216 | 2 | 2 | 2 | 1 | 0 | 0 | 1 | 0 | 1 | 0 | 0.024 | 0.0097 | 0.071 | 0.0057 | 1 |
| 25 | CYCS | cytochrome c, somatic | 70701 | 2 | 2 | 2 | 0 | 0 | 1 | 0 | 1 | 0 | 0 | 0.069 | 0.012 | 0.077 | 0.0075 | 1 |
| 26 | ARID1A | AT rich interactive domain 1A (SWI-like) | 1260450 | 15 | 13 | 15 | 0 | 1 | 0 | 0 | 1 | 12 | 1 | 0.64 | 1 | 0.0011 | 0.0083 | 1 |
| 27 | TRDN | triadin | 211891 | 4 | 4 | 4 | 0 | 0 | 1 | 0 | 0 | 3 | 0 | 0.25 | 0.1 | 0.012 | 0.0095 | 1 |
| 28 | C3orf35 | chromosome 3 open reading frame 35 | 111237 | 3 | 3 | 3 | 0 | 0 | 0 | 2 | 0 | 1 | 0 | 0.045 | 0.092 | 0.015 | 0.01 | 1 |
| 29 | MYH4 | myosin, heavy chain 4, skeletal muscle | 1294982 | 5 | 5 | 5 | 0 | 3 | 0 | 0 | 2 | 0 | 0 | 0.0038 | 0.002 | 0.69 | 0.011 | 1 |
| 30 | ZNRF2 | zinc and ring finger 2 | 62533 | 3 | 2 | 3 | 0 | 1 | 0 | 0 | 0 | 2 | 0 | 0.35 | 1 | 0.0017 | 0.013 | 1 |
| 31 | SLC44A4 | solute carrier family 44, member 4 | 461047 | 3 | 3 | 2 | 0 | 0 | 1 | 0 | 0 | 2 | 0 | 0.59 | 0.0068 | 0.27 | 0.013 | 1 |
| 32 | MUC7 | mucin 7, secreted | 247807 | 8 | 5 | 7 | 0 | 1 | 2 | 5 | 0 | 0 | 0 | 0.49 | 0.35 | 0.0062 | 0.015 | 1 |
| 33 | C5orf34 | chromosome 5 open reading frame 34 | 423786 | 2 | 2 | 2 | 1 | 0 | 0 | 0 | 1 | 1 | 0 | 0.0095 | 0.0039 | 0.59 | 0.016 | 1 |
| 34 | FAM64A | family with sequence similarity 64, member A | 157706 | 2 | 2 | 2 | 0 | 1 | 0 | 1 | 0 | 0 | 0 | 0.027 | 0.015 | 0.18 | 0.018 | 1 |
| 35 | TRAPPC9 | trafficking protein particle complex 9 | 707047 | 3 | 1 | 3 | 0 | 3 | 0 | 0 | 0 | 0 | 0 | 0.78 | 0.0029 | 0.99 | 0.019 | 1 |
Figure S1. This figure depicts the distribution of mutations and mutation types across the IL32 significant gene.
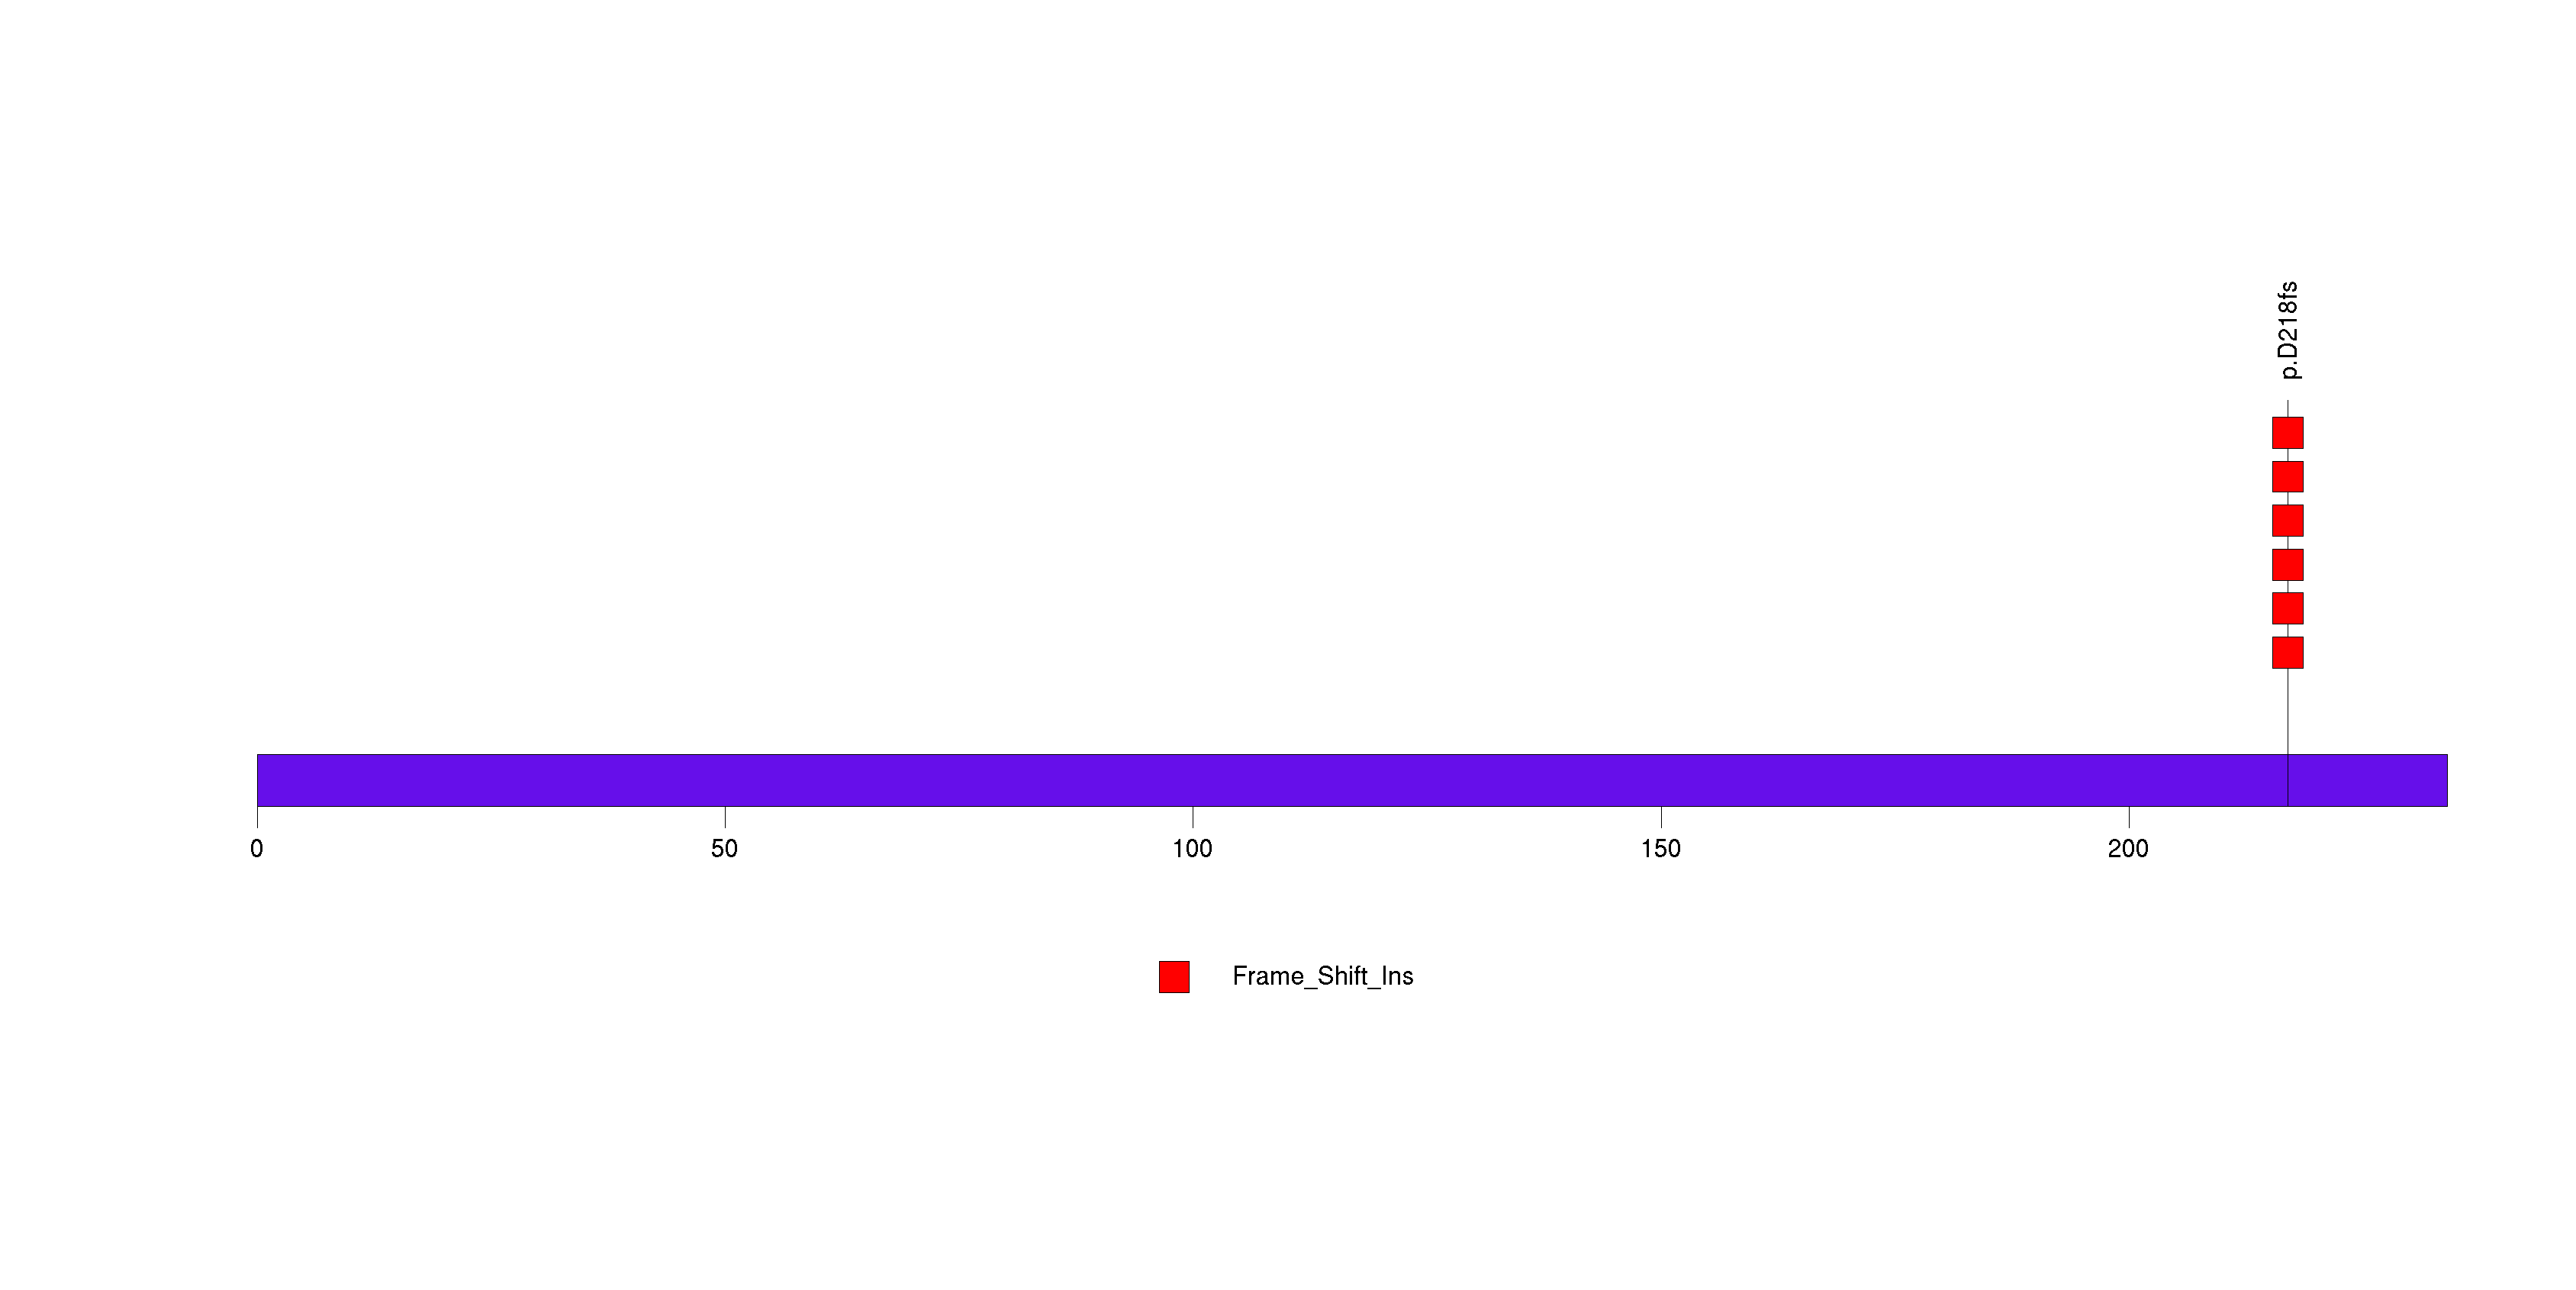
Figure S2. This figure depicts the distribution of mutations and mutation types across the IDH2 significant gene.

Figure S3. This figure depicts the distribution of mutations and mutation types across the IDH1 significant gene.
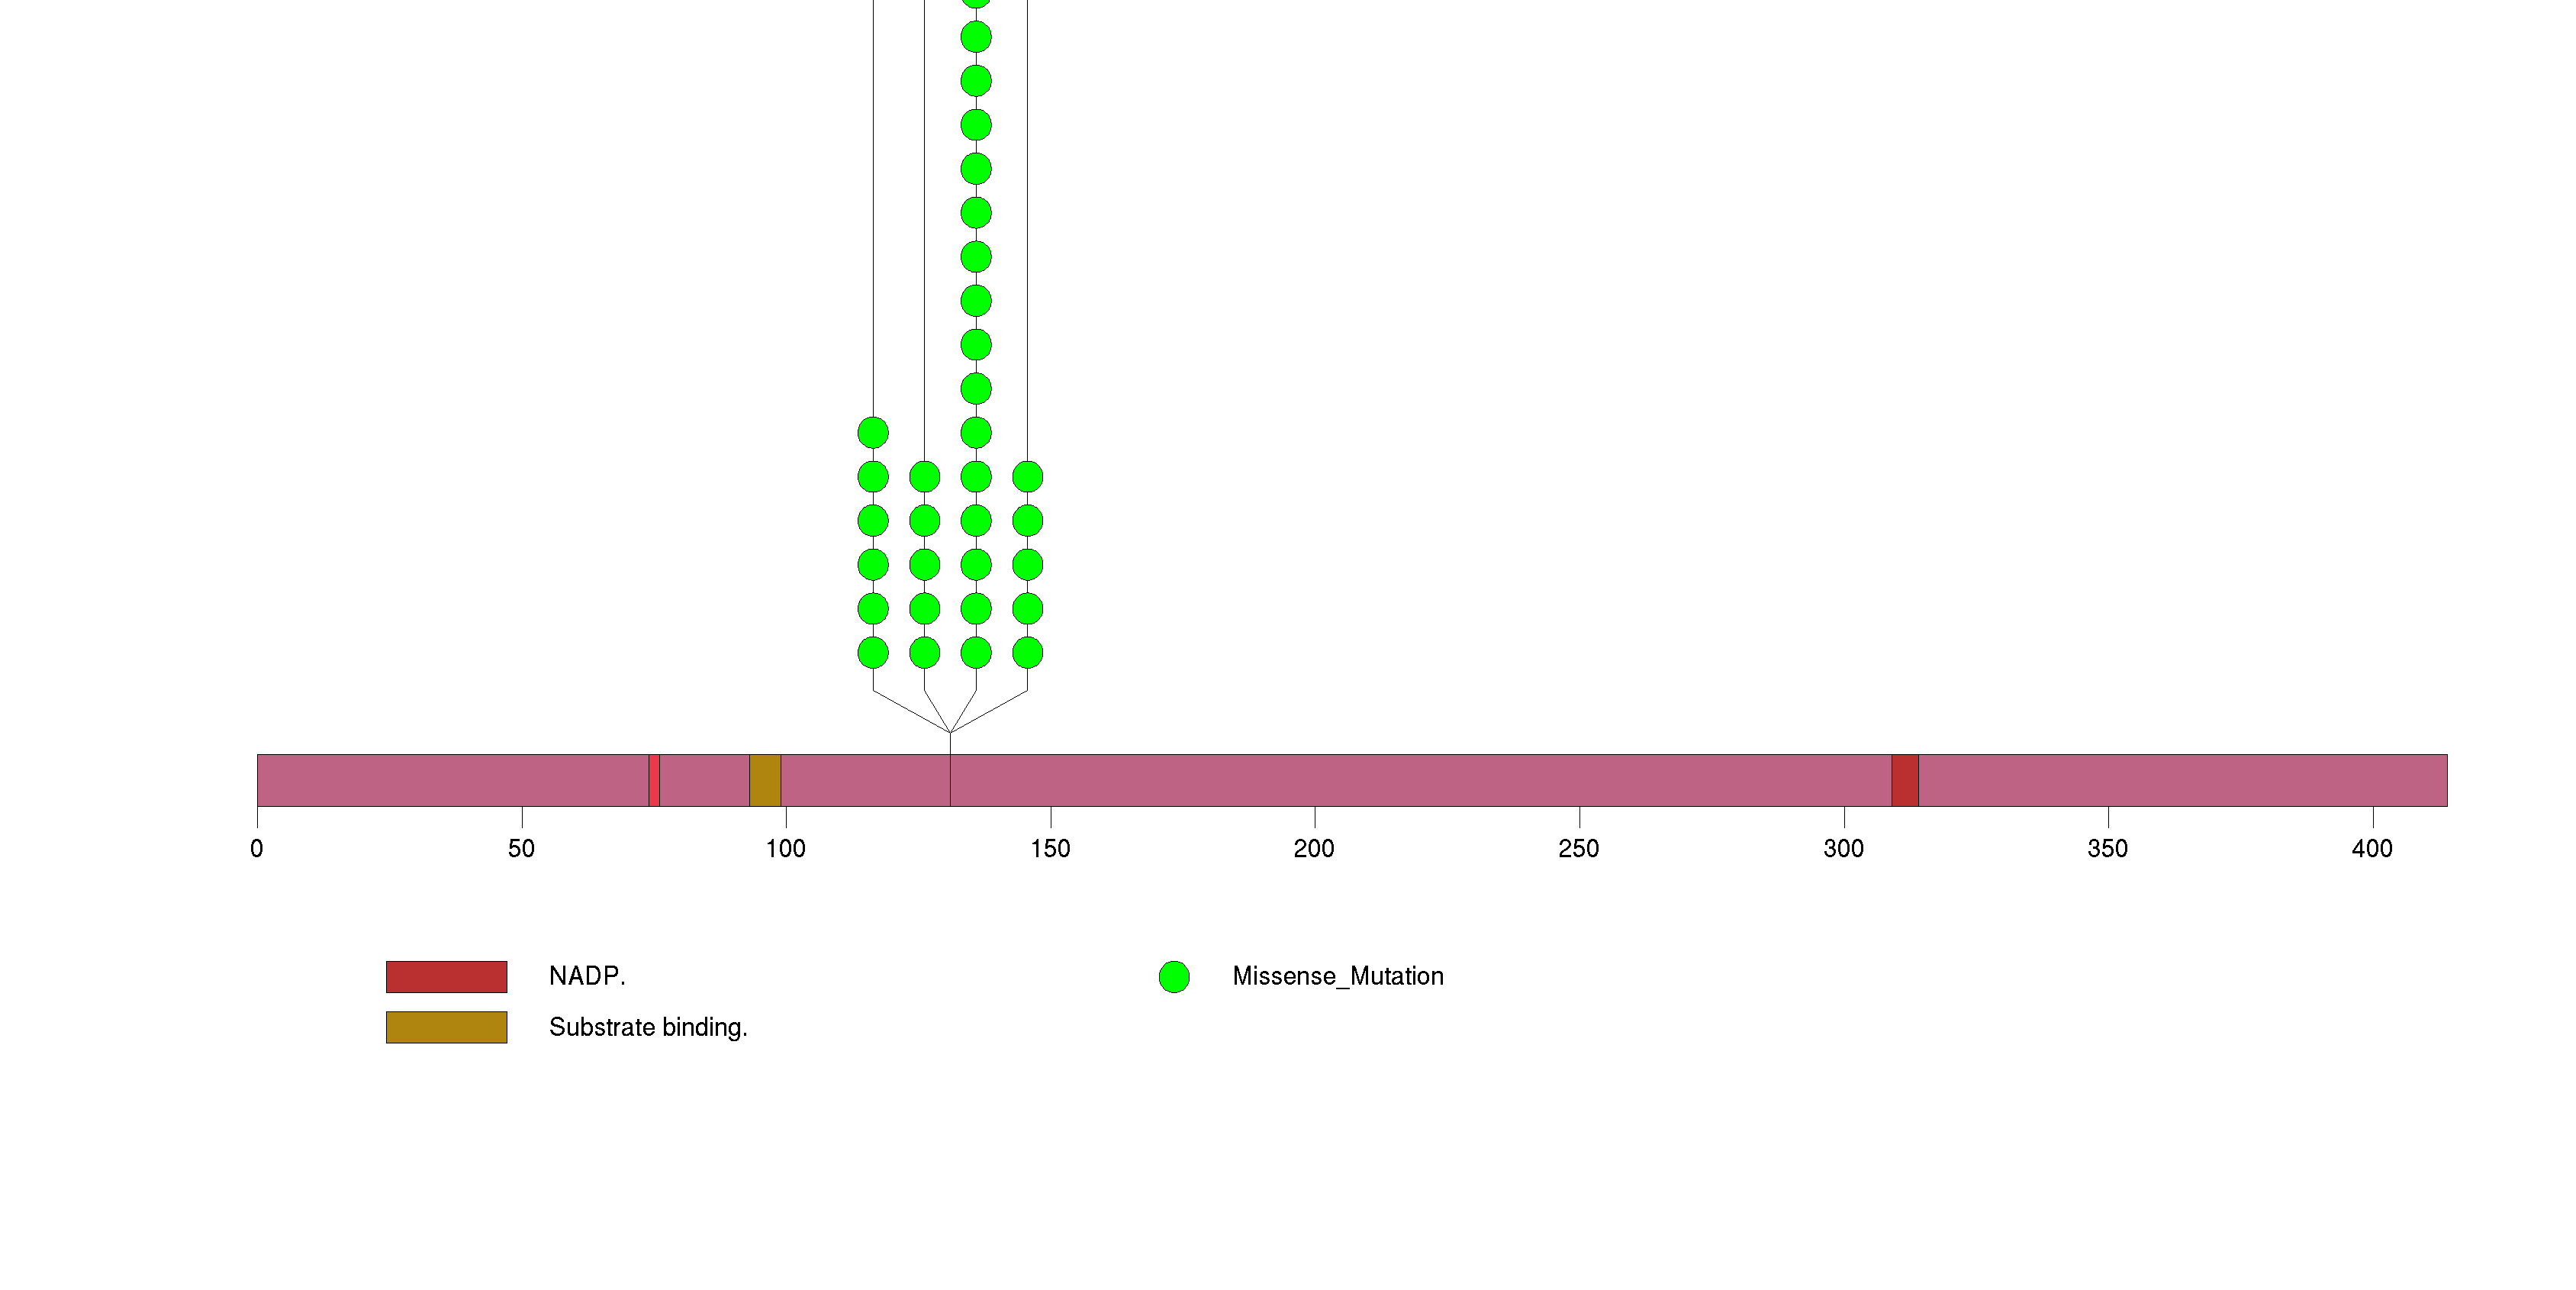
Figure S4. This figure depicts the distribution of mutations and mutation types across the TP53 significant gene.
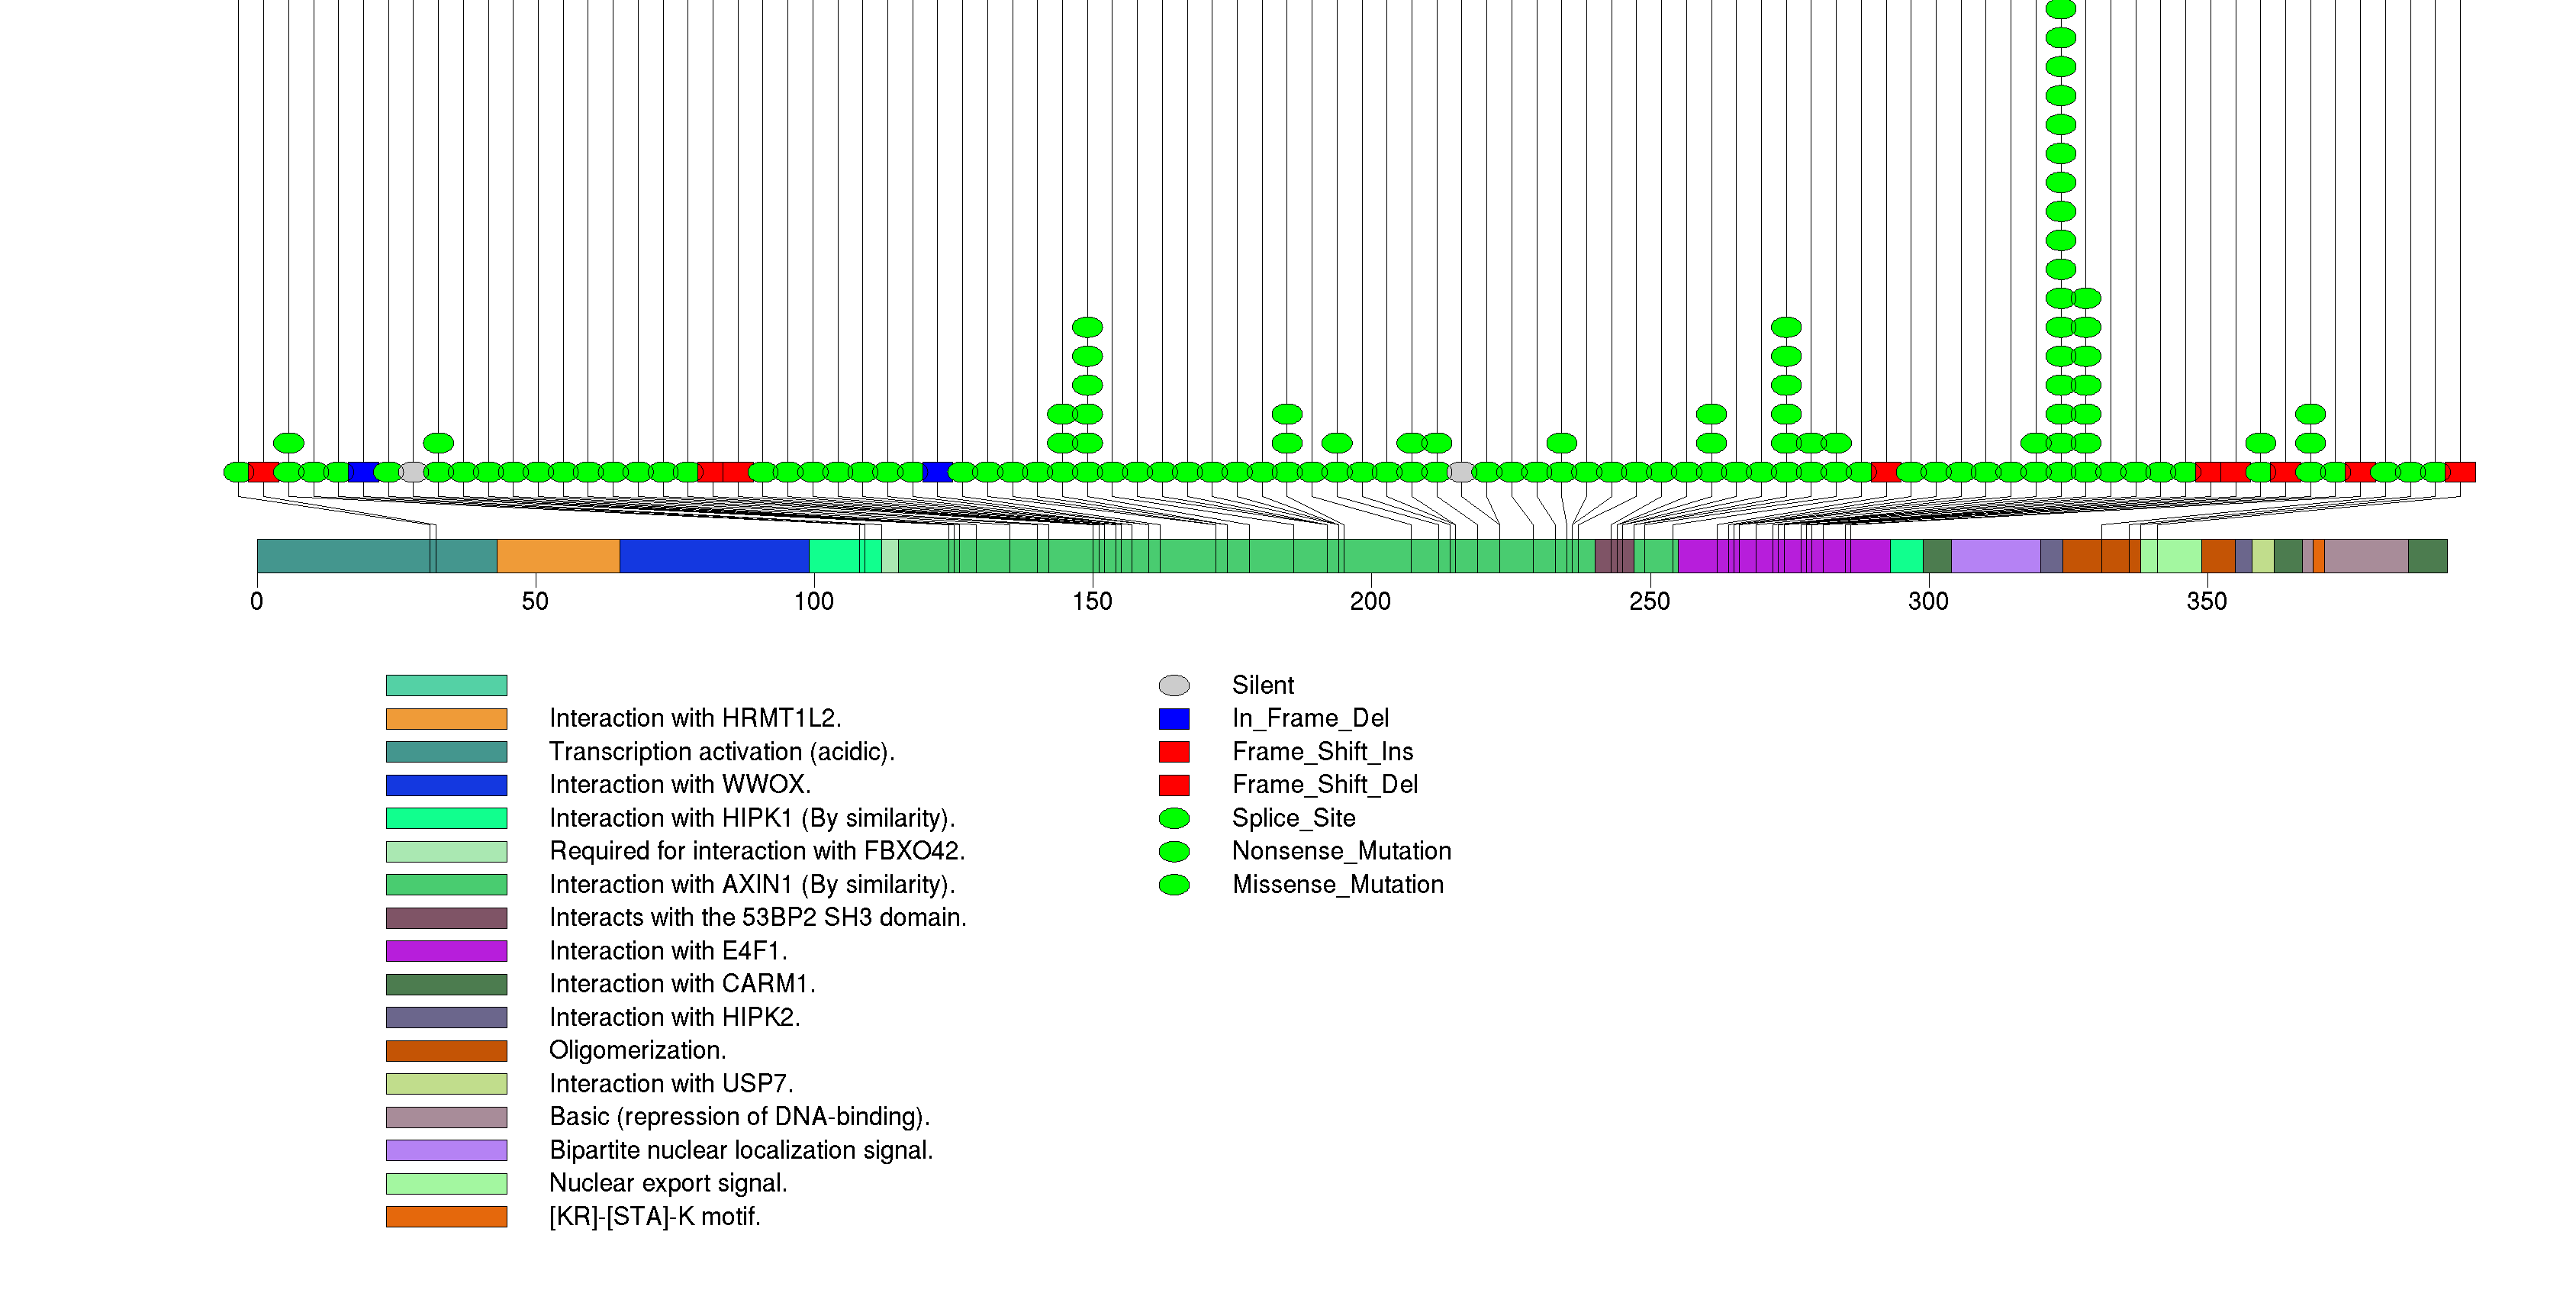
Figure S5. This figure depicts the distribution of mutations and mutation types across the ATRX significant gene.
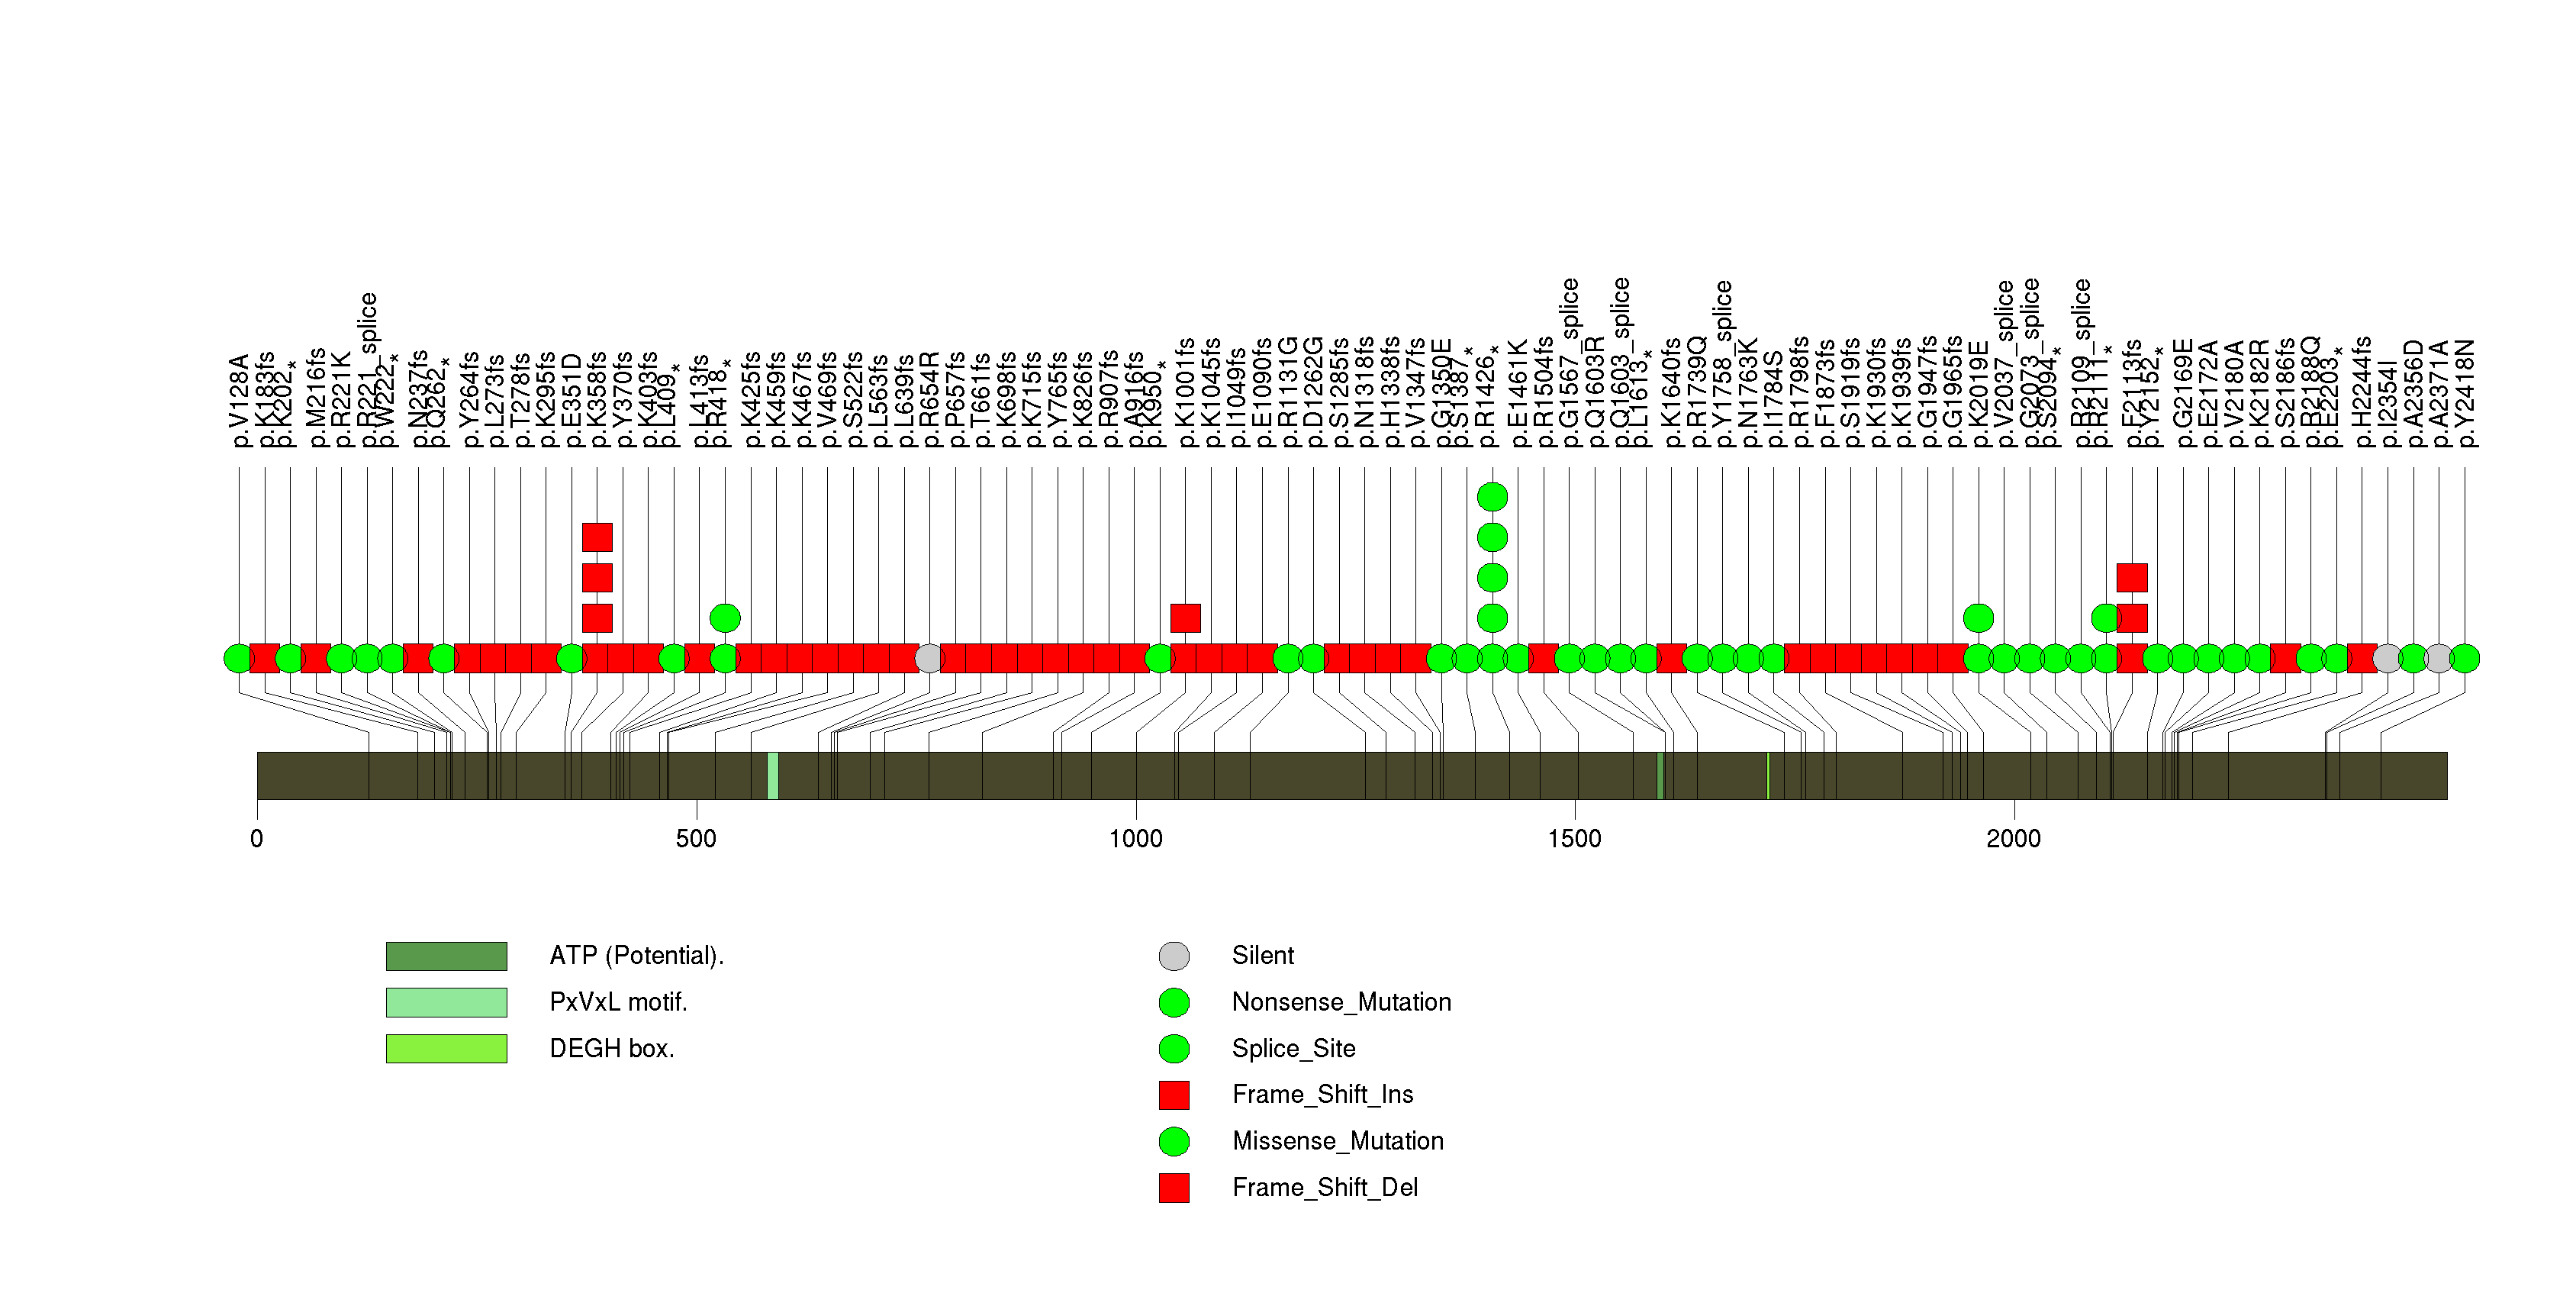
Figure S6. This figure depicts the distribution of mutations and mutation types across the CIC significant gene.
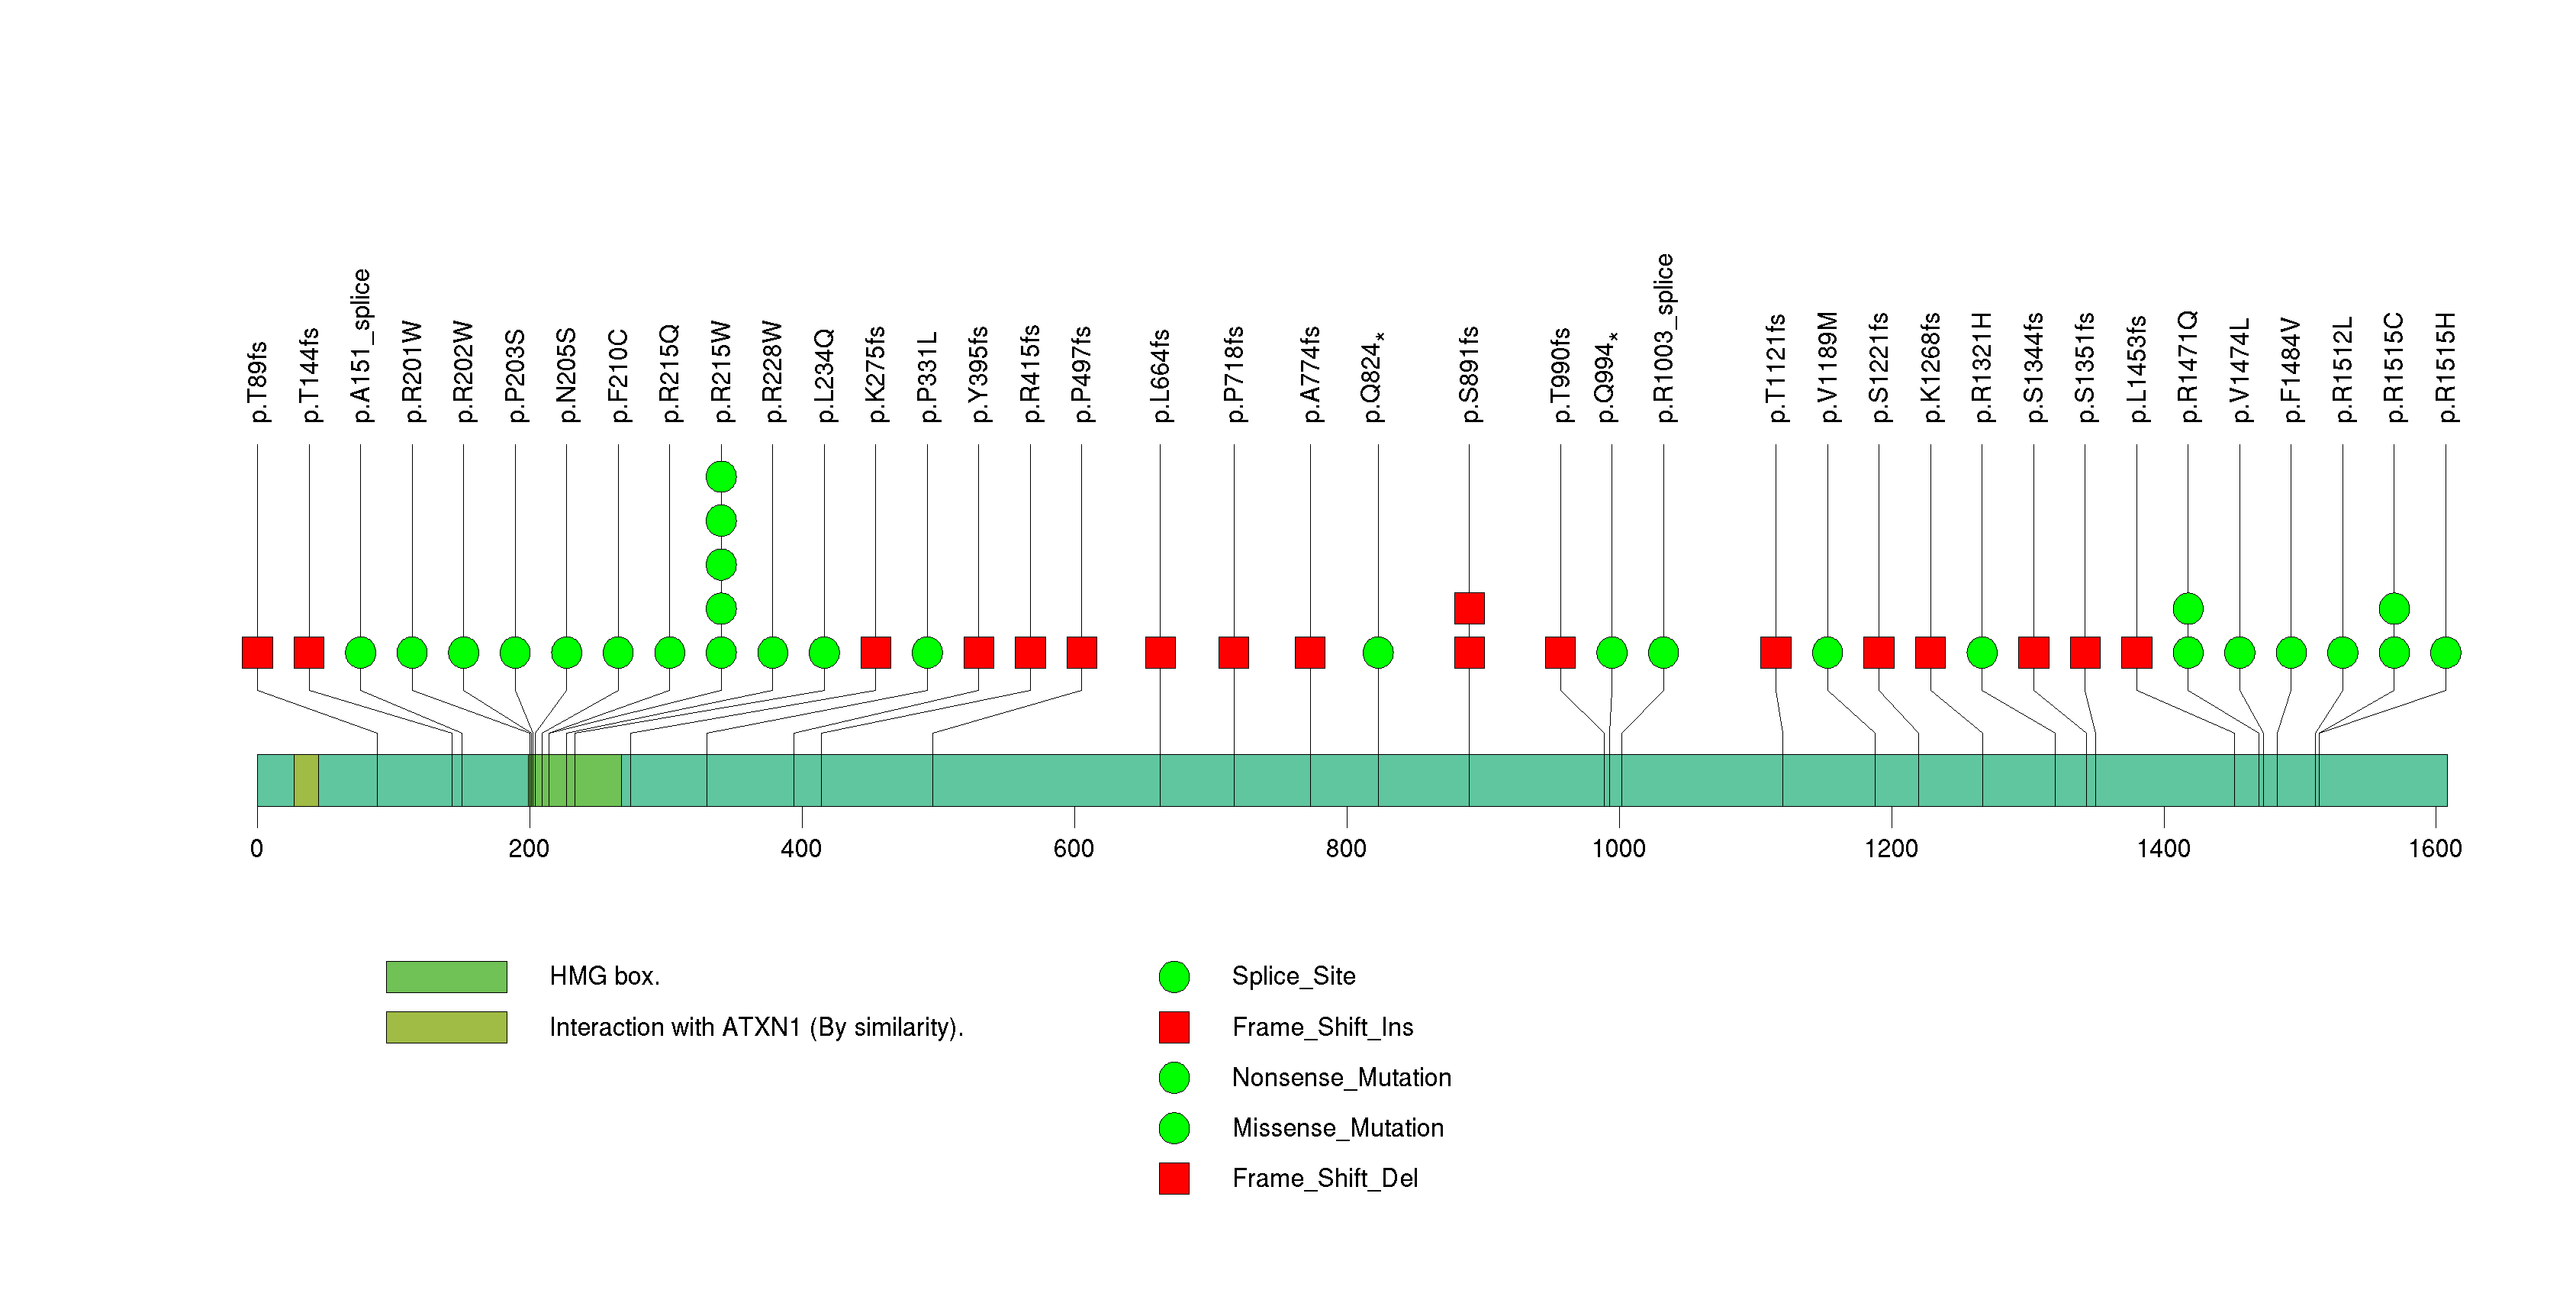
Figure S7. This figure depicts the distribution of mutations and mutation types across the FUBP1 significant gene.
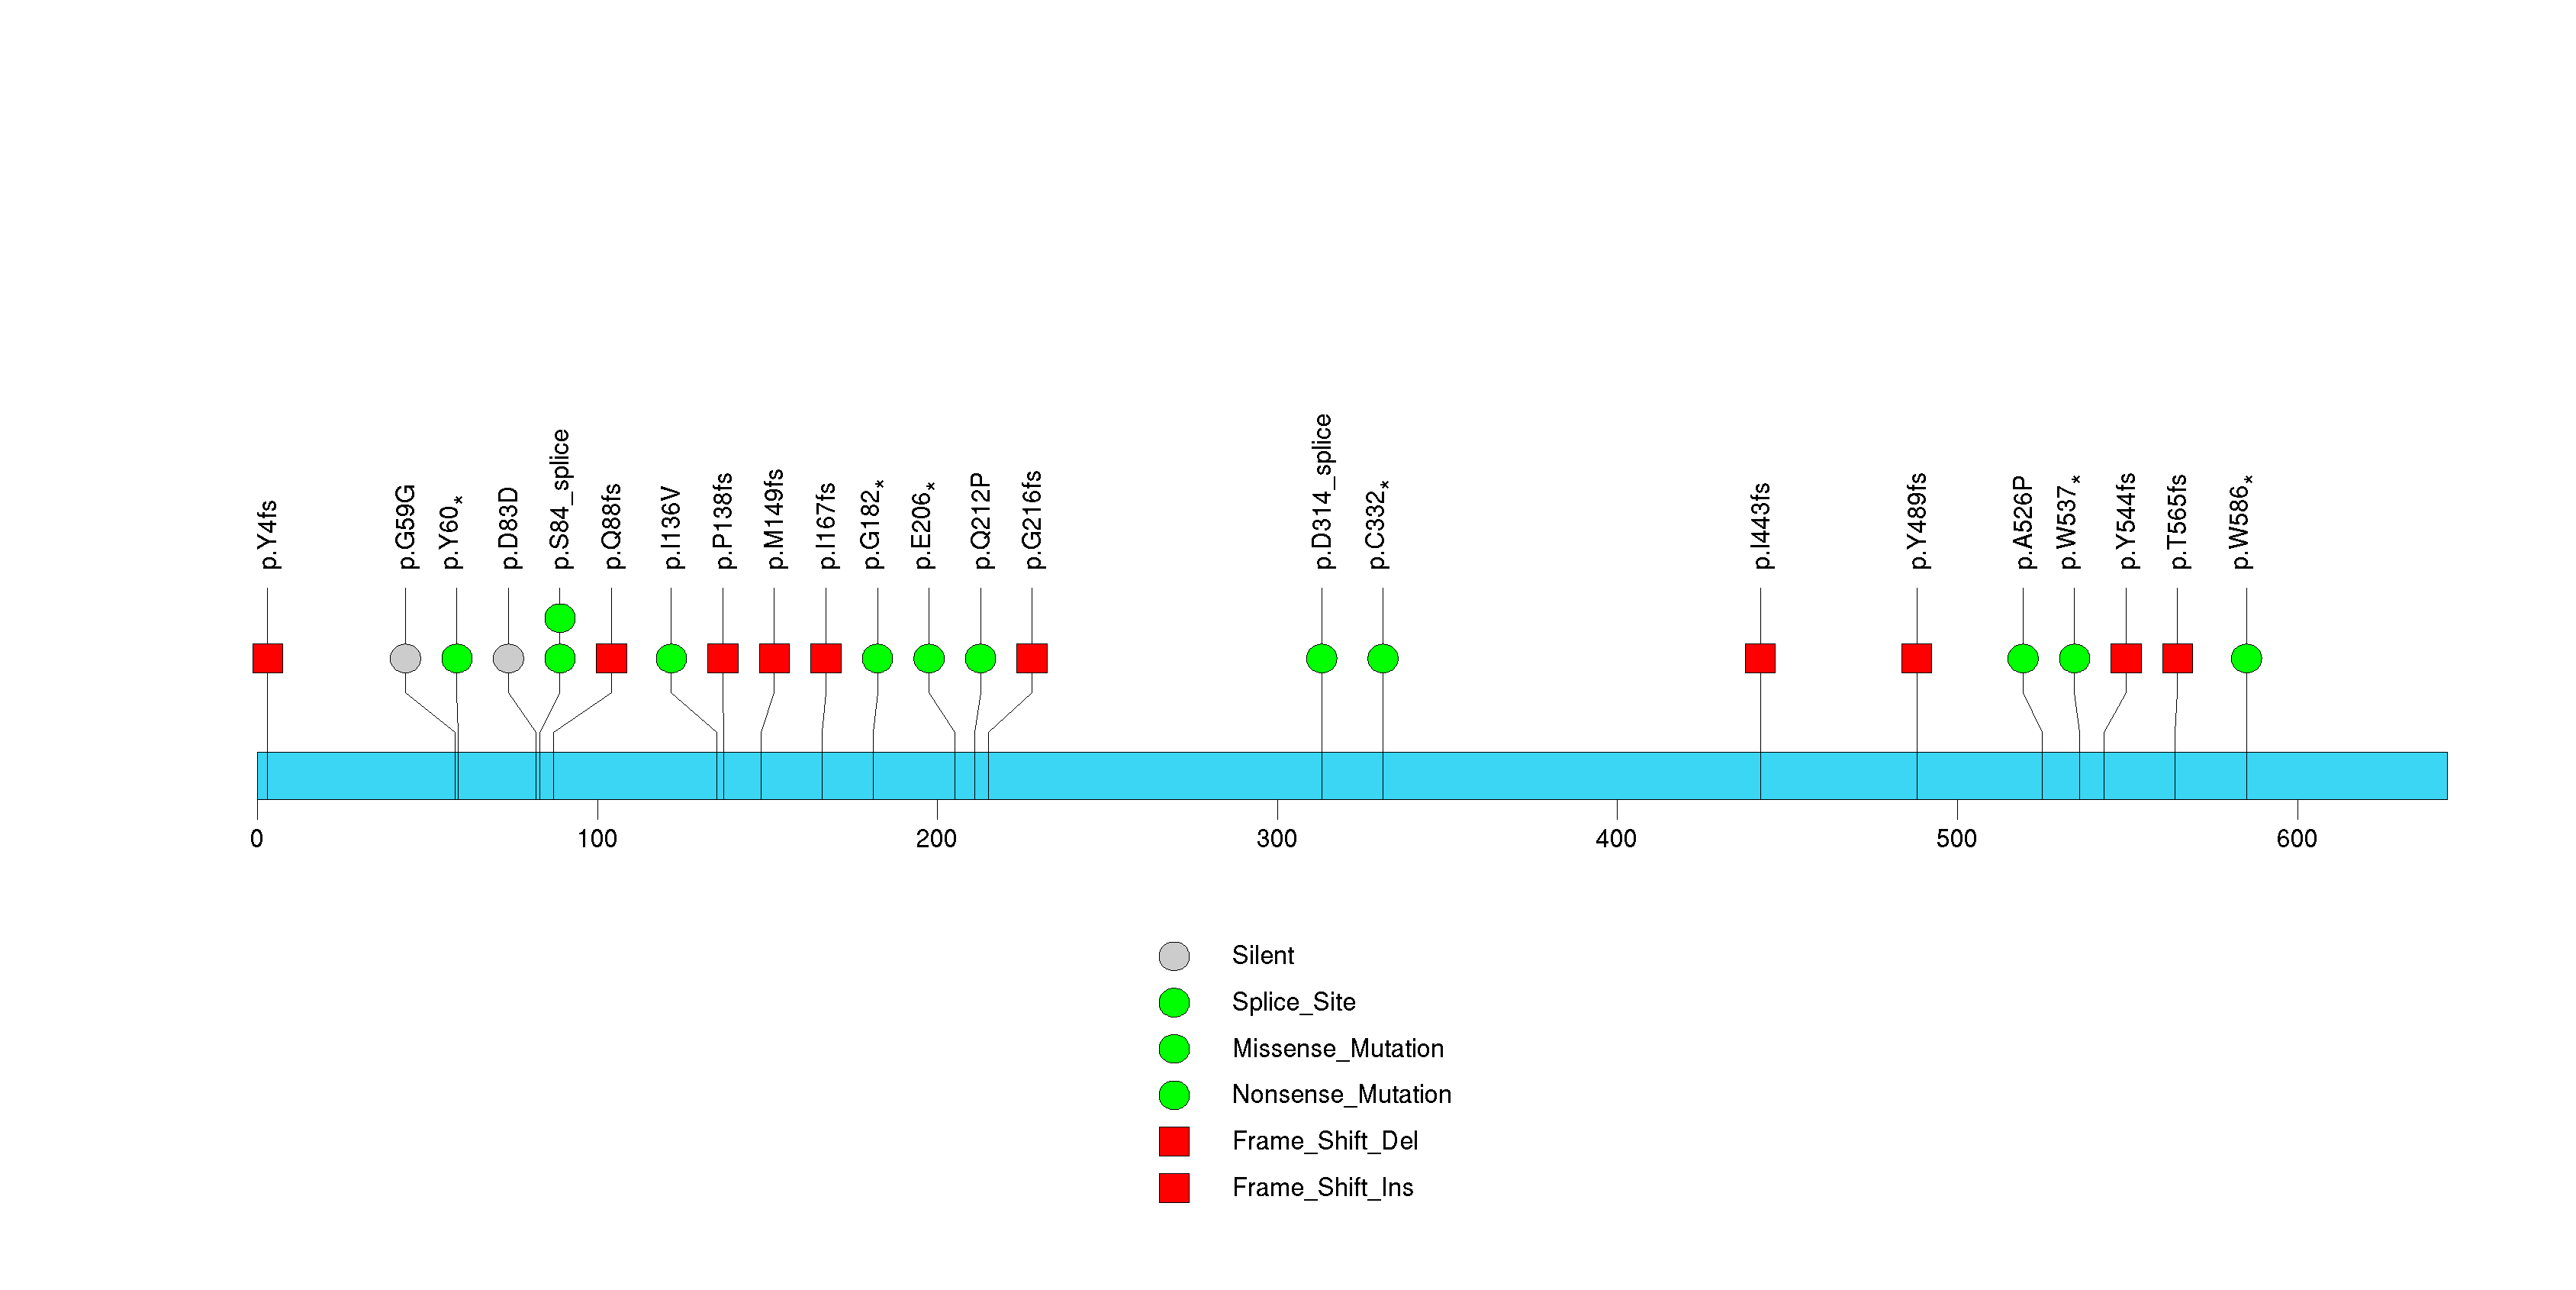
Figure S8. This figure depicts the distribution of mutations and mutation types across the NOTCH1 significant gene.
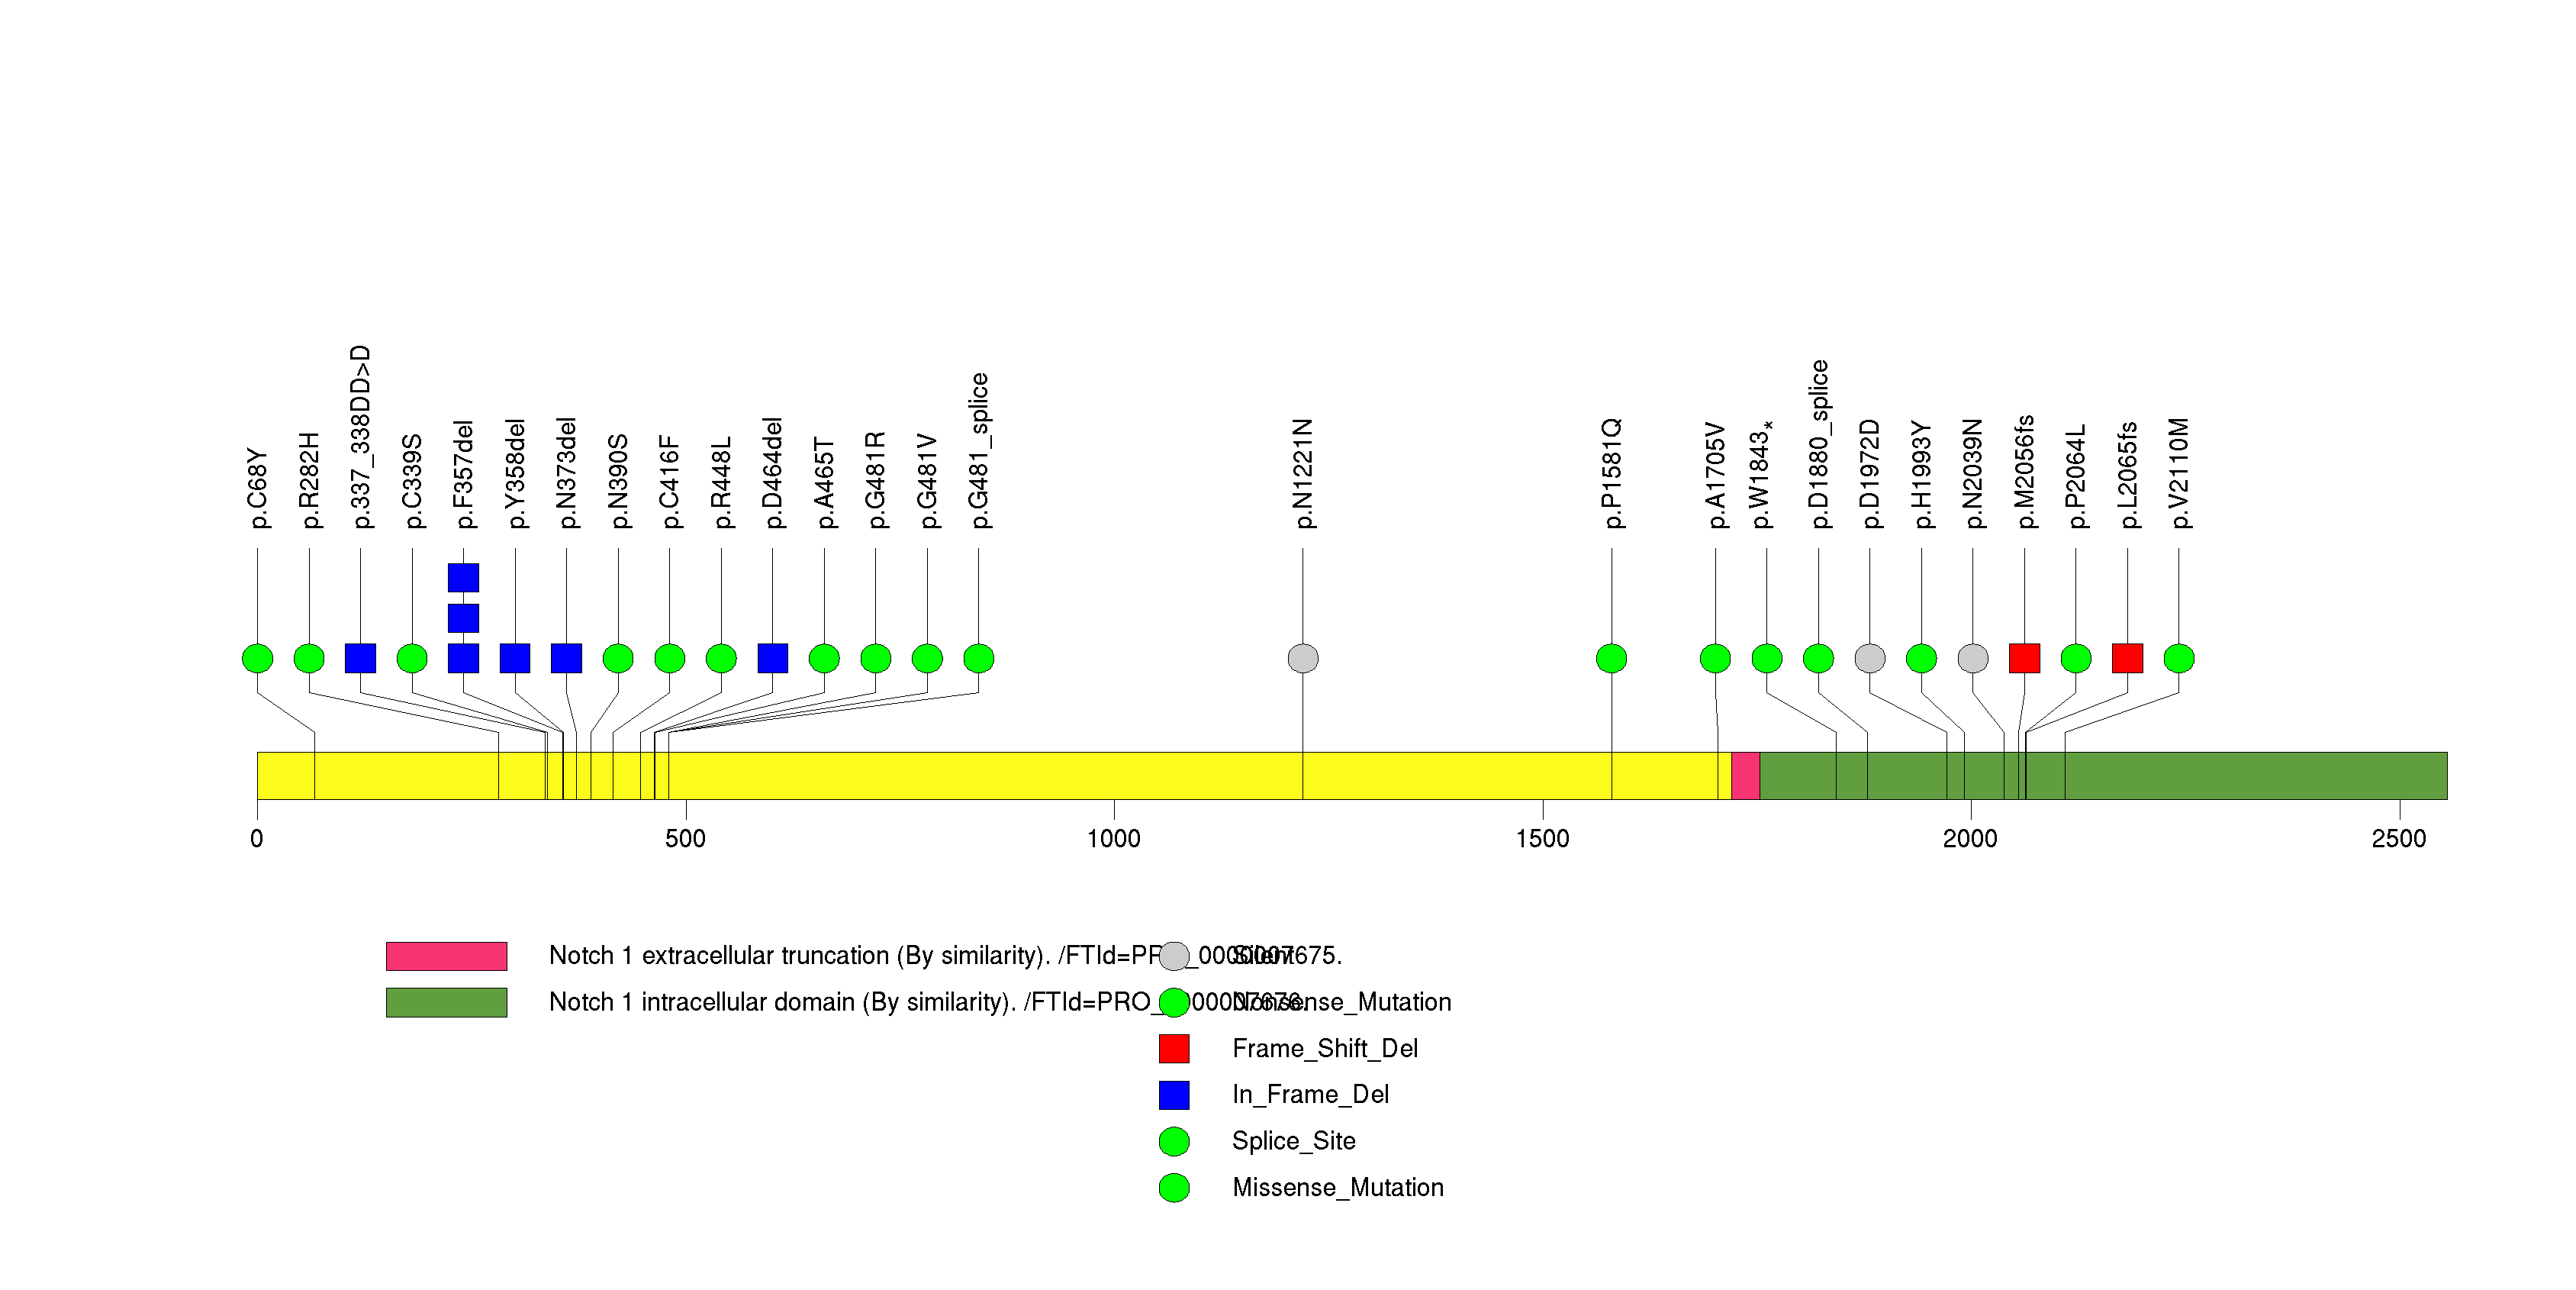
Figure S9. This figure depicts the distribution of mutations and mutation types across the PIK3R1 significant gene.

Figure S10. This figure depicts the distribution of mutations and mutation types across the PIK3CA significant gene.
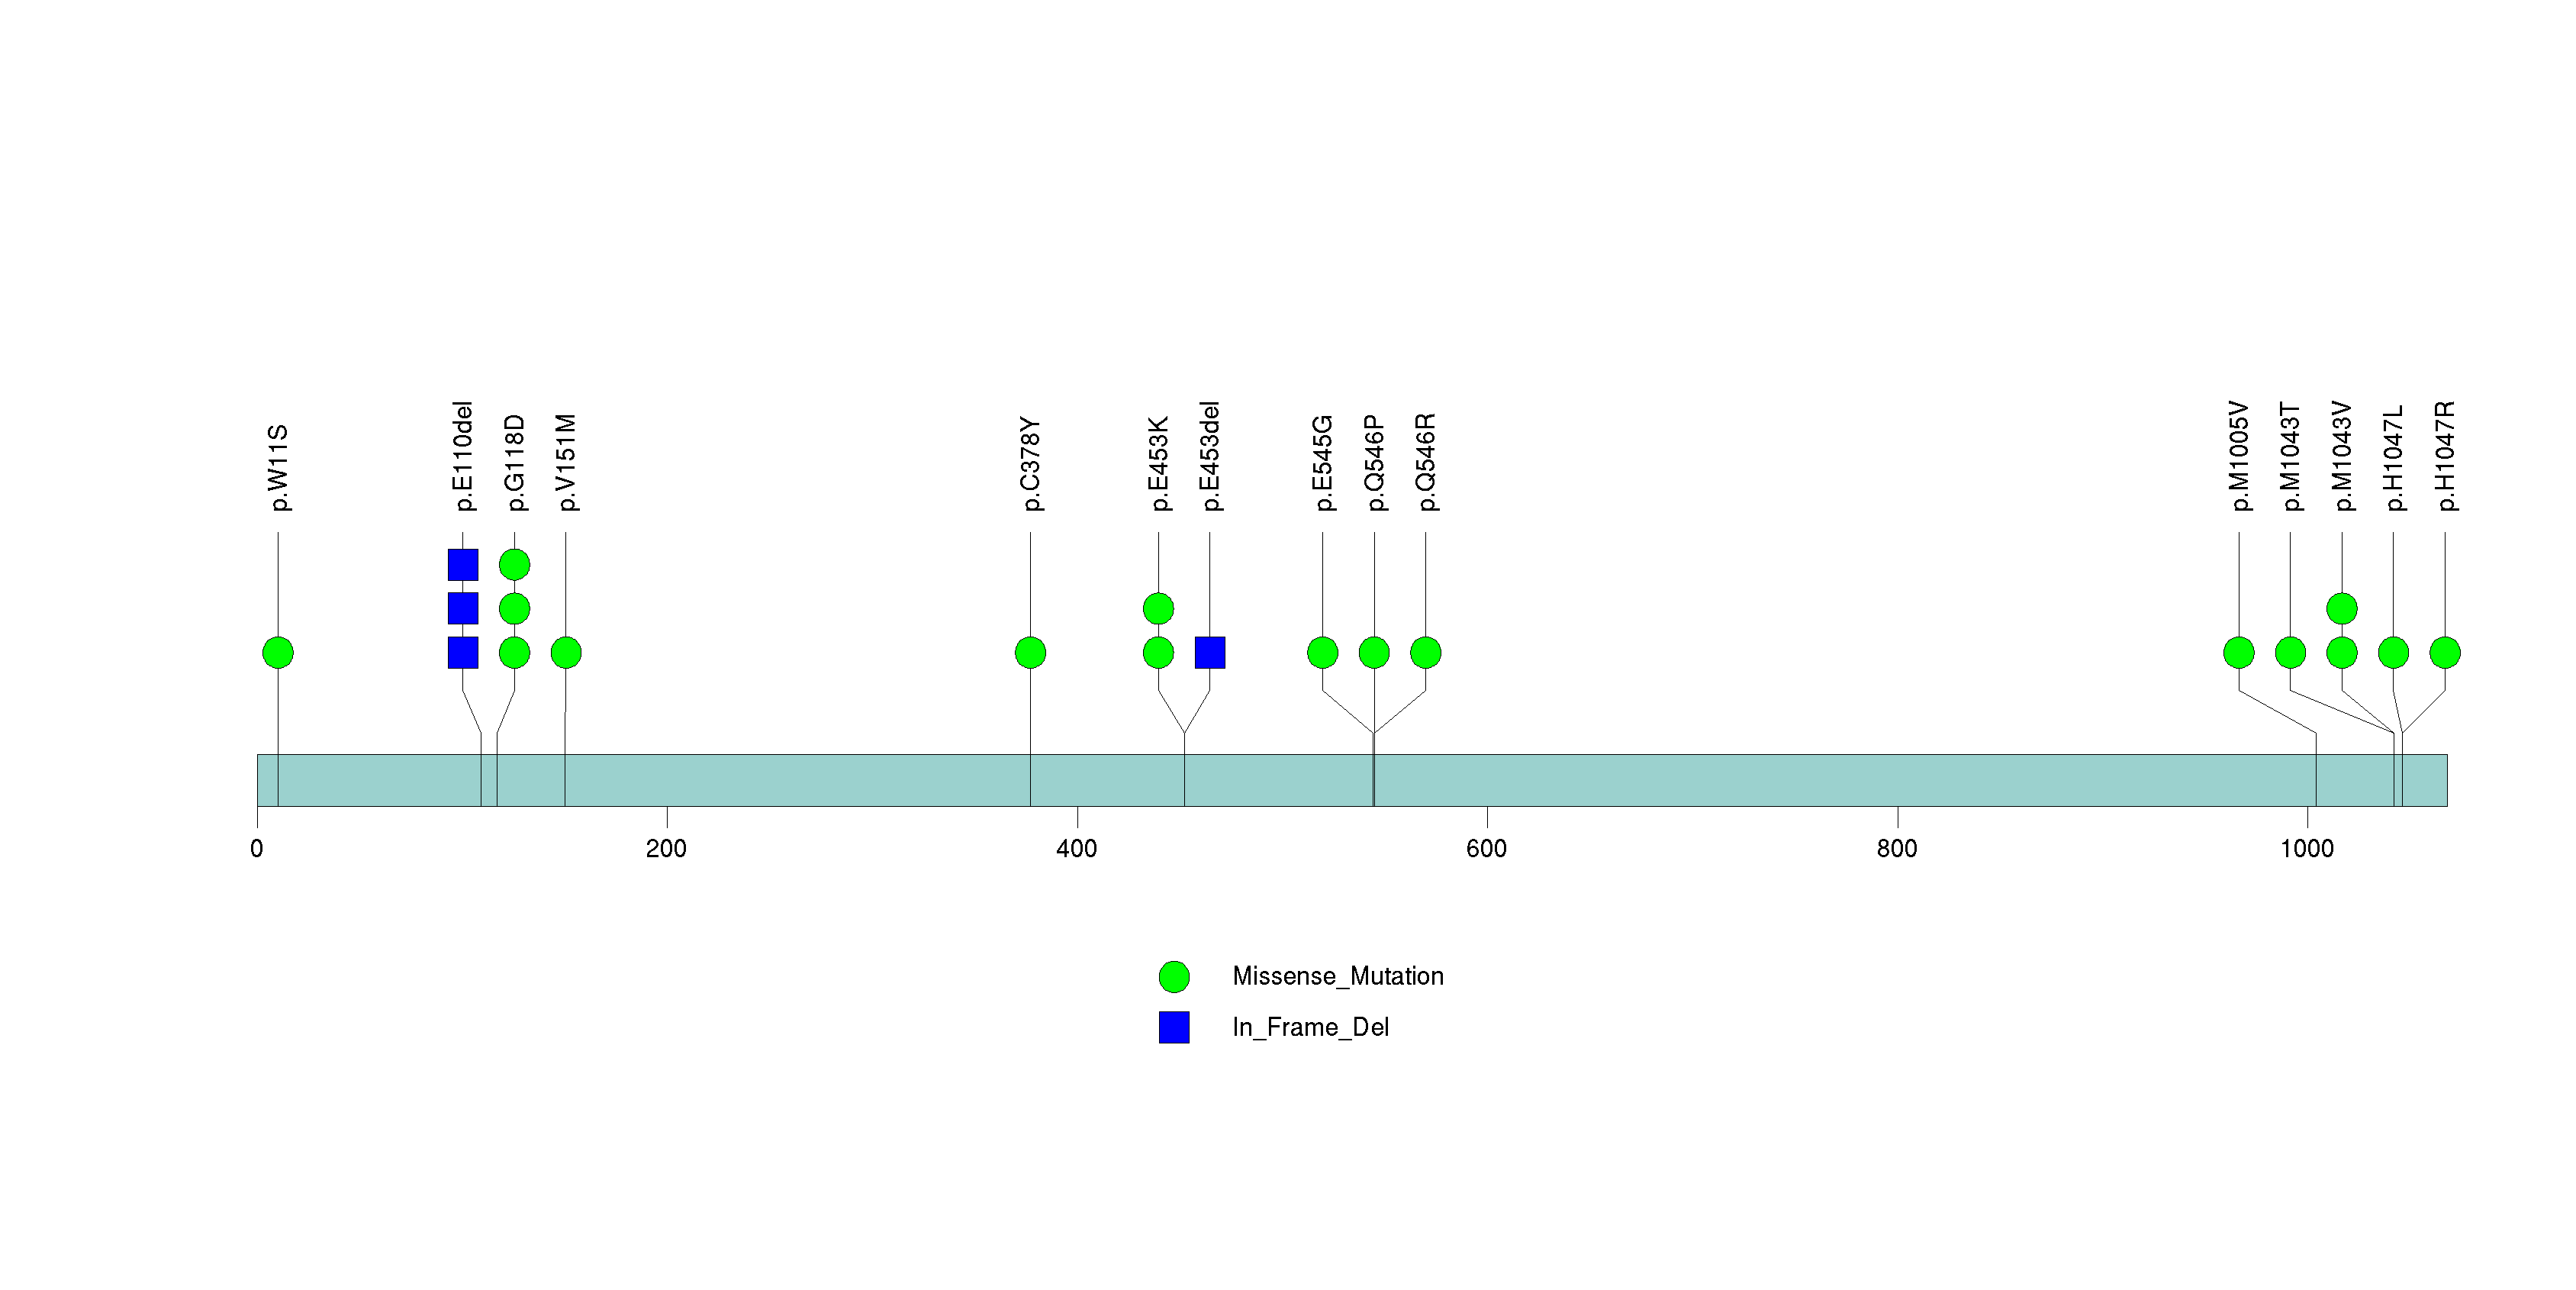
Figure S11. This figure depicts the distribution of mutations and mutation types across the CREBZF significant gene.
Figure S12. This figure depicts the distribution of mutations and mutation types across the PTEN significant gene.

Figure S13. This figure depicts the distribution of mutations and mutation types across the TIMD4 significant gene.
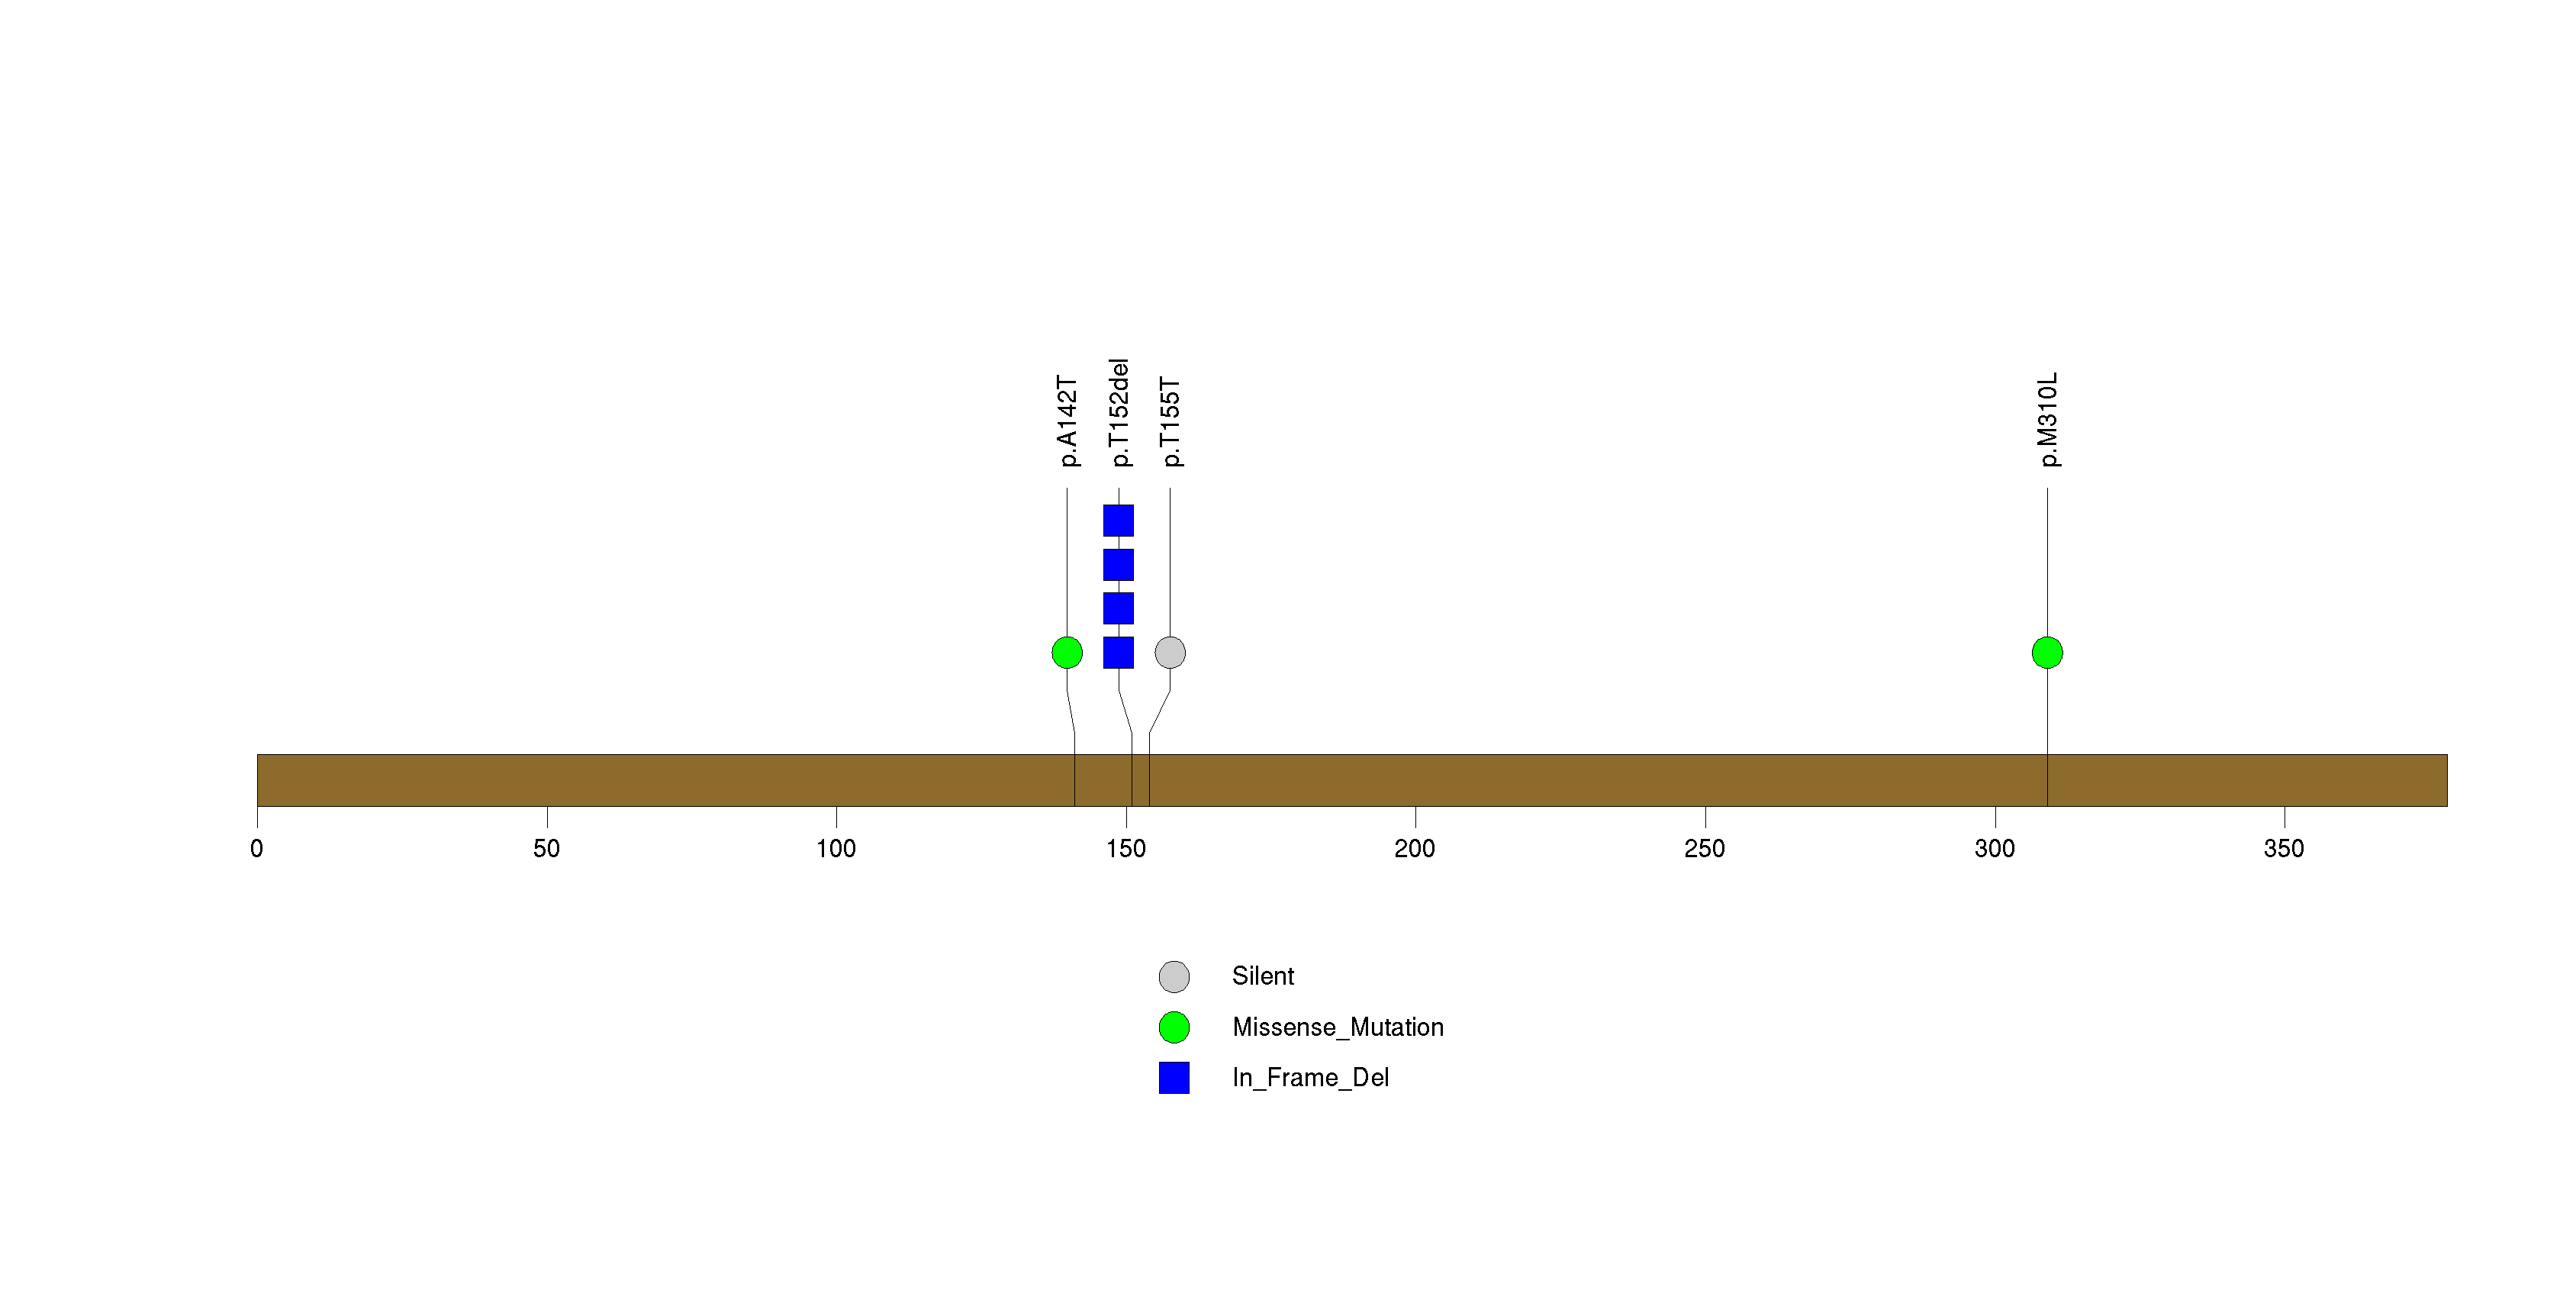
Figure S14. This figure depicts the distribution of mutations and mutation types across the EMG1 significant gene.
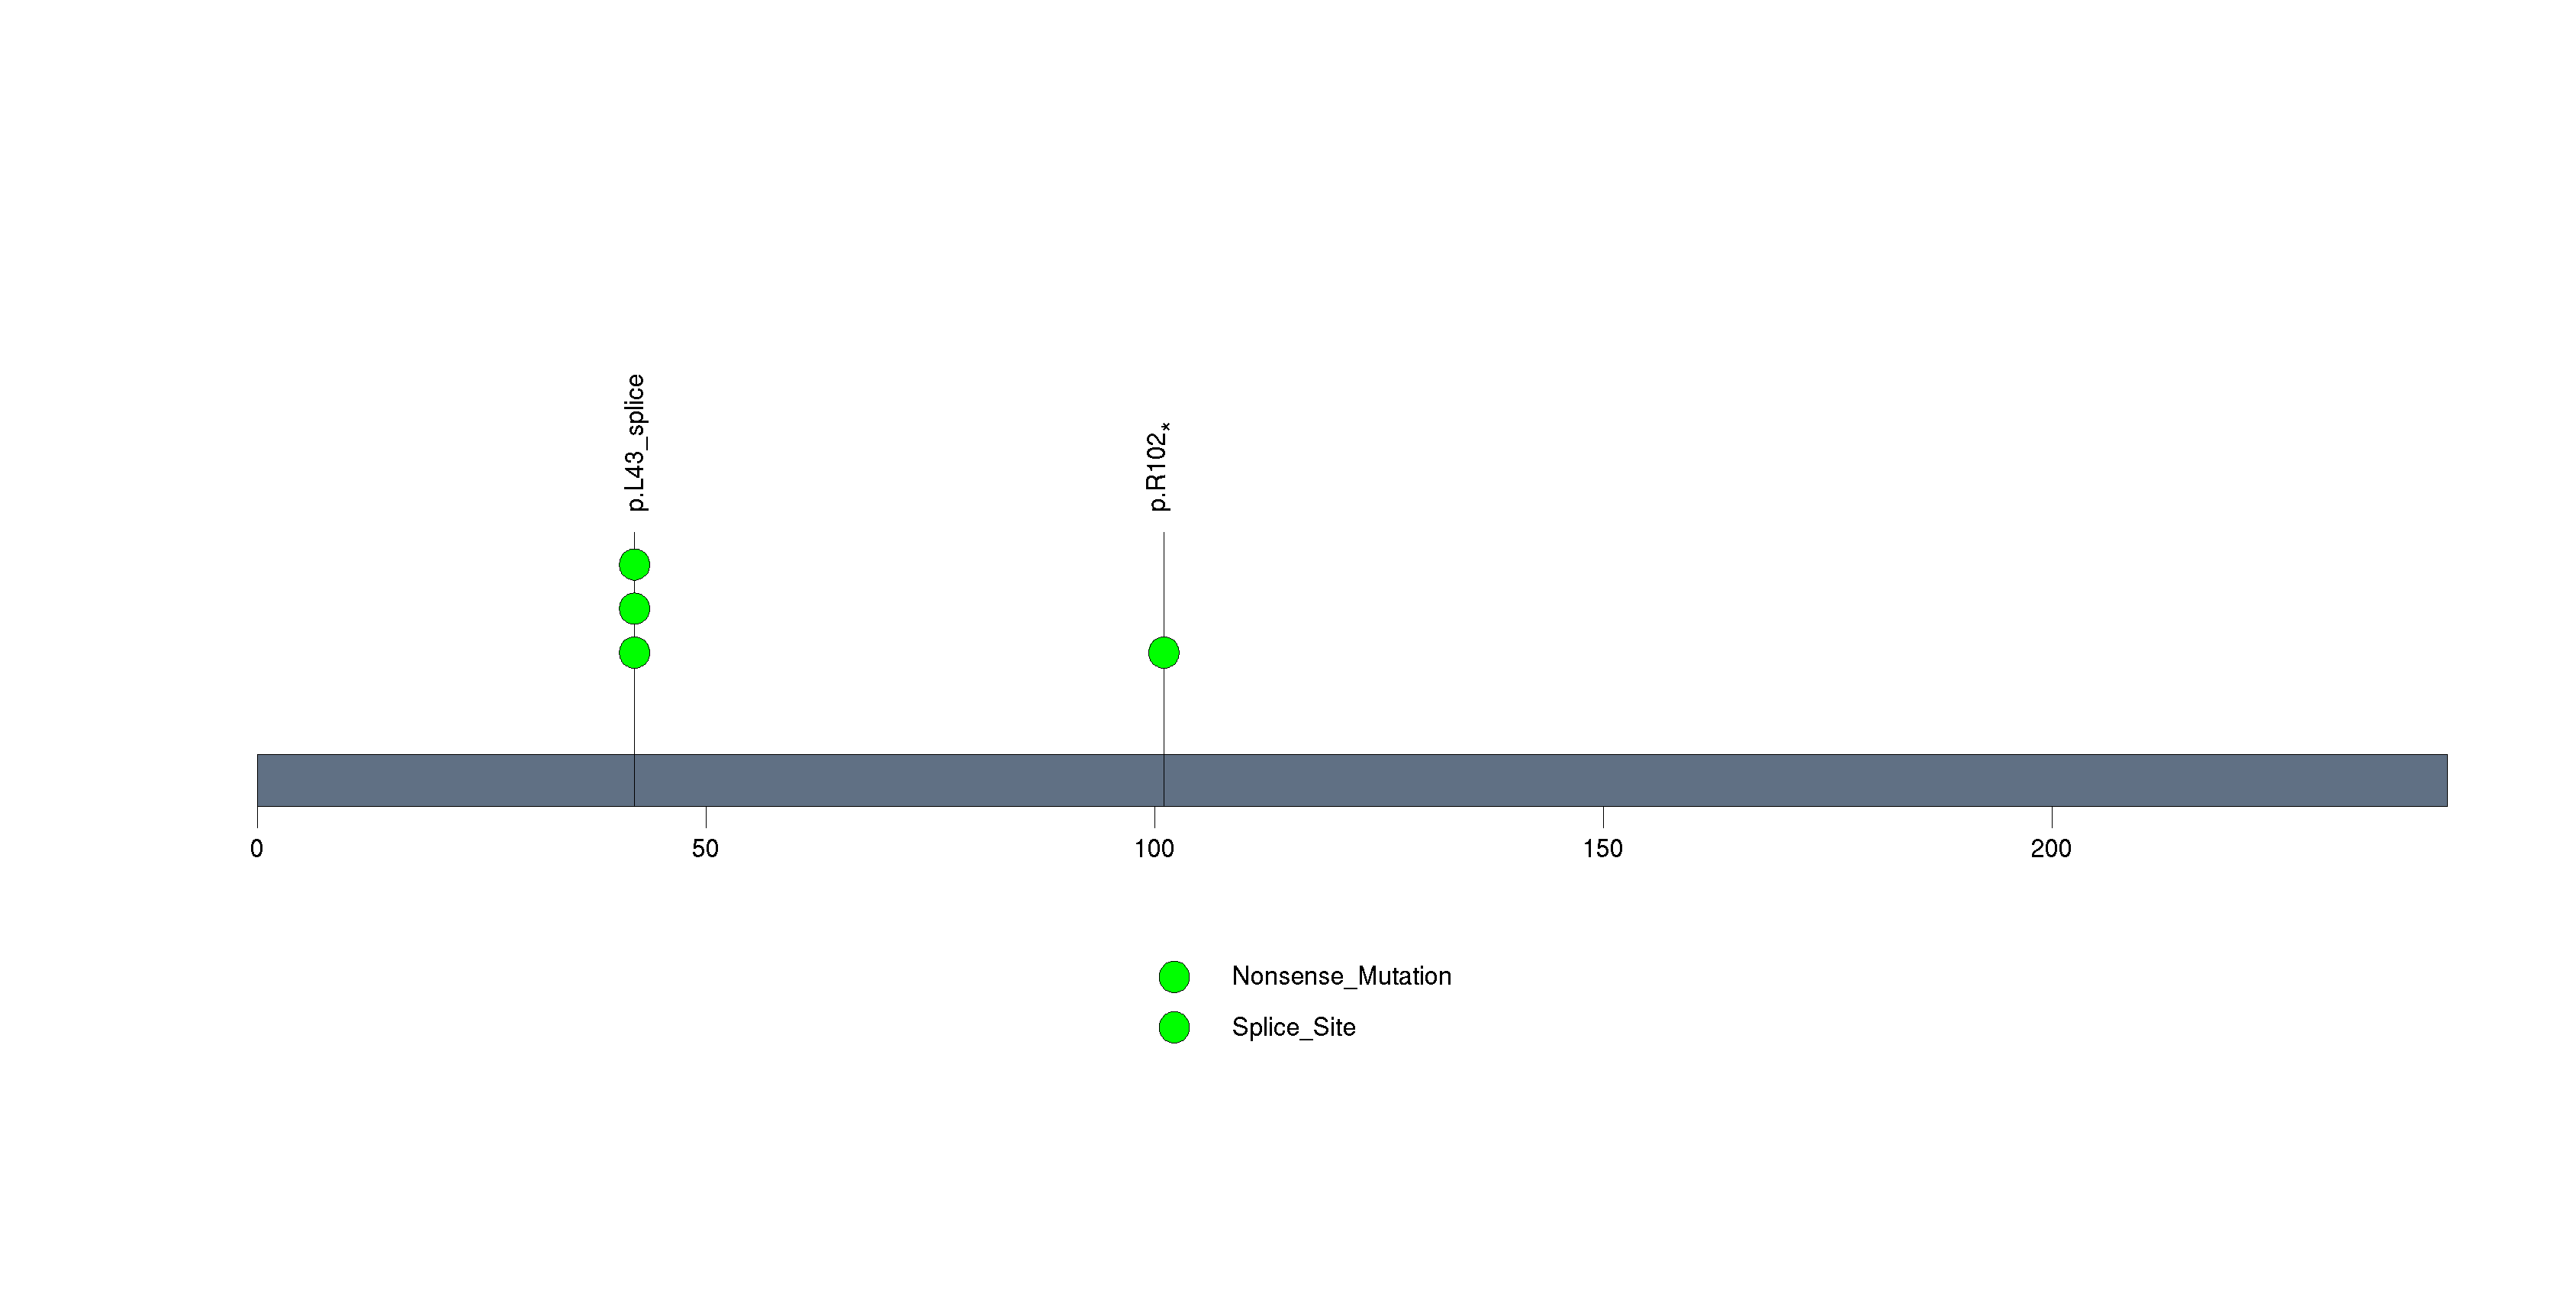
Figure S15. This figure depicts the distribution of mutations and mutation types across the NOX4 significant gene.
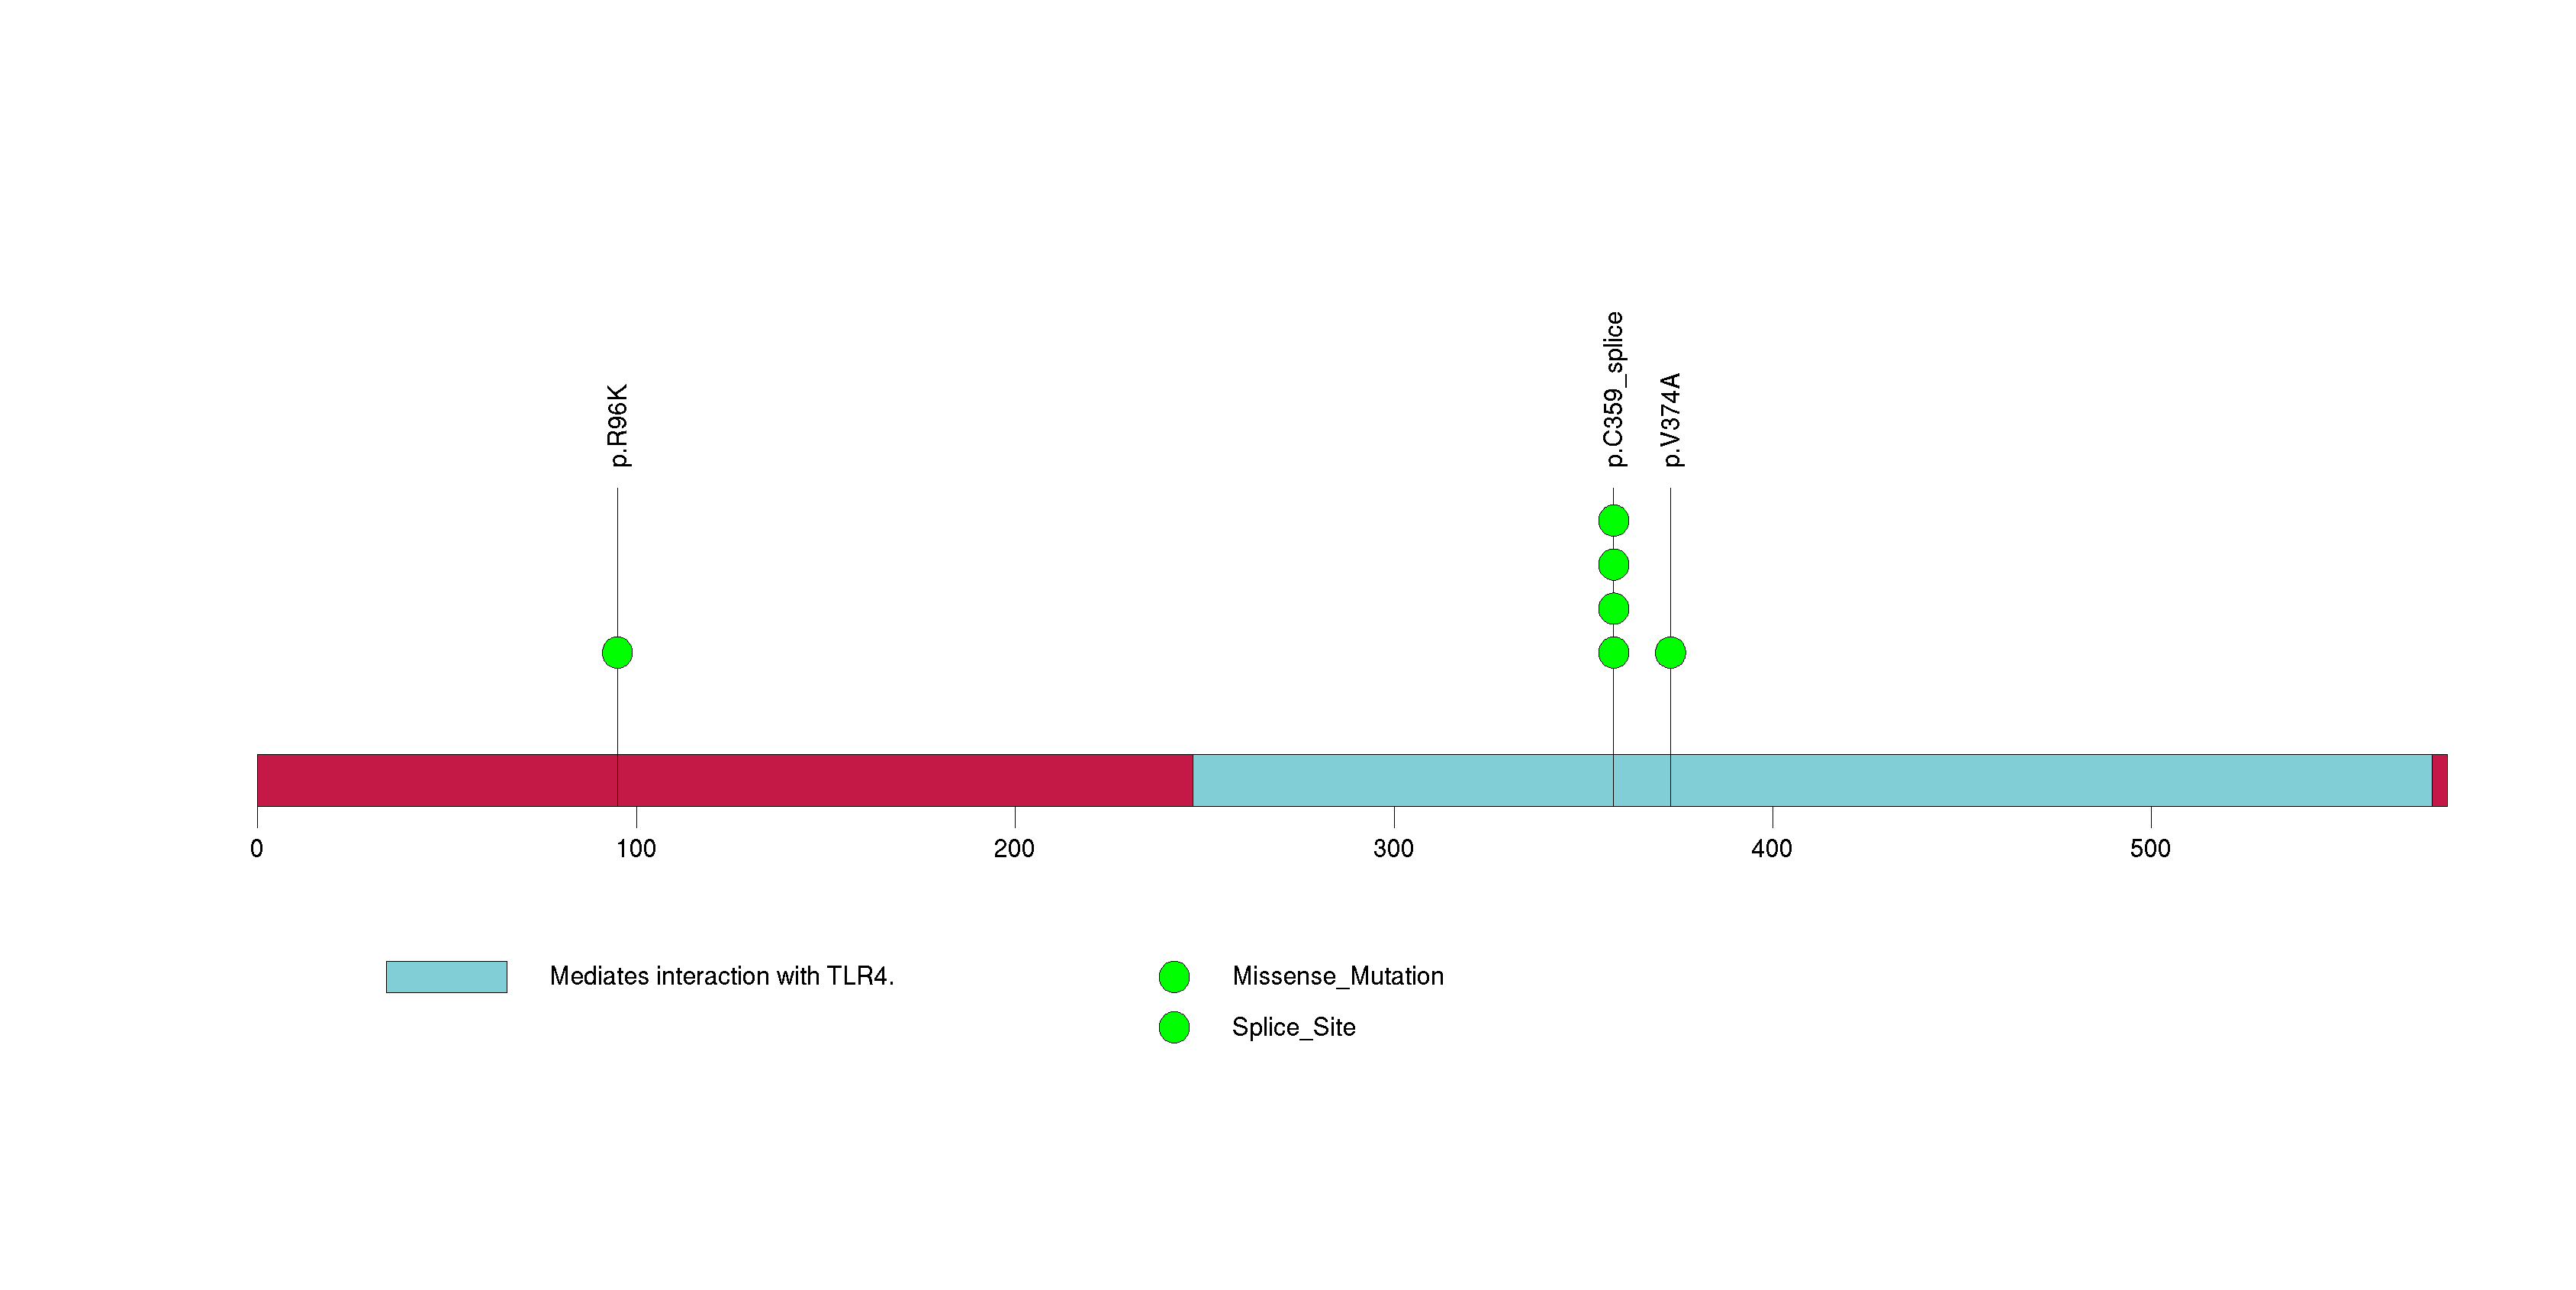
Figure S16. This figure depicts the distribution of mutations and mutation types across the ZNF57 significant gene.

In this analysis, COSMIC is used as a filter to increase power by restricting the territory of each gene. Cosmic version: v48.
Table 4. Get Full Table Significantly mutated genes (COSMIC territory only). To access the database please go to: COSMIC. Number of significant genes found: 13. Number of genes displayed: 10
| rank | gene | description | n | cos | n_cos | N_cos | cos_ev | p | q |
|---|---|---|---|---|---|---|---|---|---|
| 1 | IDH1 | isocitrate dehydrogenase 1 (NADP+), soluble | 165 | 5 | 165 | 1085 | 246180 | 4.8e-14 | 1.3e-10 |
| 2 | IDH2 | isocitrate dehydrogenase 2 (NADP+), mitochondrial | 9 | 6 | 9 | 1302 | 747 | 5.8e-14 | 1.3e-10 |
| 3 | PIK3R1 | phosphoinositide-3-kinase, regulatory subunit 1 (alpha) | 15 | 33 | 7 | 7161 | 14 | 3.1e-13 | 4.7e-10 |
| 4 | PIK3CA | phosphoinositide-3-kinase, catalytic, alpha polypeptide | 21 | 220 | 19 | 47740 | 2990 | 1.8e-12 | 2.1e-09 |
| 5 | TP53 | tumor protein p53 | 148 | 356 | 145 | 77252 | 51945 | 2.7e-12 | 2.5e-09 |
| 6 | PTEN | phosphatase and tensin homolog (mutated in multiple advanced cancers 1) | 12 | 767 | 11 | 166439 | 549 | 1.2e-11 | 9.4e-09 |
| 7 | PTPN11 | protein tyrosine phosphatase, non-receptor type 11 (Noonan syndrome 1) | 6 | 32 | 5 | 6944 | 178 | 3.3e-11 | 2.1e-08 |
| 8 | EGFR | epidermal growth factor receptor (erythroblastic leukemia viral (v-erb-b) oncogene homolog, avian) | 12 | 293 | 8 | 63581 | 71 | 4e-11 | 2.3e-08 |
| 9 | SMARCA4 | SWI/SNF related, matrix associated, actin dependent regulator of chromatin, subfamily a, member 4 | 13 | 30 | 4 | 6510 | 1 | 6.1e-09 | 3e-06 |
| 10 | NF1 | neurofibromin 1 (neurofibromatosis, von Recklinghausen disease, Watson disease) | 20 | 285 | 6 | 61845 | 8 | 4.9e-08 | 0.000022 |
Note:
n - number of (nonsilent) mutations in this gene across the individual set.
cos = number of unique mutated sites in this gene in COSMIC
n_cos = overlap between n and cos.
N_cos = number of individuals times cos.
cos_ev = total evidence: number of reports in COSMIC for mutations seen in this gene.
p = p-value for seeing the observed amount of overlap in this gene)
q = q-value, False Discovery Rate (Benjamini-Hochberg procedure)
Table 5. Get Full Table A Ranked List of Significantly Mutated Genesets. (Source: MSigDB GSEA Cannonical Pathway Set).Number of significant genesets found: 100. Number of genesets displayed: 10
| rank | geneset | description | genes | N_genes | mut_tally | N | n | npat | nsite | nsil | n1 | n2 | n3 | n4 | n5 | n6 | p_ns_s | p | q |
|---|---|---|---|---|---|---|---|---|---|---|---|---|---|---|---|---|---|---|---|
| 1 | HSA00720_REDUCTIVE_CARBOXYLATE_CYCLE | Genes involved in reductive carboxylate cycle (CO2 fixation) | ACLY, ACO1, ACO2, ACSS1, ACSS2, FH, IDH1, IDH2, LOC441996, MDH1, MDH2, SUCLA2 | 11 | ACLY(3), ACO1(2), ACO2(2), ACSS1(1), ACSS2(3), FH(1), IDH1(165), IDH2(9) | 4296350 | 186 | 177 | 17 | 0 | 160 | 8 | 0 | 16 | 2 | 0 | <1.00e-15 | <1.00e-15 | <8.80e-14 |
| 2 | CITRATE_CYCLE_TCA_CYCLE | ACO1, ACO2, CS, DLD, DLST, DLSTP, FH, IDH1, IDH2, IDH3A, IDH3B, IDH3G, MDH1, MDH2, PC, PCK1, SDHA, SDHA, SDHAL2, SDHB, SUCLA2, SUCLG1, SUCLG2 | 20 | ACO1(2), ACO2(2), FH(1), IDH1(165), IDH2(9), IDH3B(1), PC(1), PCK1(3), SUCLG2(1) | 6652756 | 185 | 175 | 16 | 2 | 160 | 10 | 0 | 15 | 0 | 0 | <1.00e-15 | <1.00e-15 | <8.80e-14 | |
| 3 | ARFPATHWAY | Cyclin-dependent kinase inhibitor 2A is a tumor suppressor that induces G1 arrest and can activate the p53 pathway, leading to G2/M arrest. | ABL1, CDKN2A, E2F1, MDM2, MYC, PIK3CA, PIK3R1, POLR1A, POLR1B, POLR1C, POLR1D, RAC1, RB1, TBX2, TP53, TWIST1 | 16 | ABL1(4), CDKN2A(2), E2F1(1), MDM2(2), PIK3CA(21), PIK3R1(15), POLR1A(4), POLR1B(2), RAC1(1), RB1(4), TBX2(1), TP53(148) | 6553032 | 205 | 141 | 123 | 9 | 64 | 26 | 34 | 39 | 39 | 3 | <1.00e-15 | <1.00e-15 | <8.80e-14 |
| 4 | P53PATHWAY | p53 induces cell cycle arrest or apoptosis under conditions of DNA damage. | APAF1, ATM, BAX, BCL2, CCND1, CCNE1, CDK2, CDK4, CDKN1A, E2F1, GADD45A, MDM2, PCNA, RB1, TIMP3, TP53 | 16 | APAF1(1), ATM(4), BAX(1), CCND1(1), CDK2(1), CDK4(1), E2F1(1), MDM2(2), RB1(4), TIMP3(2), TP53(148) | 5848889 | 166 | 117 | 94 | 6 | 61 | 17 | 26 | 35 | 24 | 3 | 1.32e-14 | <1.00e-15 | <8.80e-14 |
| 5 | RBPATHWAY | The ATM protein kinase recognizes DNA damage and blocks cell cycle progression by phosphorylating chk1 and p53, which normally inhibits Rb to allow G1/S transitions. | ATM, CDC2, CDC25A, CDC25B, CDC25C, CDK2, CDK4, CHEK1, MYT1, RB1, TP53, WEE1, YWHAH | 12 | ATM(4), CDC25A(1), CDK2(1), CDK4(1), CHEK1(3), MYT1(3), RB1(4), TP53(148), WEE1(1), YWHAH(1) | 5683263 | 167 | 117 | 95 | 9 | 61 | 17 | 24 | 33 | 29 | 3 | 2.39e-11 | <1.00e-15 | <8.80e-14 |
| 6 | ATMPATHWAY | The tumor-suppressing protein kinase ATM responds to radiation-induced DNA damage by blocking cell-cycle progression and activating DNA repair. | ABL1, ATM, BRCA1, CDKN1A, CHEK1, CHEK2, GADD45A, JUN, MAPK8, MDM2, MRE11A, NBS1, NFKB1, NFKBIA, RAD50, RAD51, RBBP8, RELA, TP53, TP73 | 19 | ABL1(4), ATM(4), BRCA1(1), CHEK1(3), CHEK2(3), MAPK8(1), MDM2(2), MRE11A(2), NFKB1(1), RAD50(2), RBBP8(2), RELA(1), TP53(148) | 9630116 | 174 | 115 | 102 | 13 | 64 | 22 | 24 | 38 | 23 | 3 | 1.64e-10 | <1.00e-15 | <8.80e-14 |
| 7 | SA_G1_AND_S_PHASES | Cdk2, 4, and 6 bind cyclin D in G1, while cdk2/cyclin E promotes the G1/S transition. | ARF1, ARF3, CCND1, CDK2, CDK4, CDKN1A, CDKN1B, CDKN2A, CFL1, E2F1, E2F2, MDM2, NXT1, PRB1, TP53 | 15 | ARF1(1), CCND1(1), CDK2(1), CDK4(1), CDKN1B(1), CDKN2A(2), CFL1(1), E2F1(1), MDM2(2), PRB1(2), TP53(148) | 2712441 | 161 | 114 | 89 | 7 | 61 | 17 | 24 | 34 | 22 | 3 | 3.65e-14 | <1.00e-15 | <8.80e-14 |
| 8 | TERTPATHWAY | hTERC, the RNA subunit of telomerase, and hTERT, the catalytic protein subunit, are required for telomerase activity and are overexpressed in many cancers. | HDAC1, MAX, MYC, SP1, SP3, TP53, WT1, ZNF42 | 7 | MAX(4), SP3(2), TP53(148), WT1(1) | 2279162 | 155 | 116 | 82 | 2 | 61 | 16 | 21 | 34 | 20 | 3 | <1.00e-15 | 1.22e-15 | 9.12e-14 |
| 9 | REDUCTIVE_CARBOXYLATE_CYCLE_CO2_FIXATION | ACO1, ACO2, FH, IDH1, IDH2, MDH1, MDH2, SDHB, SUCLA2 | 9 | ACO1(2), ACO2(2), FH(1), IDH1(165), IDH2(9) | 2876483 | 179 | 175 | 10 | 0 | 158 | 7 | 0 | 14 | 0 | 0 | 1.22e-15 | 1.33e-15 | 9.12e-14 | |
| 10 | P53HYPOXIAPATHWAY | Hypoxia induces p53 accumulation and consequent apoptosis with p53-mediated cell cycle arrest, which is present under conditions of DNA damage. | ABCB1, AKT1, ATM, BAX, CDKN1A, CPB2, CSNK1A1, CSNK1D, FHL2, GADD45A, HIC1, HIF1A, HSPA1A, HSPCA, IGFBP3, MAPK8, MDM2, NFKBIB, NQO1, TP53 | 19 | ABCB1(3), AKT1(1), ATM(4), BAX(1), CPB2(1), CSNK1A1(2), CSNK1D(1), IGFBP3(1), MAPK8(1), MDM2(2), TP53(148) | 6705131 | 165 | 115 | 93 | 9 | 62 | 17 | 24 | 37 | 22 | 3 | 8.04e-13 | 1.55e-15 | 9.40e-14 |
In brief, we tabulate the number of mutations and the number of covered bases for each gene. The counts are broken down by mutation context category: four context categories that are discovered by MutSig, and one for indel and 'null' mutations, which include indels, nonsense mutations, splice-site mutations, and non-stop (read-through) mutations. For each gene, we calculate the probability of seeing the observed constellation of mutations, i.e. the product P1 x P2 x ... x Pm, or a more extreme one, given the background mutation rates calculated across the dataset. [1]
This is an experimental feature. The full results of the analysis summarized in this report can be downloaded from the TCGA Data Coordination Center.