This pipeline computes the correlation between significant arm-level copy number variations (cnvs) and selected clinical features.
Testing the association between copy number variation 66 arm-level results and 8 clinical features across 72 patients, 2 significant findings detected with Q value < 0.25.
-
3p gain cnv correlated to 'NEOPLASM.DISEASESTAGE'.
-
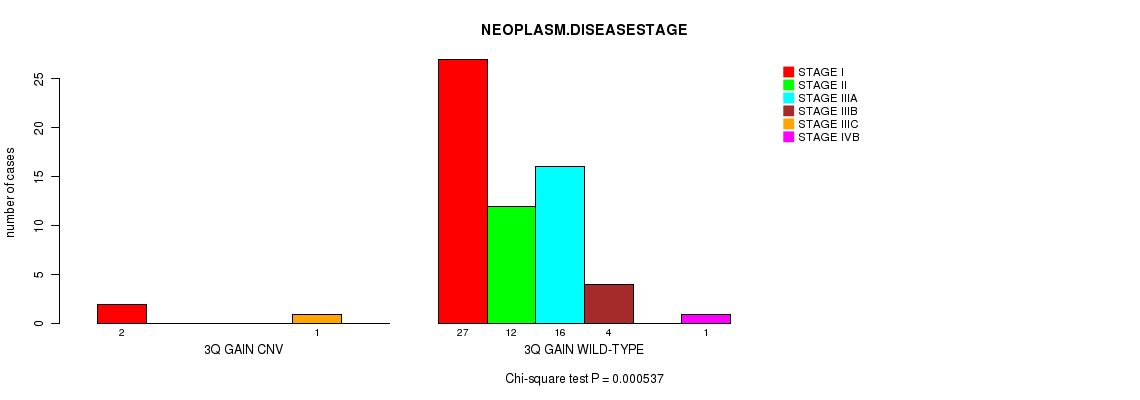
3q gain cnv correlated to 'NEOPLASM.DISEASESTAGE'.
Table 1. Get Full Table Overview of the association between significant copy number variation of 66 arm-level results and 8 clinical features. Shown in the table are P values (Q values). Thresholded by Q value < 0.25, 2 significant findings detected.
|
Clinical Features |
Time to Death |
AGE | GENDER |
DISTANT METASTASIS |
LYMPH NODE METASTASIS |
COMPLETENESS OF RESECTION |
TUMOR STAGECODE |
NEOPLASM DISEASESTAGE |
||
| nCNV (%) | nWild-Type | logrank test | t-test | Fisher's exact test | Fisher's exact test | Fisher's exact test | Fisher's exact test | t-test | Chi-square test | |
| 3p gain | 0 (0%) | 69 |
0.87 (1.00) |
0.0359 (1.00) |
1 (1.00) |
1 (1.00) |
0.0217 (1.00) |
0.591 (1.00) |
0.000537 (0.242) |
|
| 3q gain | 0 (0%) | 69 |
0.87 (1.00) |
0.0359 (1.00) |
1 (1.00) |
1 (1.00) |
0.0217 (1.00) |
0.591 (1.00) |
0.000537 (0.242) |
|
| 1p gain | 0 (0%) | 64 |
0.507 (1.00) |
0.0942 (1.00) |
1 (1.00) |
0.202 (1.00) |
0.117 (1.00) |
0.0654 (1.00) |
0.0514 (1.00) |
|
| 1q gain | 0 (0%) | 33 |
0.995 (1.00) |
0.886 (1.00) |
0.225 (1.00) |
0.525 (1.00) |
0.439 (1.00) |
0.956 (1.00) |
0.228 (1.00) |
|
| 2p gain | 0 (0%) | 64 |
0.349 (1.00) |
0.077 (1.00) |
0.116 (1.00) |
0.487 (1.00) |
0.316 (1.00) |
0.147 (1.00) |
0.866 (1.00) |
|
| 2q gain | 0 (0%) | 65 |
0.483 (1.00) |
0.163 (1.00) |
0.045 (1.00) |
0.706 (1.00) |
0.478 (1.00) |
0.437 (1.00) |
0.866 (1.00) |
|
| 4p gain | 0 (0%) | 66 |
0.786 (1.00) |
0.117 (1.00) |
0.412 (1.00) |
0.685 (1.00) |
0.689 (1.00) |
1 (1.00) |
0.866 (1.00) |
|
| 5p gain | 0 (0%) | 50 |
0.387 (1.00) |
0.236 (1.00) |
0.794 (1.00) |
0.718 (1.00) |
0.853 (1.00) |
0.821 (1.00) |
0.915 (1.00) |
|
| 5q gain | 0 (0%) | 56 |
0.442 (1.00) |
0.368 (1.00) |
1 (1.00) |
1 (1.00) |
1 (1.00) |
0.616 (1.00) |
0.734 (1.00) |
|
| 6p gain | 0 (0%) | 59 |
0.127 (1.00) |
0.84 (1.00) |
0.521 (1.00) |
0.263 (1.00) |
0.6 (1.00) |
0.0566 (1.00) |
0.402 (1.00) |
|
| 6q gain | 0 (0%) | 63 |
0.0769 (1.00) |
0.298 (1.00) |
0.482 (1.00) |
0.169 (1.00) |
0.75 (1.00) |
0.0352 (1.00) |
0.225 (1.00) |
|
| 7p gain | 0 (0%) | 54 |
0.772 (1.00) |
0.636 (1.00) |
0.394 (1.00) |
1 (1.00) |
0.828 (1.00) |
0.793 (1.00) |
0.955 (1.00) |
|
| 7q gain | 0 (0%) | 53 |
0.415 (1.00) |
0.561 (1.00) |
0.575 (1.00) |
0.552 (1.00) |
0.677 (1.00) |
0.793 (1.00) |
0.895 (1.00) |
|
| 8p gain | 0 (0%) | 61 |
0.268 (1.00) |
0.758 (1.00) |
0.309 (1.00) |
0.179 (1.00) |
1 (1.00) |
0.088 (1.00) |
0.164 (1.00) |
|
| 8q gain | 0 (0%) | 38 |
0.614 (1.00) |
0.528 (1.00) |
0.46 (1.00) |
0.525 (1.00) |
0.436 (1.00) |
0.839 (1.00) |
0.697 (1.00) |
|
| 9p gain | 0 (0%) | 69 |
0.935 (1.00) |
0.275 (1.00) |
1 (1.00) |
1 (1.00) |
0.591 (1.00) |
0.938 (1.00) |
||
| 9q gain | 0 (0%) | 69 |
0.935 (1.00) |
0.275 (1.00) |
1 (1.00) |
1 (1.00) |
0.591 (1.00) |
0.938 (1.00) |
||
| 10p gain | 0 (0%) | 66 |
0.0729 (1.00) |
0.864 (1.00) |
0.412 (1.00) |
0.158 (1.00) |
0.141 (1.00) |
0.501 (1.00) |
0.813 (1.00) |
|
| 12q gain | 0 (0%) | 69 |
0.999 (1.00) |
0.275 (1.00) |
0.565 (1.00) |
1 (1.00) |
0.591 (1.00) |
0.975 (1.00) |
||
| 15q gain | 0 (0%) | 67 |
0.511 (1.00) |
0.263 (1.00) |
0.334 (1.00) |
0.367 (1.00) |
0.215 (1.00) |
0.781 (1.00) |
0.421 (1.00) |
|
| 16p gain | 0 (0%) | 69 |
0.00316 (1.00) |
0.123 (1.00) |
1 (1.00) |
0.275 (1.00) |
0.246 (1.00) |
1 (1.00) |
||
| 17p gain | 0 (0%) | 69 |
0.288 (1.00) |
0.643 (1.00) |
0.275 (1.00) |
0.0714 (1.00) |
0.0655 (1.00) |
0.591 (1.00) |
||
| 17q gain | 0 (0%) | 55 |
0.112 (1.00) |
0.524 (1.00) |
0.568 (1.00) |
0.533 (1.00) |
0.394 (1.00) |
0.793 (1.00) |
0.792 (1.00) |
|
| 18p gain | 0 (0%) | 69 |
0.87 (1.00) |
0.172 (1.00) |
1 (1.00) |
0.565 (1.00) |
0.568 (1.00) |
0.591 (1.00) |
0.521 (1.00) |
|
| 18q gain | 0 (0%) | 68 |
0.522 (1.00) |
0.45 (1.00) |
1 (1.00) |
0.336 (1.00) |
0.348 (1.00) |
0.7 (1.00) |
0.354 (1.00) |
|
| 19p gain | 0 (0%) | 67 |
0.431 (1.00) |
0.649 (1.00) |
0.0463 (1.00) |
0.68 (1.00) |
0.658 (1.00) |
1 (1.00) |
0.66 (1.00) |
|
| 19q gain | 0 (0%) | 65 |
0.572 (1.00) |
0.888 (1.00) |
0.045 (1.00) |
0.706 (1.00) |
0.478 (1.00) |
0.552 (1.00) |
0.602 (1.00) |
|
| 20p gain | 0 (0%) | 59 |
0.0785 (1.00) |
0.235 (1.00) |
0.353 (1.00) |
0.791 (1.00) |
0.337 (1.00) |
0.0886 (1.00) |
0.719 (1.00) |
|
| 20q gain | 0 (0%) | 58 |
0.139 (1.00) |
0.173 (1.00) |
0.539 (1.00) |
0.806 (1.00) |
0.461 (1.00) |
0.0284 (1.00) |
0.597 (1.00) |
|
| 21q gain | 0 (0%) | 68 |
0.415 (1.00) |
0.631 (1.00) |
0.117 (1.00) |
0.613 (1.00) |
0.602 (1.00) |
1 (1.00) |
0.6 (1.00) |
|
| 22q gain | 0 (0%) | 64 |
0.134 (1.00) |
0.318 (1.00) |
0.436 (1.00) |
0.741 (1.00) |
0.054 (1.00) |
0.844 (1.00) |
0.0334 (1.00) |
|
| Xq gain | 0 (0%) | 68 |
0.123 (1.00) |
0.0956 (1.00) |
1 (1.00) |
0.147 (1.00) |
0.602 (1.00) |
0.7 (1.00) |
0.594 (1.00) |
|
| 1p loss | 0 (0%) | 59 |
0.908 (1.00) |
0.719 (1.00) |
0.353 (1.00) |
1 (1.00) |
0.21 (1.00) |
0.558 (1.00) |
0.235 (1.00) |
|
| 1q loss | 0 (0%) | 67 |
0.851 (1.00) |
0.514 (1.00) |
1 (1.00) |
0.68 (1.00) |
0.0423 (1.00) |
1 (1.00) |
0.00708 (1.00) |
|
| 2p loss | 0 (0%) | 69 |
0.275 (1.00) |
1 (1.00) |
1 (1.00) |
0.591 (1.00) |
0.885 (1.00) |
|||
| 2q loss | 0 (0%) | 68 |
0.00352 (1.00) |
0.606 (1.00) |
1 (1.00) |
1 (1.00) |
0.188 (1.00) |
0.992 (1.00) |
||
| 3p loss | 0 (0%) | 65 |
0.866 (1.00) |
0.455 (1.00) |
0.688 (1.00) |
0.472 (1.00) |
0.699 (1.00) |
0.844 (1.00) |
0.526 (1.00) |
|
| 3q loss | 0 (0%) | 69 |
0.674 (1.00) |
0.314 (1.00) |
0.275 (1.00) |
1 (1.00) |
1 (1.00) |
1 (1.00) |
||
| 4p loss | 0 (0%) | 63 |
0.257 (1.00) |
0.967 (1.00) |
1 (1.00) |
1 (1.00) |
1 (1.00) |
1 (1.00) |
0.886 (1.00) |
|
| 4q loss | 0 (0%) | 57 |
0.504 (1.00) |
0.911 (1.00) |
0.553 (1.00) |
1 (1.00) |
1 (1.00) |
0.915 (1.00) |
0.624 (1.00) |
|
| 5q loss | 0 (0%) | 68 |
0.00285 (1.00) |
0.952 (1.00) |
1 (1.00) |
0.613 (1.00) |
0.602 (1.00) |
0.29 (1.00) |
0.938 (1.00) |
|
| 6q loss | 0 (0%) | 60 |
0.428 (1.00) |
0.712 (1.00) |
0.741 (1.00) |
0.783 (1.00) |
1 (1.00) |
0.39 (1.00) |
0.988 (1.00) |
|
| 7p loss | 0 (0%) | 67 |
0.523 (1.00) |
0.768 (1.00) |
0.0463 (1.00) |
0.68 (1.00) |
0.658 (1.00) |
0.781 (1.00) |
0.0208 (1.00) |
|
| 7q loss | 0 (0%) | 65 |
0.656 (1.00) |
0.538 (1.00) |
0.227 (1.00) |
0.472 (1.00) |
1 (1.00) |
0.3 (1.00) |
0.176 (1.00) |
|
| 8p loss | 0 (0%) | 42 |
0.252 (1.00) |
0.0495 (1.00) |
0.218 (1.00) |
0.772 (1.00) |
0.231 (1.00) |
0.949 (1.00) |
0.417 (1.00) |
|
| 8q loss | 0 (0%) | 67 |
0.394 (1.00) |
0.721 (1.00) |
0.334 (1.00) |
1 (1.00) |
0.658 (1.00) |
0.399 (1.00) |
0.112 (1.00) |
|
| 9p loss | 0 (0%) | 55 |
0.937 (1.00) |
0.742 (1.00) |
0.773 (1.00) |
1 (1.00) |
0.666 (1.00) |
0.519 (1.00) |
0.587 (1.00) |
|
| 9q loss | 0 (0%) | 57 |
0.646 (1.00) |
0.829 (1.00) |
0.553 (1.00) |
1 (1.00) |
1 (1.00) |
0.573 (1.00) |
0.69 (1.00) |
|
| 10p loss | 0 (0%) | 69 |
0.574 (1.00) |
0.026 (1.00) |
0.547 (1.00) |
0.275 (1.00) |
1 (1.00) |
0.182 (1.00) |
||
| 10q loss | 0 (0%) | 59 |
0.237 (1.00) |
0.578 (1.00) |
0.757 (1.00) |
0.791 (1.00) |
0.6 (1.00) |
0.33 (1.00) |
0.641 (1.00) |
|
| 11p loss | 0 (0%) | 66 |
0.643 (1.00) |
0.276 (1.00) |
0.412 (1.00) |
1 (1.00) |
0.41 (1.00) |
1 (1.00) |
0.354 (1.00) |
|
| 11q loss | 0 (0%) | 64 |
0.618 (1.00) |
0.33 (1.00) |
1 (1.00) |
0.741 (1.00) |
0.724 (1.00) |
0.03 (1.00) |
0.526 (1.00) |
|
| 12p loss | 0 (0%) | 67 |
0.25 (1.00) |
0.757 (1.00) |
0.334 (1.00) |
0.225 (1.00) |
0.0945 (1.00) |
0.781 (1.00) |
0.018 (1.00) |
|
| 12q loss | 0 (0%) | 69 |
0.411 (1.00) |
0.599 (1.00) |
0.275 (1.00) |
0.565 (1.00) |
1 (1.00) |
1 (1.00) |
0.885 (1.00) |
|
| 13q loss | 0 (0%) | 48 |
0.397 (1.00) |
0.138 (1.00) |
1 (1.00) |
0.215 (1.00) |
0.729 (1.00) |
0.203 (1.00) |
0.13 (1.00) |
|
| 14q loss | 0 (0%) | 48 |
0.563 (1.00) |
0.662 (1.00) |
0.795 (1.00) |
0.618 (1.00) |
0.311 (1.00) |
0.706 (1.00) |
0.197 (1.00) |
|
| 15q loss | 0 (0%) | 64 |
0.803 (1.00) |
0.414 (1.00) |
0.705 (1.00) |
1 (1.00) |
1 (1.00) |
0.844 (1.00) |
0.763 (1.00) |
|
| 16p loss | 0 (0%) | 57 |
0.84 (1.00) |
0.631 (1.00) |
1 (1.00) |
0.204 (1.00) |
0.153 (1.00) |
0.00976 (1.00) |
0.039 (1.00) |
|
| 16q loss | 0 (0%) | 49 |
0.891 (1.00) |
0.415 (1.00) |
0.606 (1.00) |
0.124 (1.00) |
0.366 (1.00) |
0.17 (1.00) |
0.343 (1.00) |
|
| 17p loss | 0 (0%) | 42 |
0.247 (1.00) |
0.321 (1.00) |
1 (1.00) |
0.028 (1.00) |
0.0507 (1.00) |
0.406 (1.00) |
0.629 (1.00) |
|
| 17q loss | 0 (0%) | 69 |
0.818 (1.00) |
0.0104 (1.00) |
0.275 (1.00) |
1 (1.00) |
1 (1.00) |
1 (1.00) |
||
| 18p loss | 0 (0%) | 64 |
0.00678 (1.00) |
0.124 (1.00) |
1 (1.00) |
0.741 (1.00) |
0.316 (1.00) |
1 (1.00) |
0.917 (1.00) |
|
| 18q loss | 0 (0%) | 62 |
0.0875 (1.00) |
0.0802 (1.00) |
0.73 (1.00) |
1 (1.00) |
0.273 (1.00) |
1 (1.00) |
0.899 (1.00) |
|
| 19p loss | 0 (0%) | 67 |
0.33 (1.00) |
0.305 (1.00) |
0.156 (1.00) |
1 (1.00) |
1 (1.00) |
0.269 (1.00) |
0.849 (1.00) |
|
| 21q loss | 0 (0%) | 62 |
0.0284 (1.00) |
0.9 (1.00) |
0.012 (1.00) |
1 (1.00) |
1 (1.00) |
0.3 (1.00) |
0.534 (1.00) |
|
| 22q loss | 0 (0%) | 63 |
0.484 (1.00) |
0.591 (1.00) |
0.0565 (1.00) |
1 (1.00) |
0.508 (1.00) |
0.0521 (1.00) |
0.51 (1.00) |
P value = 0.000537 (Chi-square test), Q value = 0.24
Table S1. Gene #5: '3p gain' versus Clinical Feature #8: 'NEOPLASM.DISEASESTAGE'
| nPatients | STAGE I | STAGE II | STAGE IIIA | STAGE IIIB | STAGE IIIC | STAGE IVB |
|---|---|---|---|---|---|---|
| ALL | 29 | 12 | 16 | 4 | 1 | 1 |
| 3P GAIN CNV | 2 | 0 | 0 | 0 | 1 | 0 |
| 3P GAIN WILD-TYPE | 27 | 12 | 16 | 4 | 0 | 1 |
Figure S1. Get High-res Image Gene #5: '3p gain' versus Clinical Feature #8: 'NEOPLASM.DISEASESTAGE'

P value = 0.000537 (Chi-square test), Q value = 0.24
Table S2. Gene #6: '3q gain' versus Clinical Feature #8: 'NEOPLASM.DISEASESTAGE'
| nPatients | STAGE I | STAGE II | STAGE IIIA | STAGE IIIB | STAGE IIIC | STAGE IVB |
|---|---|---|---|---|---|---|
| ALL | 29 | 12 | 16 | 4 | 1 | 1 |
| 3Q GAIN CNV | 2 | 0 | 0 | 0 | 1 | 0 |
| 3Q GAIN WILD-TYPE | 27 | 12 | 16 | 4 | 0 | 1 |
Figure S2. Get High-res Image Gene #6: '3q gain' versus Clinical Feature #8: 'NEOPLASM.DISEASESTAGE'
-
Mutation data file = broad_values_by_arm.mutsig.cluster.txt
-
Clinical data file = LIHC-TP.clin.merged.picked.txt
-
Number of patients = 72
-
Number of significantly arm-level cnvs = 66
-
Number of selected clinical features = 8
-
Exclude genes that fewer than K tumors have mutations, K = 3
For survival clinical features, the Kaplan-Meier survival curves of tumors with and without gene mutations were plotted and the statistical significance P values were estimated by logrank test (Bland and Altman 2004) using the 'survdiff' function in R
For continuous numerical clinical features, two-tailed Student's t test with unequal variance (Lehmann and Romano 2005) was applied to compare the clinical values between tumors with and without gene mutations using 't.test' function in R
For binary or multi-class clinical features (nominal or ordinal), two-tailed Fisher's exact tests (Fisher 1922) were used to estimate the P values using the 'fisher.test' function in R
For multi-class clinical features (nominal or ordinal), Chi-square tests (Greenwood and Nikulin 1996) were used to estimate the P values using the 'chisq.test' function in R
For multiple hypothesis correction, Q value is the False Discovery Rate (FDR) analogue of the P value (Benjamini and Hochberg 1995), defined as the minimum FDR at which the test may be called significant. We used the 'Benjamini and Hochberg' method of 'p.adjust' function in R to convert P values into Q values.
This is an experimental feature. The full results of the analysis summarized in this report can be downloaded from the TCGA Data Coordination Center.