This pipeline uses various statistical tests to identify genes whose promoter methylation levels correlated to selected clinical features.
Testing the association between 19728 genes and 7 clinical features across 69 samples, statistically thresholded by Q value < 0.05, 5 clinical features related to at least one genes.
-
2 genes correlated to 'GENDER'.
-
ALG11__1 , UTP14C
-
14 genes correlated to 'DISTANT.METASTASIS'.
-
SEPSECS , C5ORF42 , BIVM , KDELC1 , GOLGA7 , ...
-
50 genes correlated to 'LYMPH.NODE.METASTASIS'.
-
LDHAL6B , MYO1E , MORC1 , HECA , SYTL3 , ...
-
12 genes correlated to 'COMPLETENESS.OF.RESECTION'.
-
SEPSECS , C5ORF42 , BIVM , KDELC1 , GOLGA7 , ...
-
44 genes correlated to 'NEOPLASM.DISEASESTAGE'.
-
SEPSECS , LDHAL6B , MYO1E , MORC1 , HECA , ...
-
No genes correlated to 'Time to Death', and 'AGE'.
Complete statistical result table is provided in Supplement Table 1
Table 1. Get Full Table This table shows the clinical features, statistical methods used, and the number of genes that are significantly associated with each clinical feature at Q value < 0.05.
| Clinical feature | Statistical test | Significant genes | Associated with | Associated with | ||
|---|---|---|---|---|---|---|
| Time to Death | Cox regression test | N=0 | ||||
| AGE | Spearman correlation test | N=0 | ||||
| GENDER | t test | N=2 | male | N=2 | female | N=0 |
| DISTANT METASTASIS | ANOVA test | N=14 | ||||
| LYMPH NODE METASTASIS | ANOVA test | N=50 | ||||
| COMPLETENESS OF RESECTION | ANOVA test | N=12 | ||||
| NEOPLASM DISEASESTAGE | ANOVA test | N=44 |
Table S1. Basic characteristics of clinical feature: 'Time to Death'
| Time to Death | Duration (Months) | 0.1-90.7 (median=11.5) |
| censored | N = 39 | |
| death | N = 23 | |
| Significant markers | N = 0 |
Table S2. Basic characteristics of clinical feature: 'AGE'
| AGE | Mean (SD) | 59.27 (15) |
| Significant markers | N = 0 |
Table S3. Basic characteristics of clinical feature: 'GENDER'
| GENDER | Labels | N |
| FEMALE | 24 | |
| MALE | 45 | |
| Significant markers | N = 2 | |
| Higher in MALE | 2 | |
| Higher in FEMALE | 0 |
Table S4. Get Full Table List of 2 genes differentially expressed by 'GENDER'
| T(pos if higher in 'MALE') | ttestP | Q | AUC | |
|---|---|---|---|---|
| ALG11__1 | 9.57 | 3.879e-10 | 7.65e-06 | 0.9556 |
| UTP14C | 9.57 | 3.879e-10 | 7.65e-06 | 0.9556 |
Figure S1. Get High-res Image As an example, this figure shows the association of ALG11__1 to 'GENDER'. P value = 3.88e-10 with T-test analysis.
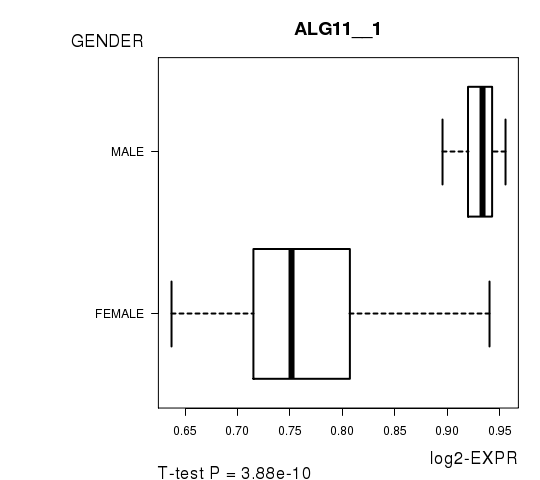
Table S5. Basic characteristics of clinical feature: 'DISTANT.METASTASIS'
| DISTANT.METASTASIS | Labels | N |
| M0 | 48 | |
| M1 | 1 | |
| MX | 20 | |
| Significant markers | N = 14 |
Table S6. Get Full Table List of top 10 genes differentially expressed by 'DISTANT.METASTASIS'
| ANOVA_P | Q | |
|---|---|---|
| SEPSECS | 1.602e-49 | 3.16e-45 |
| C5ORF42 | 2.678e-16 | 5.28e-12 |
| BIVM | 7.362e-14 | 1.45e-09 |
| KDELC1 | 7.362e-14 | 1.45e-09 |
| GOLGA7 | 7.105e-12 | 1.4e-07 |
| C4ORF12 | 1.443e-08 | 0.000285 |
| WDFY3 | 1.443e-08 | 0.000285 |
| HDLBP | 5.299e-08 | 0.00105 |
| SEPT2 | 5.299e-08 | 0.00105 |
| MGMT | 1.605e-07 | 0.00316 |
Figure S2. Get High-res Image As an example, this figure shows the association of SEPSECS to 'DISTANT.METASTASIS'. P value = 1.6e-49 with ANOVA analysis.
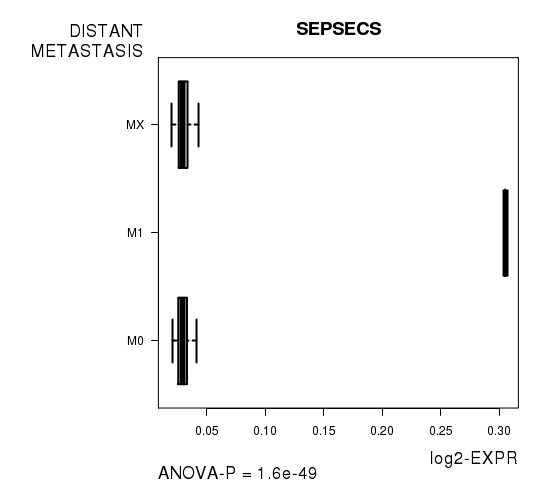
Table S7. Basic characteristics of clinical feature: 'LYMPH.NODE.METASTASIS'
| LYMPH.NODE.METASTASIS | Labels | N |
| N0 | 48 | |
| N1 | 1 | |
| NX | 19 | |
| Significant markers | N = 50 |
Table S8. Get Full Table List of top 10 genes differentially expressed by 'LYMPH.NODE.METASTASIS'
| ANOVA_P | Q | |
|---|---|---|
| LDHAL6B | 8.555e-40 | 1.69e-35 |
| MYO1E | 8.555e-40 | 1.69e-35 |
| MORC1 | 3.054e-35 | 6.02e-31 |
| HECA | 5.097e-31 | 1.01e-26 |
| SYTL3 | 7.418e-29 | 1.46e-24 |
| RAB20 | 9.31e-29 | 1.84e-24 |
| RFX2 | 2.07e-24 | 4.08e-20 |
| MAEL | 1.99e-22 | 3.92e-18 |
| ASB14 | 2.407e-18 | 4.75e-14 |
| DHX58 | 1.492e-17 | 2.94e-13 |
Figure S3. Get High-res Image As an example, this figure shows the association of LDHAL6B to 'LYMPH.NODE.METASTASIS'. P value = 8.56e-40 with ANOVA analysis.
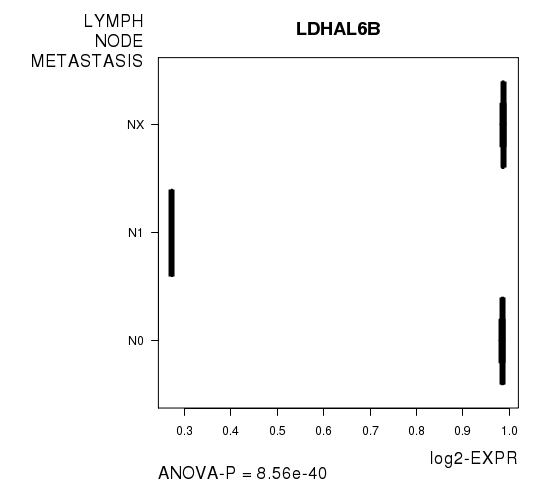
Table S9. Basic characteristics of clinical feature: 'COMPLETENESS.OF.RESECTION'
| COMPLETENESS.OF.RESECTION | Labels | N |
| R0 | 49 | |
| R1 | 5 | |
| R2 | 1 | |
| RX | 9 | |
| Significant markers | N = 12 |
Table S10. Get Full Table List of top 10 genes differentially expressed by 'COMPLETENESS.OF.RESECTION'
| ANOVA_P | Q | |
|---|---|---|
| SEPSECS | 4.057e-45 | 8e-41 |
| C5ORF42 | 6.783e-16 | 1.34e-11 |
| BIVM | 3.979e-12 | 7.85e-08 |
| KDELC1 | 3.979e-12 | 7.85e-08 |
| GOLGA7 | 1.966e-10 | 3.88e-06 |
| IREB2 | 6.378e-09 | 0.000126 |
| C4ORF12 | 3.533e-08 | 0.000697 |
| WDFY3 | 3.533e-08 | 0.000697 |
| HDLBP | 4.82e-07 | 0.0095 |
| SEPT2 | 4.82e-07 | 0.0095 |
Figure S4. Get High-res Image As an example, this figure shows the association of SEPSECS to 'COMPLETENESS.OF.RESECTION'. P value = 4.06e-45 with ANOVA analysis.
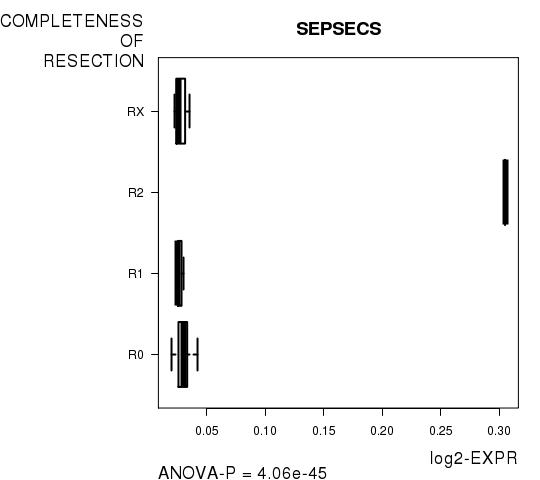
Table S11. Basic characteristics of clinical feature: 'NEOPLASM.DISEASESTAGE'
| NEOPLASM.DISEASESTAGE | Labels | N |
| STAGE I | 28 | |
| STAGE II | 12 | |
| STAGE IIIA | 15 | |
| STAGE IIIB | 4 | |
| STAGE IIIC | 1 | |
| STAGE IVB | 1 | |
| Significant markers | N = 44 |
Table S12. Get Full Table List of top 10 genes differentially expressed by 'NEOPLASM.DISEASESTAGE'
| ANOVA_P | Q | |
|---|---|---|
| SEPSECS | 1.289e-40 | 2.54e-36 |
| LDHAL6B | 7.607e-32 | 1.5e-27 |
| MYO1E | 7.607e-32 | 1.5e-27 |
| MORC1 | 5.066e-29 | 9.99e-25 |
| HECA | 1.373e-25 | 2.71e-21 |
| SYTL3 | 5.214e-24 | 1.03e-19 |
| RAB20 | 1.44e-23 | 2.84e-19 |
| MAEL | 1.528e-21 | 3.01e-17 |
| RFX2 | 1.575e-19 | 3.11e-15 |
| DHX58 | 1.643e-18 | 3.24e-14 |
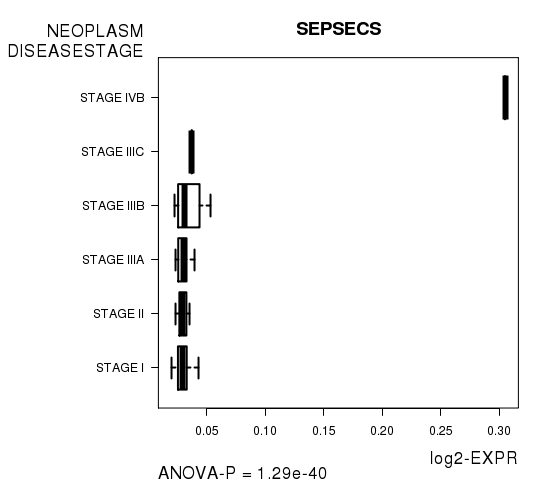
Figure S5. Get High-res Image As an example, this figure shows the association of SEPSECS to 'NEOPLASM.DISEASESTAGE'. P value = 1.29e-40 with ANOVA analysis.
-
Expresson data file = LIHC-TP.meth.by_min_expr_corr.data.txt
-
Clinical data file = LIHC-TP.clin.merged.picked.txt
-
Number of patients = 69
-
Number of genes = 19728
-
Number of clinical features = 7
For survival clinical features, Wald's test in univariate Cox regression analysis with proportional hazards model (Andersen and Gill 1982) was used to estimate the P values using the 'coxph' function in R. Kaplan-Meier survival curves were plot using the four quartile subgroups of patients based on expression levels
For continuous numerical clinical features, Spearman's rank correlation coefficients (Spearman 1904) and two-tailed P values were estimated using 'cor.test' function in R
For two-class clinical features, two-tailed Student's t test with unequal variance (Lehmann and Romano 2005) was applied to compare the log2-expression levels between the two clinical classes using 't.test' function in R
For multi-class clinical features (ordinal or nominal), one-way analysis of variance (Howell 2002) was applied to compare the log2-expression levels between different clinical classes using 'anova' function in R
For multiple hypothesis correction, Q value is the False Discovery Rate (FDR) analogue of the P value (Benjamini and Hochberg 1995), defined as the minimum FDR at which the test may be called significant. We used the 'Benjamini and Hochberg' method of 'p.adjust' function in R to convert P values into Q values.
This is an experimental feature. The full results of the analysis summarized in this report can be downloaded from the TCGA Data Coordination Center.