This pipeline uses various statistical tests to identify mRNAs whose expression levels correlated to selected clinical features.
Testing the association between 17848 genes and 7 clinical features across 60 samples, statistically thresholded by Q value < 0.05, 4 clinical features related to at least one genes.
-
8 genes correlated to 'GENDER'.
-
XIST|7503 , TSIX|9383 , ZFY|7544 , KDM5C|8242 , EIF1AX|1964 , ...
-
6 genes correlated to 'LYMPH.NODE.METASTASIS'.
-
DTX3L|151636 , CCDC111|201973 , CASP3|836 , MID2|11043 , ACY3|91703 , ...
-
1 gene correlated to 'COMPLETENESS.OF.RESECTION'.
-
SLC16A11|162515
-
5 genes correlated to 'NEOPLASM.DISEASESTAGE'.
-
CCDC111|201973 , SGEF|26084 , CASP3|836 , DTX3L|151636 , ACY3|91703
-
No genes correlated to 'Time to Death', 'AGE', and 'DISTANT.METASTASIS'.
Complete statistical result table is provided in Supplement Table 1
Table 1. Get Full Table This table shows the clinical features, statistical methods used, and the number of genes that are significantly associated with each clinical feature at Q value < 0.05.
| Clinical feature | Statistical test | Significant genes | Associated with | Associated with | ||
|---|---|---|---|---|---|---|
| Time to Death | Cox regression test | N=0 | ||||
| AGE | Spearman correlation test | N=0 | ||||
| GENDER | t test | N=8 | male | N=4 | female | N=4 |
| DISTANT METASTASIS | ANOVA test | N=0 | ||||
| LYMPH NODE METASTASIS | ANOVA test | N=6 | ||||
| COMPLETENESS OF RESECTION | ANOVA test | N=1 | ||||
| NEOPLASM DISEASESTAGE | ANOVA test | N=5 |
Table S1. Basic characteristics of clinical feature: 'Time to Death'
| Time to Death | Duration (Months) | 0.1-83.6 (median=14.3) |
| censored | N = 32 | |
| death | N = 23 | |
| Significant markers | N = 0 |
Table S2. Basic characteristics of clinical feature: 'AGE'
| AGE | Mean (SD) | 59.66 (15) |
| Significant markers | N = 0 |
Table S3. Basic characteristics of clinical feature: 'GENDER'
| GENDER | Labels | N |
| FEMALE | 23 | |
| MALE | 37 | |
| Significant markers | N = 8 | |
| Higher in MALE | 4 | |
| Higher in FEMALE | 4 |
Table S4. Get Full Table List of 8 genes differentially expressed by 'GENDER'
| T(pos if higher in 'MALE') | ttestP | Q | AUC | |
|---|---|---|---|---|
| XIST|7503 | -14.22 | 1.96e-15 | 3.5e-11 | 0.9861 |
| TSIX|9383 | -9.48 | 5.074e-10 | 9.05e-06 | 0.9814 |
| ZFY|7544 | 12.05 | 2.187e-08 | 0.00039 | 0.9919 |
| KDM5C|8242 | -6.19 | 6.706e-08 | 0.0012 | 0.8719 |
| EIF1AX|1964 | -6.31 | 7.425e-08 | 0.00132 | 0.8754 |
| NLGN4Y|22829 | 9.56 | 1.155e-07 | 0.00206 | 0.9811 |
| PRKY|5616 | 9.24 | 6.111e-07 | 0.0109 | 0.9842 |
| TERF1|7013 | 5.46 | 1.228e-06 | 0.0219 | 0.8496 |
Figure S1. Get High-res Image As an example, this figure shows the association of XIST|7503 to 'GENDER'. P value = 1.96e-15 with T-test analysis.
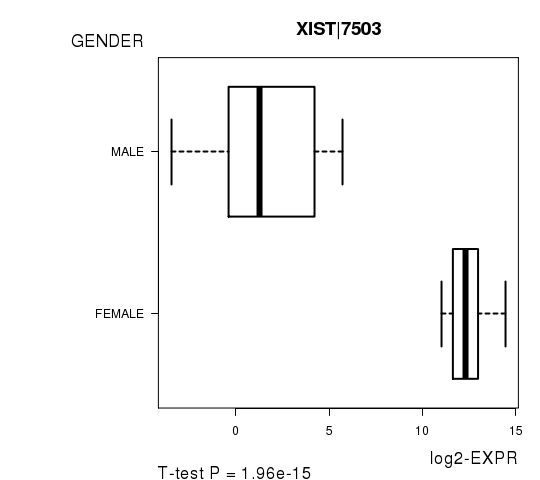
Table S5. Basic characteristics of clinical feature: 'DISTANT.METASTASIS'
| DISTANT.METASTASIS | Labels | N |
| M0 | 39 | |
| M1 | 1 | |
| MX | 20 | |
| Significant markers | N = 0 |
Table S6. Basic characteristics of clinical feature: 'LYMPH.NODE.METASTASIS'
| LYMPH.NODE.METASTASIS | Labels | N |
| N0 | 40 | |
| N1 | 1 | |
| NX | 18 | |
| Significant markers | N = 6 |
Table S7. Get Full Table List of 6 genes differentially expressed by 'LYMPH.NODE.METASTASIS'
| ANOVA_P | Q | |
|---|---|---|
| DTX3L|151636 | 7.274e-10 | 1.3e-05 |
| CCDC111|201973 | 8.218e-10 | 1.47e-05 |
| CASP3|836 | 4.664e-09 | 8.32e-05 |
| MID2|11043 | 4.705e-07 | 0.0084 |
| ACY3|91703 | 1.268e-06 | 0.0226 |
| PARP14|54625 | 1.724e-06 | 0.0308 |
Figure S2. Get High-res Image As an example, this figure shows the association of DTX3L|151636 to 'LYMPH.NODE.METASTASIS'. P value = 7.27e-10 with ANOVA analysis.
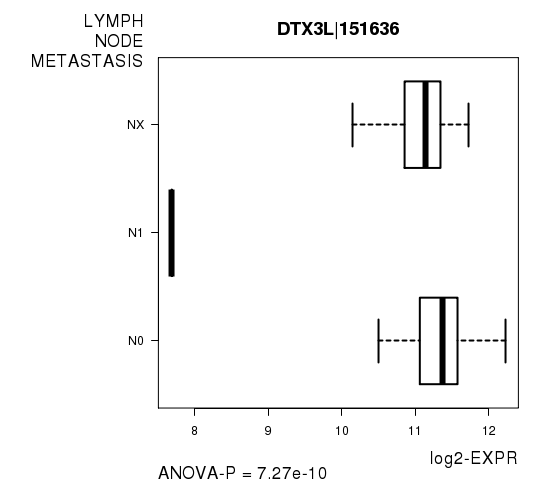
Table S8. Basic characteristics of clinical feature: 'COMPLETENESS.OF.RESECTION'
| COMPLETENESS.OF.RESECTION | Labels | N |
| R0 | 43 | |
| R1 | 7 | |
| R2 | 1 | |
| RX | 6 | |
| Significant markers | N = 1 |
Table S9. Get Full Table List of one gene differentially expressed by 'COMPLETENESS.OF.RESECTION'
| ANOVA_P | Q | |
|---|---|---|
| SLC16A11|162515 | 5.168e-08 | 0.000922 |
Figure S3. Get High-res Image As an example, this figure shows the association of SLC16A11|162515 to 'COMPLETENESS.OF.RESECTION'. P value = 5.17e-08 with ANOVA analysis.
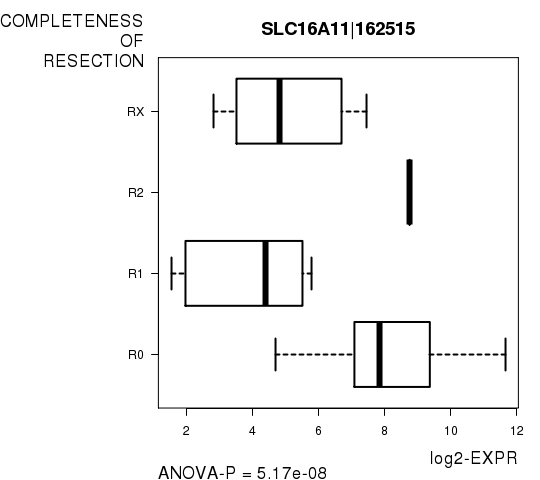
Table S10. Basic characteristics of clinical feature: 'NEOPLASM.DISEASESTAGE'
| NEOPLASM.DISEASESTAGE | Labels | N |
| STAGE I | 23 | |
| STAGE II | 11 | |
| STAGE IIIA | 13 | |
| STAGE IIIB | 3 | |
| STAGE IIIC | 1 | |
| STAGE IVB | 1 | |
| Significant markers | N = 5 |
Table S11. Get Full Table List of 5 genes differentially expressed by 'NEOPLASM.DISEASESTAGE'
| ANOVA_P | Q | |
|---|---|---|
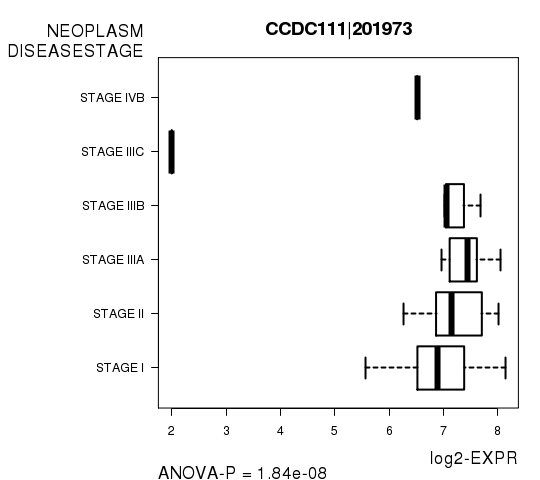
| CCDC111|201973 | 1.841e-08 | 0.000329 |
| SGEF|26084 | 2.555e-08 | 0.000456 |
| CASP3|836 | 7.189e-08 | 0.00128 |
| DTX3L|151636 | 7.863e-08 | 0.0014 |
| ACY3|91703 | 1.423e-07 | 0.00254 |
Figure S4. Get High-res Image As an example, this figure shows the association of CCDC111|201973 to 'NEOPLASM.DISEASESTAGE'. P value = 1.84e-08 with ANOVA analysis.
-
Expresson data file = LIHC-TP.uncv2.mRNAseq_RSEM_normalized_log2.txt
-
Clinical data file = LIHC-TP.clin.merged.picked.txt
-
Number of patients = 60
-
Number of genes = 17848
-
Number of clinical features = 7
For survival clinical features, Wald's test in univariate Cox regression analysis with proportional hazards model (Andersen and Gill 1982) was used to estimate the P values using the 'coxph' function in R. Kaplan-Meier survival curves were plot using the four quartile subgroups of patients based on expression levels
For continuous numerical clinical features, Spearman's rank correlation coefficients (Spearman 1904) and two-tailed P values were estimated using 'cor.test' function in R
For two-class clinical features, two-tailed Student's t test with unequal variance (Lehmann and Romano 2005) was applied to compare the log2-expression levels between the two clinical classes using 't.test' function in R
For multi-class clinical features (ordinal or nominal), one-way analysis of variance (Howell 2002) was applied to compare the log2-expression levels between different clinical classes using 'anova' function in R
For multiple hypothesis correction, Q value is the False Discovery Rate (FDR) analogue of the P value (Benjamini and Hochberg 1995), defined as the minimum FDR at which the test may be called significant. We used the 'Benjamini and Hochberg' method of 'p.adjust' function in R to convert P values into Q values.
This is an experimental feature. The full results of the analysis summarized in this report can be downloaded from the TCGA Data Coordination Center.