This pipeline uses various statistical tests to identify mRNAs whose expression levels correlated to selected clinical features.
Testing the association between 17814 genes and 8 clinical features across 32 samples, statistically thresholded by Q value < 0.05, 2 clinical features related to at least one genes.
-
1 gene correlated to 'LYMPH.NODE.METASTASIS'.
-
RTN4IP1
-
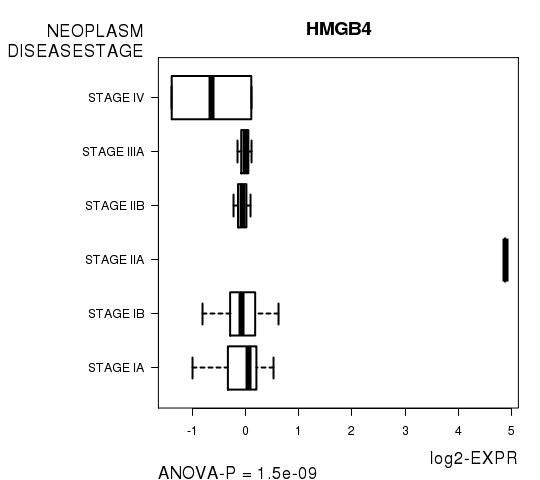
16 genes correlated to 'NEOPLASM.DISEASESTAGE'.
-
HMGB4 , FGF21 , KCNK10 , SPAG11B , EDC3 , ...
-
No genes correlated to 'Time to Death', 'AGE', 'GENDER', 'KARNOFSKY.PERFORMANCE.SCORE', 'NUMBERPACKYEARSSMOKED', and 'YEAROFTOBACCOSMOKINGONSET'.
Complete statistical result table is provided in Supplement Table 1
Table 1. Get Full Table This table shows the clinical features, statistical methods used, and the number of genes that are significantly associated with each clinical feature at Q value < 0.05.
| Clinical feature | Statistical test | Significant genes | Associated with | Associated with | ||
|---|---|---|---|---|---|---|
| Time to Death | Cox regression test | N=0 | ||||
| AGE | Spearman correlation test | N=0 | ||||
| GENDER | t test | N=0 | ||||
| KARNOFSKY PERFORMANCE SCORE | Spearman correlation test | N=0 | ||||
| NUMBERPACKYEARSSMOKED | Spearman correlation test | N=0 | ||||
| YEAROFTOBACCOSMOKINGONSET | Spearman correlation test | N=0 | ||||
| LYMPH NODE METASTASIS | ANOVA test | N=1 | ||||
| NEOPLASM DISEASESTAGE | ANOVA test | N=16 |
Table S1. Basic characteristics of clinical feature: 'Time to Death'
| Time to Death | Duration (Months) | 0.5-56.8 (median=14) |
| censored | N = 27 | |
| death | N = 4 | |
| Significant markers | N = 0 |
Table S2. Basic characteristics of clinical feature: 'AGE'
| AGE | Mean (SD) | 65.7 (11) |
| Significant markers | N = 0 |
Table S3. Basic characteristics of clinical feature: 'GENDER'
| GENDER | Labels | N |
| FEMALE | 18 | |
| MALE | 14 | |
| Significant markers | N = 0 |
No gene related to 'KARNOFSKY.PERFORMANCE.SCORE'.
Table S4. Basic characteristics of clinical feature: 'KARNOFSKY.PERFORMANCE.SCORE'
| KARNOFSKY.PERFORMANCE.SCORE | Mean (SD) | 56.67 (49) |
| Score | N | |
| 0 | 1 | |
| 80 | 1 | |
| 90 | 1 | |
| Significant markers | N = 0 |
Table S5. Basic characteristics of clinical feature: 'NUMBERPACKYEARSSMOKED'
| NUMBERPACKYEARSSMOKED | Mean (SD) | 41.15 (15) |
| Significant markers | N = 0 |
Table S6. Basic characteristics of clinical feature: 'YEAROFTOBACCOSMOKINGONSET'
| YEAROFTOBACCOSMOKINGONSET | Mean (SD) | 1968.53 (11) |
| Significant markers | N = 0 |
Table S7. Basic characteristics of clinical feature: 'LYMPH.NODE.METASTASIS'
| LYMPH.NODE.METASTASIS | Labels | N |
| N0 | 23 | |
| N1 | 4 | |
| N2 | 4 | |
| NX | 1 | |
| Significant markers | N = 1 |
Table S8. Get Full Table List of one gene differentially expressed by 'LYMPH.NODE.METASTASIS'
| ANOVA_P | Q | |
|---|---|---|
| RTN4IP1 | 1.542e-06 | 0.0275 |
Figure S1. Get High-res Image As an example, this figure shows the association of RTN4IP1 to 'LYMPH.NODE.METASTASIS'. P value = 1.54e-06 with ANOVA analysis.
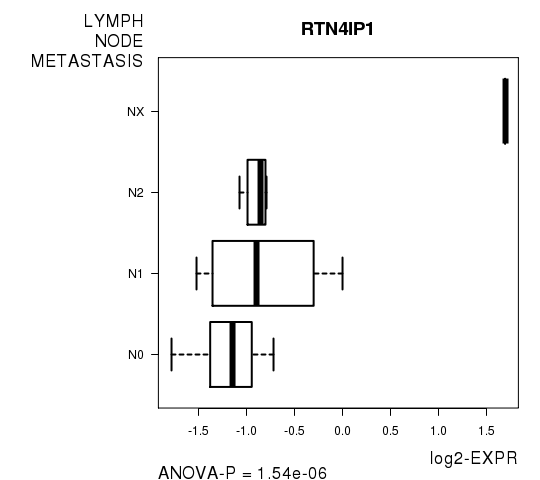
Table S9. Basic characteristics of clinical feature: 'NEOPLASM.DISEASESTAGE'
| NEOPLASM.DISEASESTAGE | Labels | N |
| STAGE IA | 12 | |
| STAGE IB | 11 | |
| STAGE IIA | 1 | |
| STAGE IIB | 3 | |
| STAGE IIIA | 3 | |
| STAGE IV | 2 | |
| Significant markers | N = 16 |
Table S10. Get Full Table List of top 10 genes differentially expressed by 'NEOPLASM.DISEASESTAGE'
| ANOVA_P | Q | |
|---|---|---|
| HMGB4 | 1.497e-09 | 2.67e-05 |
| FGF21 | 2.968e-09 | 5.29e-05 |
| KCNK10 | 4.947e-09 | 8.81e-05 |
| SPAG11B | 6.282e-09 | 0.000112 |
| EDC3 | 1.483e-08 | 0.000264 |
| SERPINB11 | 2.222e-08 | 0.000396 |
| NTS | 5.821e-08 | 0.00104 |
| NLRP11 | 9.497e-08 | 0.00169 |
| PRB1 | 2.339e-07 | 0.00416 |
| NLRP5 | 6.754e-07 | 0.012 |
Figure S2. Get High-res Image As an example, this figure shows the association of HMGB4 to 'NEOPLASM.DISEASESTAGE'. P value = 1.5e-09 with ANOVA analysis.
-
Expresson data file = LUAD-TP.medianexp.txt
-
Clinical data file = LUAD-TP.clin.merged.picked.txt
-
Number of patients = 32
-
Number of genes = 17814
-
Number of clinical features = 8
For survival clinical features, Wald's test in univariate Cox regression analysis with proportional hazards model (Andersen and Gill 1982) was used to estimate the P values using the 'coxph' function in R. Kaplan-Meier survival curves were plot using the four quartile subgroups of patients based on expression levels
For continuous numerical clinical features, Spearman's rank correlation coefficients (Spearman 1904) and two-tailed P values were estimated using 'cor.test' function in R
For two-class clinical features, two-tailed Student's t test with unequal variance (Lehmann and Romano 2005) was applied to compare the log2-expression levels between the two clinical classes using 't.test' function in R
For multi-class clinical features (ordinal or nominal), one-way analysis of variance (Howell 2002) was applied to compare the log2-expression levels between different clinical classes using 'anova' function in R
For multiple hypothesis correction, Q value is the False Discovery Rate (FDR) analogue of the P value (Benjamini and Hochberg 1995), defined as the minimum FDR at which the test may be called significant. We used the 'Benjamini and Hochberg' method of 'p.adjust' function in R to convert P values into Q values.
This is an experimental feature. The full results of the analysis summarized in this report can be downloaded from the TCGA Data Coordination Center.