This report serves to describe the mutational landscape and properties of a given individual set, as well as rank genes and genesets according to mutational significance. MutSig v1.5 was used to generate the results found in this report.
-
Working with individual set: LUSC-TP
-
Number of patients in set: 178
The input for this pipeline is a set of individuals with the following files associated for each:
-
An annotated .maf file describing the mutations called for the respective individual, and their properties.
-
A .wig file that contains information about the coverage of the sample.
-
MAF used for this analysis:LUSC-TP.final_analysis_set.maf
-
Significantly mutated genes (q ≤ 0.1): 114
-
Mutations seen in COSMIC: 353
-
Significantly mutated genes in COSMIC territory: 11
-
Genes with clustered mutations (≤ 3 aa apart): 615
-
Significantly mutated genesets: 17
-
Significantly mutated genesets: (excluding sig. mutated genes):0
-
Read 178 MAFs of type "Broad"
-
Total number of mutations in input MAFs: 65305
-
After removing 2 mutations outside chr1-24: 65303
-
After removing 419 blacklisted mutations: 64884
-
After removing 588 noncoding mutations: 64296
-
Number of mutations before filtering: 64296
-
After removing 343 mutations outside gene set: 63953
-
After removing 47 mutations outside category set: 63906
-
After removing 2 "impossible" mutations in
-
gene-patient-category bins of zero coverage: 63514
Table 1. Get Full Table Table representing breakdown of mutations by type.
| type | count |
|---|---|
| Frame_Shift_Del | 513 |
| Frame_Shift_Ins | 119 |
| In_Frame_Del | 46 |
| In_Frame_Ins | 3 |
| Missense_Mutation | 42529 |
| Nonsense_Mutation | 3682 |
| Nonstop_Mutation | 55 |
| Silent | 15747 |
| Splice_Site | 1191 |
| Translation_Start_Site | 21 |
| Total | 63906 |
Table 2. Get Full Table A breakdown of mutation rates per category discovered for this individual set.
| category | n | N | rate | rate_per_mb | relative_rate | exp_ns_s_ratio |
|---|---|---|---|---|---|---|
| Tp*C->mut | 12975 | 692977947 | 0.000019 | 19 | 2 | 3.3 |
| (A/C/G)p*C->(A/T) | 17466 | 1964339776 | 8.9e-06 | 8.9 | 0.96 | 2.6 |
| (A/C/G)p*C->G | 3307 | 1964339776 | 1.7e-06 | 1.7 | 0.18 | 4.9 |
| A->mut | 8800 | 2561387954 | 3.4e-06 | 3.4 | 0.37 | 3.9 |
| indel+null | 5565 | 5218705677 | 1.1e-06 | 1.1 | 0.12 | NaN |
| double_null | 45 | 5218705677 | 8.6e-09 | 0.0086 | 0.00093 | NaN |
| Total | 48158 | 5218705677 | 9.2e-06 | 9.2 | 1 | 3.5 |
The x axis represents the samples. The y axis represents the exons, one row per exon, and they are sorted by average coverage across samples. For exons with exactly the same average coverage, they are sorted next by the %GC of the exon. (The secondary sort is especially useful for the zero-coverage exons at the bottom).
Figure 1.
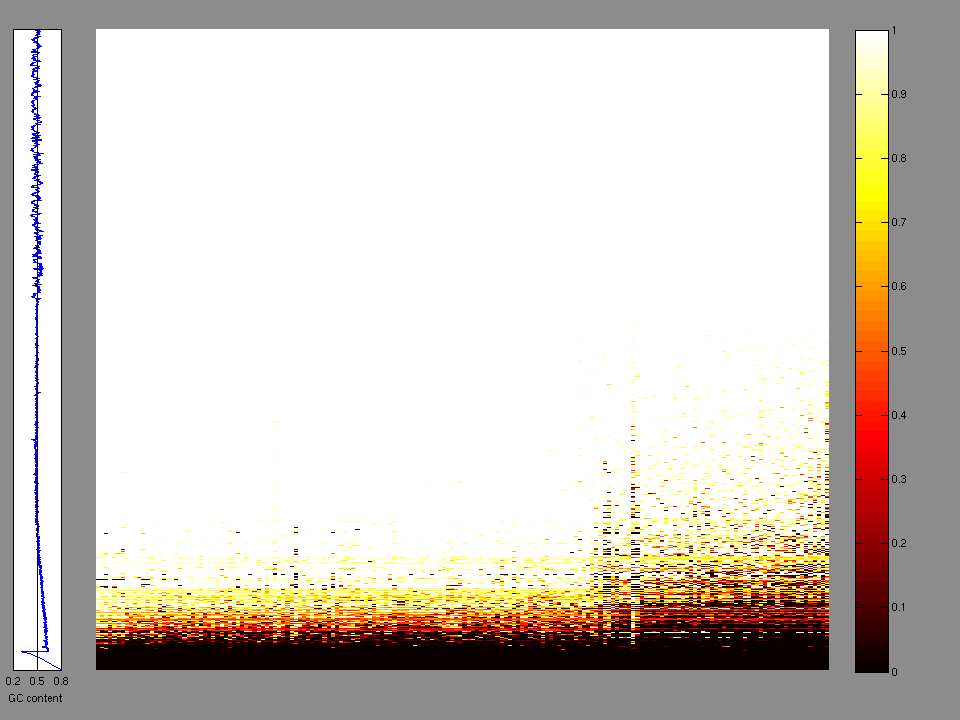
Figure 2. Patients counts and rates file used to generate this plot: LUSC-TP.patients.counts_and_rates.txt
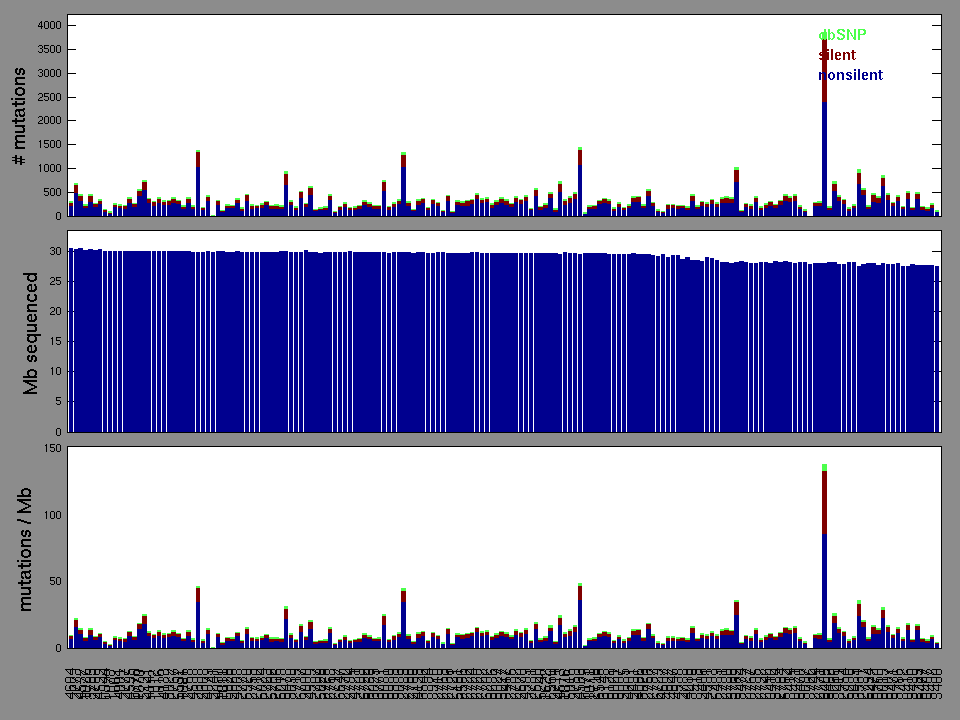
Figure 3. Needs description.
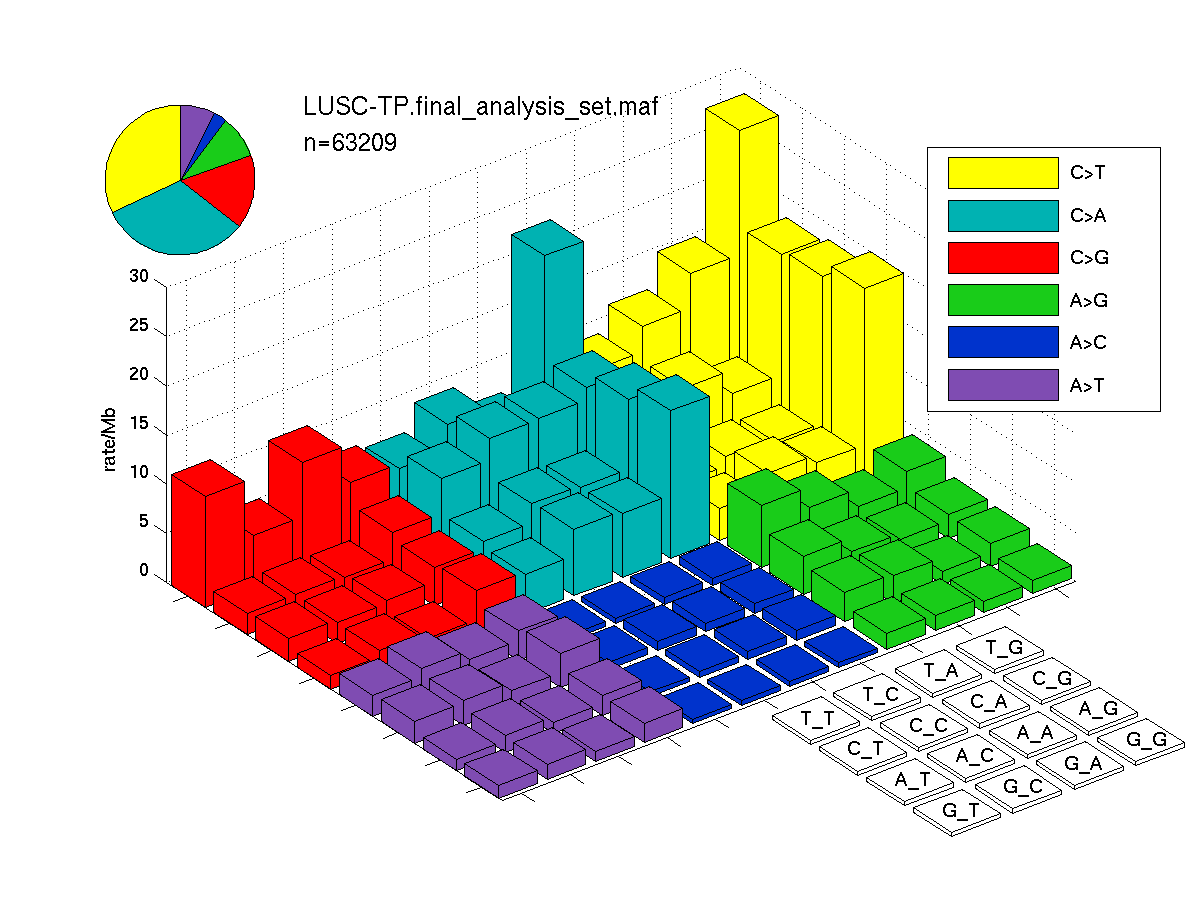
Figure 4. Needs description.
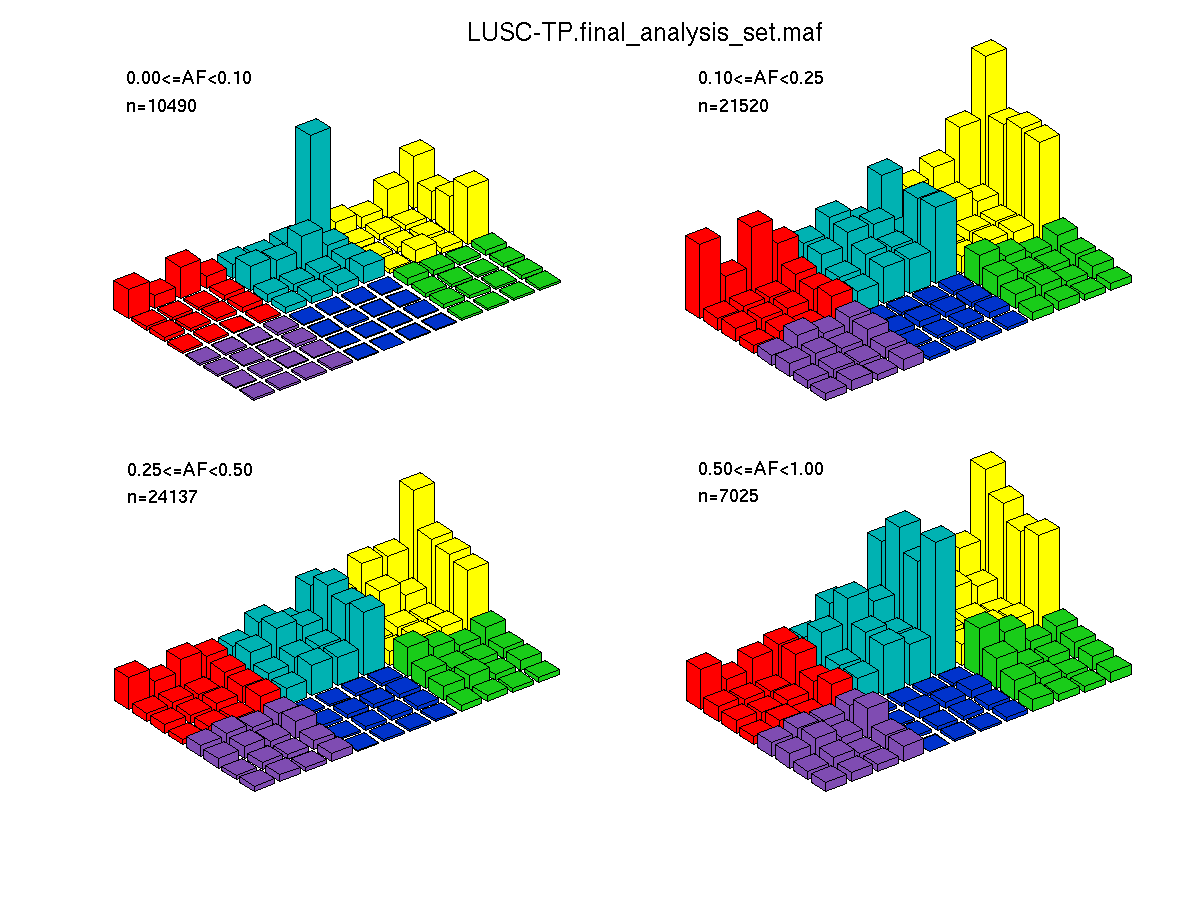
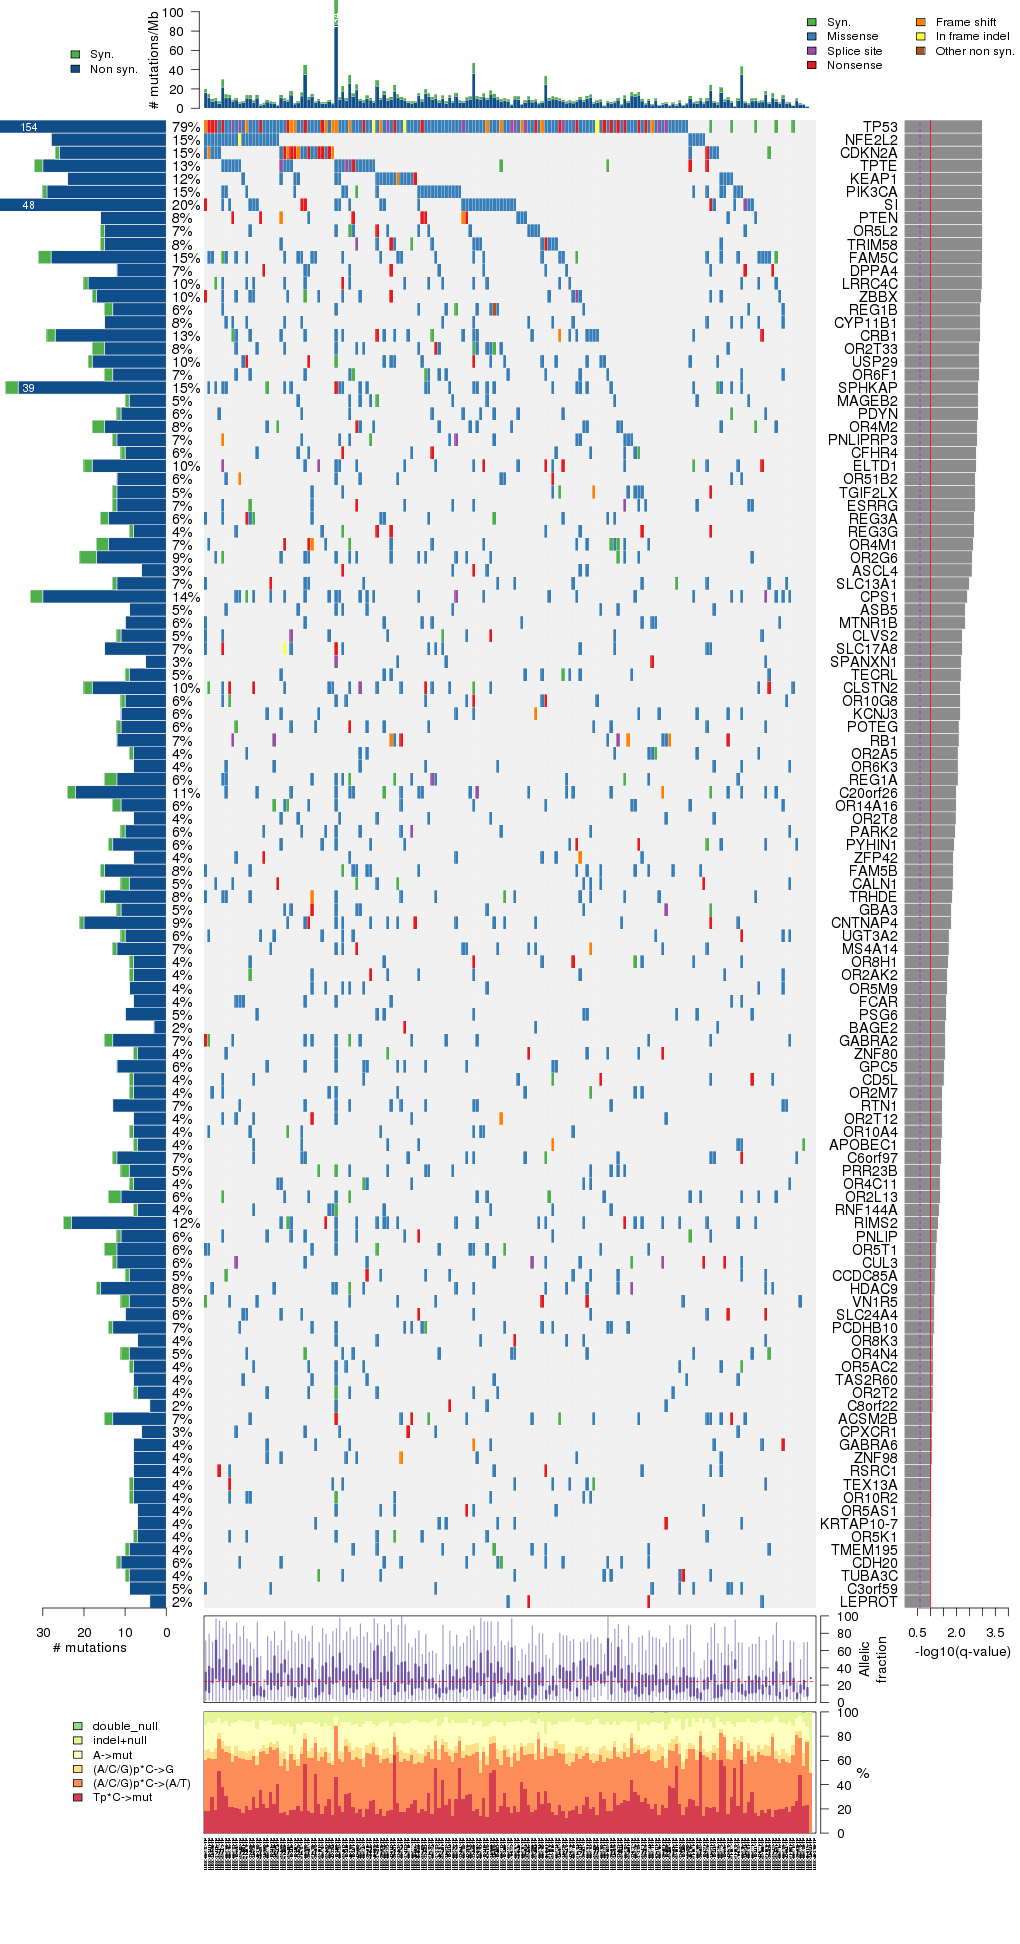
Figure 5. Get High-res Image The matrix in the center of the figure represents individual mutations in patient samples, color-coded by type of mutation, for the significantly mutated genes. The rate of synonymous and non-synonymous mutations is displayed at the top of the matrix. The barplot on the left of the matrix shows the number of mutations in each gene. The percentages represent the fraction of tumors with at least one mutation in the specified gene. The barplot to the right of the matrix displays the q-values for the most significantly mutated genes. The purple boxplots below the matrix (only displayed if required columns are present in the provided MAF) represent the distributions of allelic fractions observed in each sample. The plot at the bottom represents the base substitution distribution of individual samples, using the same categories that were used to calculate significance.
Column Descriptions:
-
N = number of sequenced bases in this gene across the individual set
-
n = number of (nonsilent) mutations in this gene across the individual set
-
npat = number of patients (individuals) with at least one nonsilent mutation
-
nsite = number of unique sites having a non-silent mutation
-
nsil = number of silent mutations in this gene across the individual set
-
n1 = number of nonsilent mutations of type: Tp*C->mut
-
n2 = number of nonsilent mutations of type: (A/C/G)p*C->(A/T)
-
n3 = number of nonsilent mutations of type: (A/C/G)p*C->G
-
n4 = number of nonsilent mutations of type: A->mut
-
n5 = number of nonsilent mutations of type: indel+null
-
n6 = number of nonsilent mutations of type: double_null
-
p_ns_s = p-value for the observed nonsilent/silent ratio being elevated in this gene
-
p = p-value (overall)
-
q = q-value, False Discovery Rate (Benjamini-Hochberg procedure)
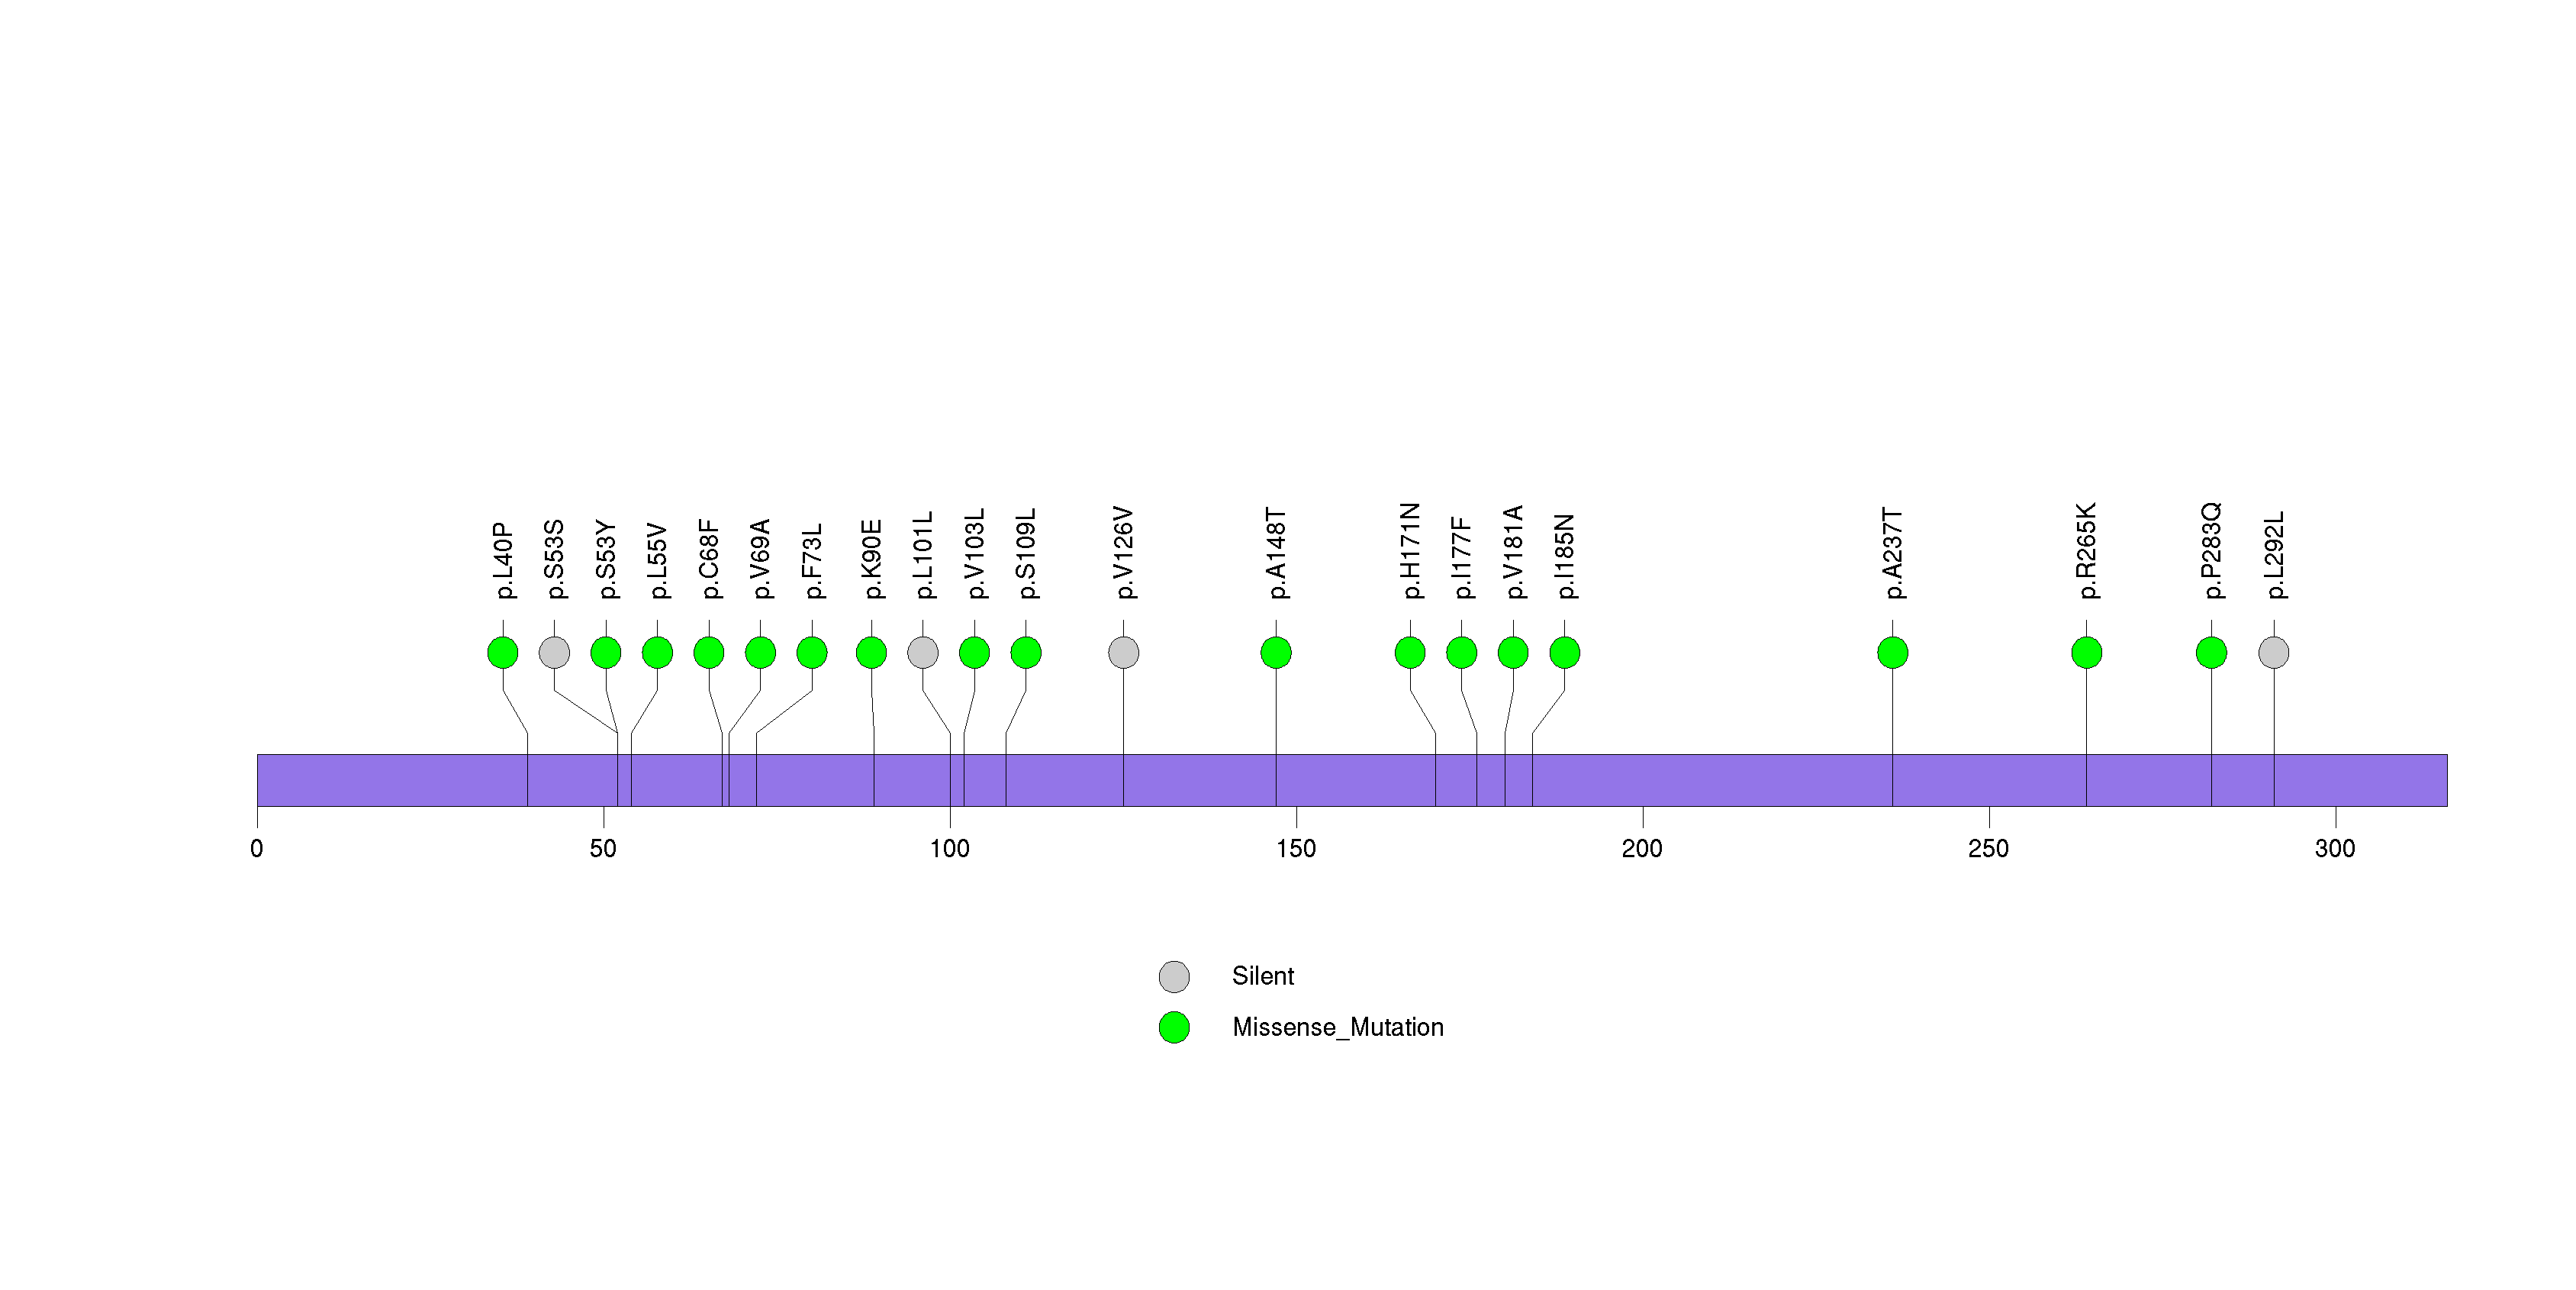
Table 3. Get Full Table A Ranked List of Significantly Mutated Genes. Number of significant genes found: 114. Number of genes displayed: 35. Click on a gene name to display its stick figure depicting the distribution of mutations and mutation types across the chosen gene (this feature may not be available for all significant genes).
| rank | gene | description | N | n | npat | nsite | nsil | n1 | n2 | n3 | n4 | n5 | n6 | p_ns_s | p | q |
|---|---|---|---|---|---|---|---|---|---|---|---|---|---|---|---|---|
| 1 | TP53 | tumor protein p53 | 218677 | 147 | 141 | 98 | 7 | 9 | 42 | 17 | 32 | 47 | 0 | 4e-09 | <1.00e-15 | <1.80e-11 |
| 2 | NFE2L2 | nuclear factor (erythroid-derived 2)-like 2 | 318204 | 28 | 27 | 15 | 0 | 19 | 4 | 0 | 4 | 1 | 0 | 0.007 | 4.77e-15 | 3.00e-11 |
| 3 | CDKN2A | cyclin-dependent kinase inhibitor 2A (melanoma, p16, inhibits CDK4) | 134387 | 26 | 26 | 23 | 1 | 5 | 5 | 2 | 2 | 12 | 0 | 0.016 | 5.33e-15 | 3.00e-11 |
| 4 | TPTE | transmembrane phosphatase with tensin homology | 308873 | 30 | 24 | 29 | 2 | 10 | 4 | 2 | 9 | 5 | 0 | 0.034 | 6.66e-15 | 3.00e-11 |
| 5 | KEAP1 | kelch-like ECH-associated protein 1 | 312991 | 24 | 22 | 21 | 0 | 9 | 9 | 2 | 2 | 2 | 0 | 0.00021 | 4.31e-13 | 1.55e-09 |
| 6 | PIK3CA | phosphoinositide-3-kinase, catalytic, alpha polypeptide | 583734 | 29 | 27 | 16 | 1 | 20 | 4 | 0 | 5 | 0 | 0 | 0.021 | 2.17e-12 | 6.52e-09 |
| 7 | SI | sucrase-isomaltase (alpha-glucosidase) | 995567 | 46 | 36 | 46 | 2 | 10 | 21 | 2 | 8 | 5 | 0 | 0.0066 | 7.17e-12 | 1.84e-08 |
| 8 | PTEN | phosphatase and tensin homolog (mutated in multiple advanced cancers 1) | 214719 | 16 | 14 | 15 | 0 | 4 | 1 | 0 | 3 | 8 | 0 | 0.1 | 1.10e-10 | 2.47e-07 |
| 9 | OR5L2 | olfactory receptor, family 5, subfamily L, member 2 | 167267 | 15 | 13 | 15 | 1 | 0 | 6 | 3 | 5 | 1 | 0 | 0.068 | 1.03e-09 | 2.06e-06 |
| 10 | TRIM58 | tripartite motif-containing 58 | 195196 | 15 | 15 | 15 | 1 | 2 | 8 | 1 | 1 | 3 | 0 | 0.052 | 1.45e-09 | 2.61e-06 |
| 11 | FAM5C | family with sequence similarity 5, member C | 412431 | 28 | 27 | 28 | 3 | 3 | 15 | 1 | 9 | 0 | 0 | 0.043 | 1.80e-09 | 2.95e-06 |
| 12 | DPPA4 | developmental pluripotency associated 4 | 167827 | 12 | 12 | 12 | 0 | 4 | 3 | 1 | 0 | 4 | 0 | 0.057 | 1.26e-08 | 1.89e-05 |
| 13 | LRRC4C | leucine rich repeat containing 4C | 342685 | 19 | 17 | 19 | 1 | 5 | 8 | 1 | 4 | 1 | 0 | 0.021 | 1.92e-08 | 2.66e-05 |
| 14 | ZBBX | zinc finger, B-box domain containing | 437517 | 17 | 17 | 17 | 1 | 4 | 4 | 1 | 5 | 3 | 0 | 0.13 | 7.22e-08 | 9.28e-05 |
| 15 | REG1B | regenerating islet-derived 1 beta (pancreatic stone protein, pancreatic thread protein) | 92608 | 13 | 11 | 11 | 2 | 6 | 4 | 0 | 2 | 1 | 0 | 0.29 | 1.31e-07 | 0.000157 |
| 16 | CYP11B1 | cytochrome P450, family 11, subfamily B, polypeptide 1 | 272922 | 15 | 15 | 15 | 0 | 0 | 11 | 1 | 3 | 0 | 0 | 0.0059 | 1.77e-07 | 0.000199 |
| 17 | CRB1 | crumbs homolog 1 (Drosophila) | 759065 | 27 | 23 | 27 | 2 | 8 | 6 | 1 | 9 | 3 | 0 | 0.043 | 1.90e-07 | 0.000201 |
| 18 | OR2T33 | olfactory receptor, family 2, subfamily T, member 33 | 171450 | 15 | 14 | 15 | 3 | 2 | 7 | 1 | 4 | 1 | 0 | 0.22 | 2.50e-07 | 0.000250 |
| 19 | USP29 | ubiquitin specific peptidase 29 | 493525 | 18 | 17 | 18 | 1 | 3 | 6 | 2 | 4 | 3 | 0 | 0.075 | 3.22e-07 | 0.000305 |
| 20 | OR6F1 | olfactory receptor, family 6, subfamily F, member 1 | 165718 | 13 | 13 | 13 | 2 | 2 | 6 | 1 | 4 | 0 | 0 | 0.19 | 3.48e-07 | 0.000313 |
| 21 | SPHKAP | SPHK1 interactor, AKAP domain containing | 911279 | 36 | 27 | 36 | 3 | 5 | 17 | 5 | 8 | 1 | 0 | 0.012 | 4.43e-07 | 0.000380 |
| 22 | MAGEB2 | melanoma antigen family B, 2 | 133192 | 9 | 9 | 9 | 1 | 2 | 4 | 2 | 1 | 0 | 0 | 0.26 | 5.40e-07 | 0.000436 |
| 23 | PDYN | prodynorphin | 137367 | 11 | 10 | 11 | 1 | 2 | 6 | 2 | 1 | 0 | 0 | 0.1 | 5.57e-07 | 0.000436 |
| 24 | OR4M2 | olfactory receptor, family 4, subfamily M, member 2 | 168054 | 15 | 14 | 15 | 3 | 1 | 7 | 0 | 6 | 1 | 0 | 0.31 | 6.77e-07 | 0.000495 |
| 25 | PNLIPRP3 | pancreatic lipase-related protein 3 | 257837 | 12 | 12 | 12 | 1 | 1 | 6 | 2 | 1 | 2 | 0 | 0.33 | 6.87e-07 | 0.000495 |
| 26 | CFHR4 | complement factor H-related 4 | 180409 | 10 | 10 | 10 | 1 | 0 | 4 | 1 | 3 | 2 | 0 | 0.35 | 9.01e-07 | 0.000619 |
| 27 | ELTD1 | EGF, latrophilin and seven transmembrane domain containing 1 | 365327 | 18 | 18 | 18 | 2 | 4 | 3 | 1 | 4 | 6 | 0 | 0.2 | 9.28e-07 | 0.000619 |
| 28 | OR51B2 | olfactory receptor, family 51, subfamily B, member 2 | 166648 | 12 | 10 | 11 | 0 | 2 | 4 | 1 | 3 | 2 | 0 | 0.045 | 1.21e-06 | 0.000775 |
| 29 | TGIF2LX | TGFB-induced factor homeobox 2-like, X-linked | 129265 | 12 | 9 | 12 | 1 | 2 | 2 | 0 | 6 | 2 | 0 | 0.21 | 1.37e-06 | 0.000848 |
| 30 | ESRRG | estrogen-related receptor gamma | 250009 | 12 | 12 | 12 | 1 | 2 | 5 | 1 | 2 | 2 | 0 | 0.13 | 1.41e-06 | 0.000848 |
| 31 | REG3A | regenerating islet-derived 3 alpha | 97465 | 14 | 11 | 14 | 2 | 1 | 8 | 3 | 1 | 1 | 0 | 0.16 | 1.58e-06 | 0.000920 |
| 32 | REG3G | regenerating islet-derived 3 gamma | 97540 | 8 | 8 | 8 | 1 | 1 | 3 | 0 | 0 | 4 | 0 | 0.26 | 1.67e-06 | 0.000937 |
| 33 | OR4M1 | olfactory receptor, family 4, subfamily M, member 1 | 167934 | 14 | 13 | 14 | 3 | 4 | 5 | 1 | 1 | 3 | 0 | 0.29 | 2.25e-06 | 0.00123 |
| 34 | OR2G6 | olfactory receptor, family 2, subfamily G, member 6 | 169883 | 17 | 16 | 17 | 4 | 3 | 6 | 1 | 7 | 0 | 0 | 0.27 | 2.58e-06 | 0.00137 |
| 35 | ASCL4 | achaete-scute complex homolog 4 (Drosophila) | 49103 | 6 | 6 | 6 | 0 | 0 | 2 | 1 | 1 | 2 | 0 | 0.12 | 2.86e-06 | 0.00147 |
Figure S1. This figure depicts the distribution of mutations and mutation types across the TP53 significant gene.
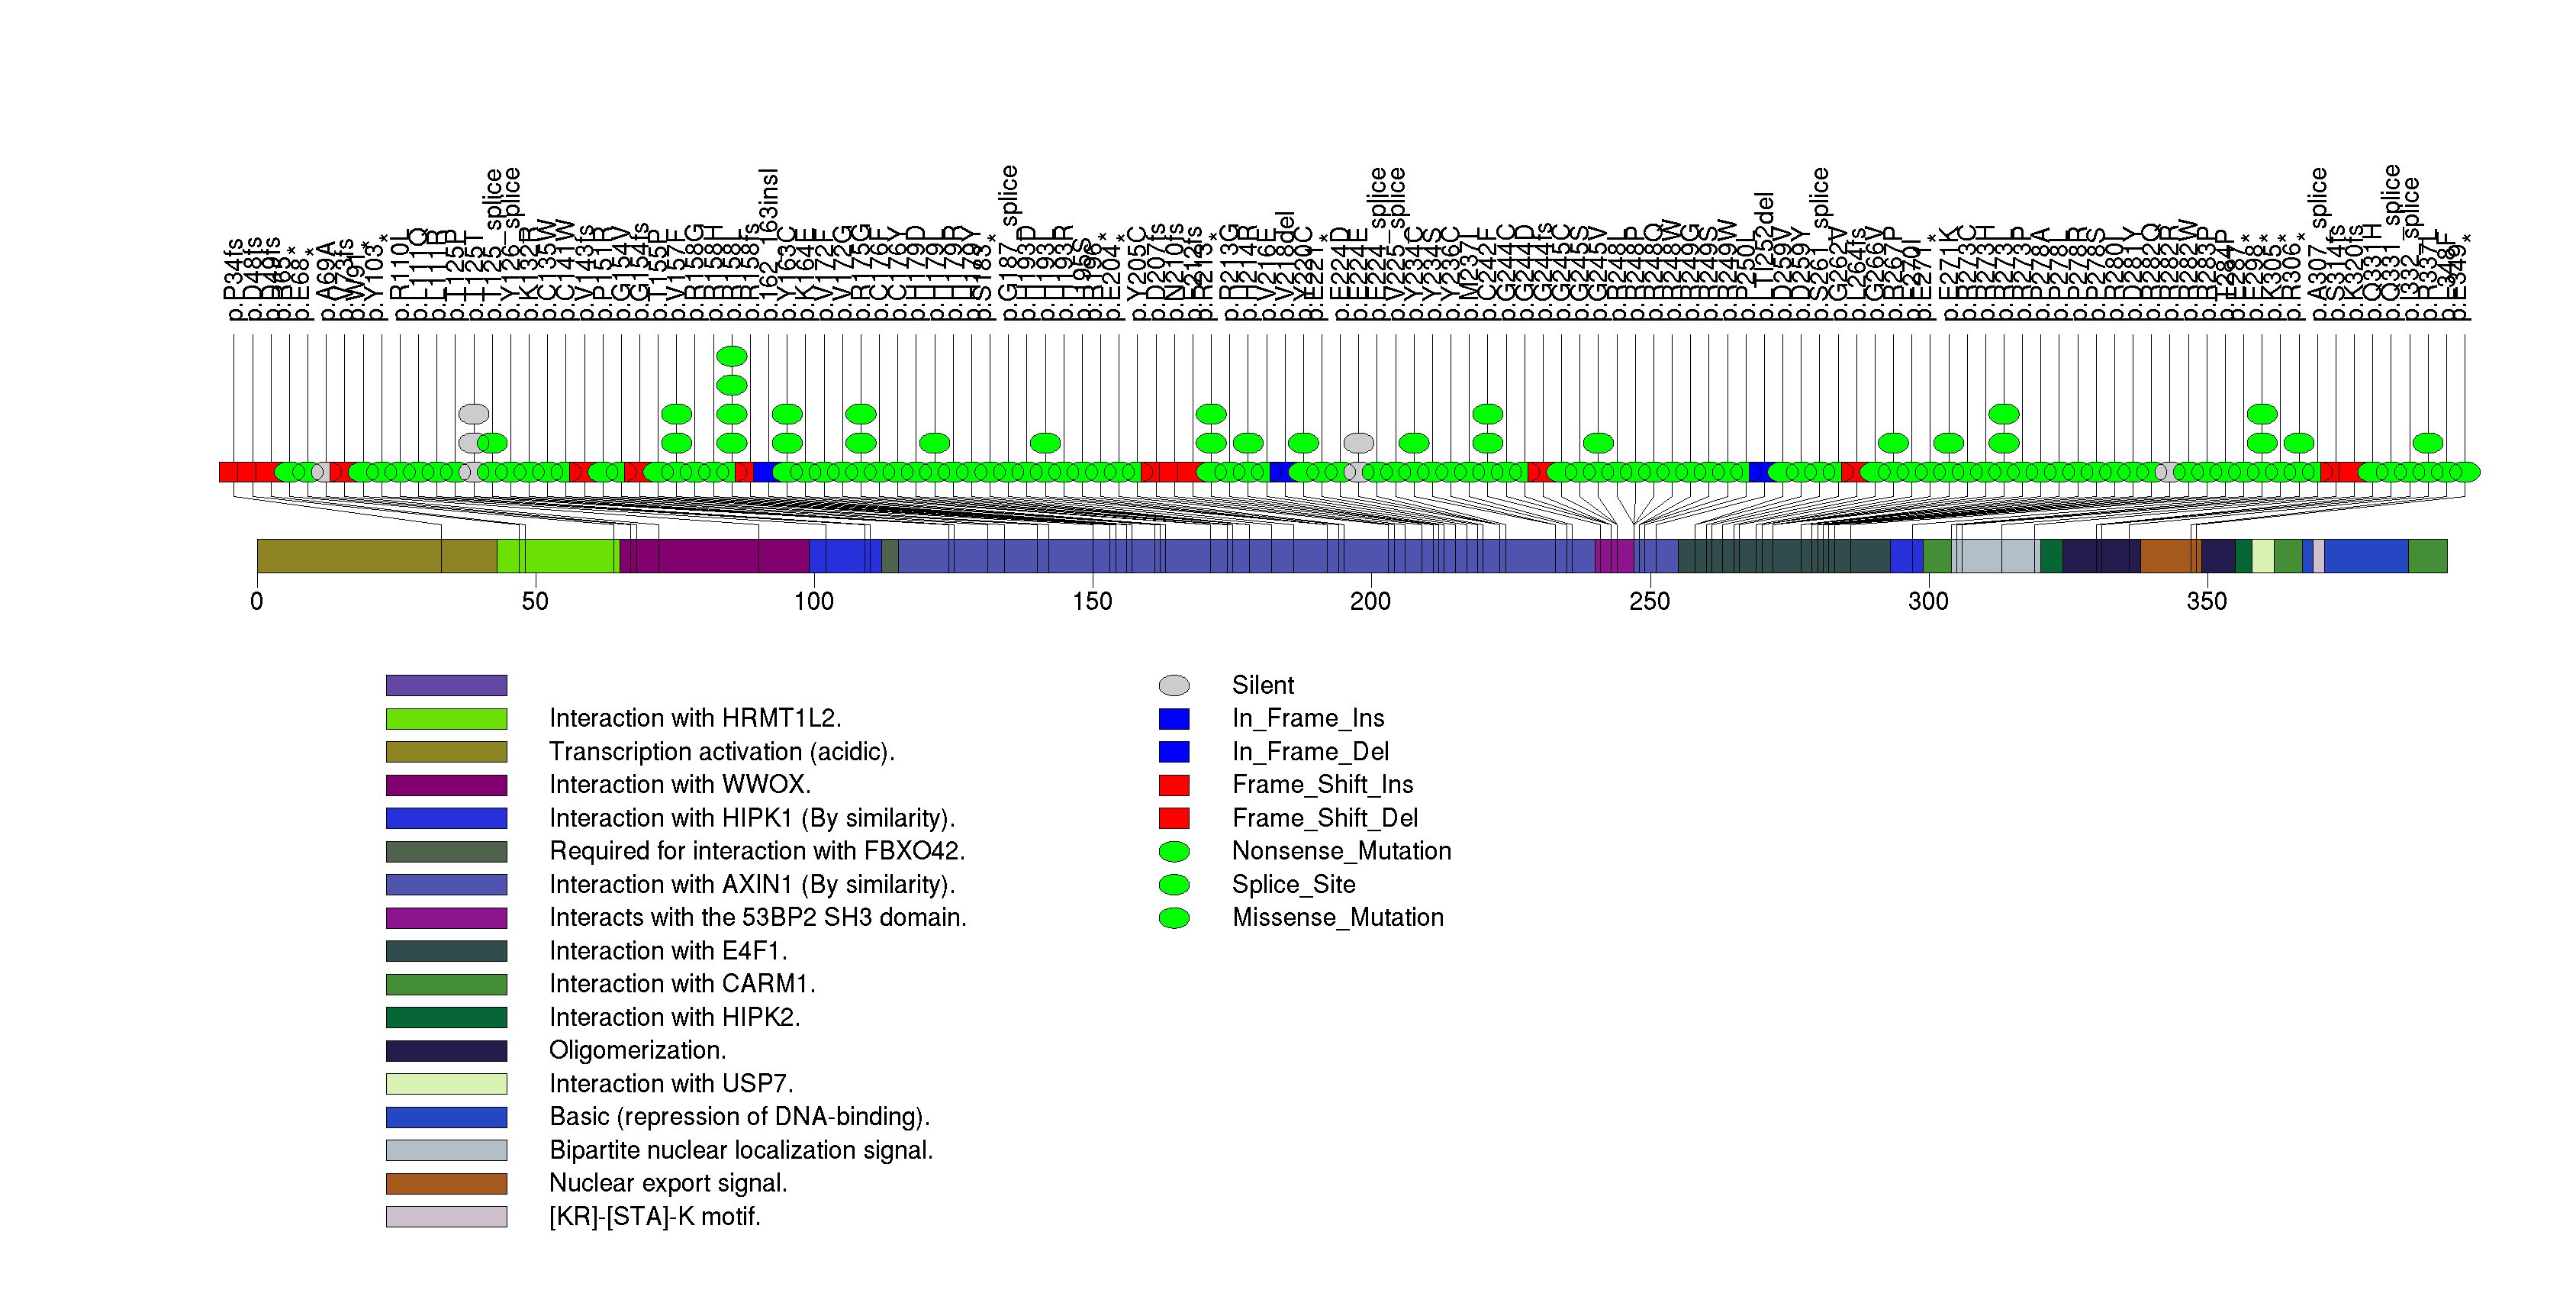
Figure S2. This figure depicts the distribution of mutations and mutation types across the NFE2L2 significant gene.
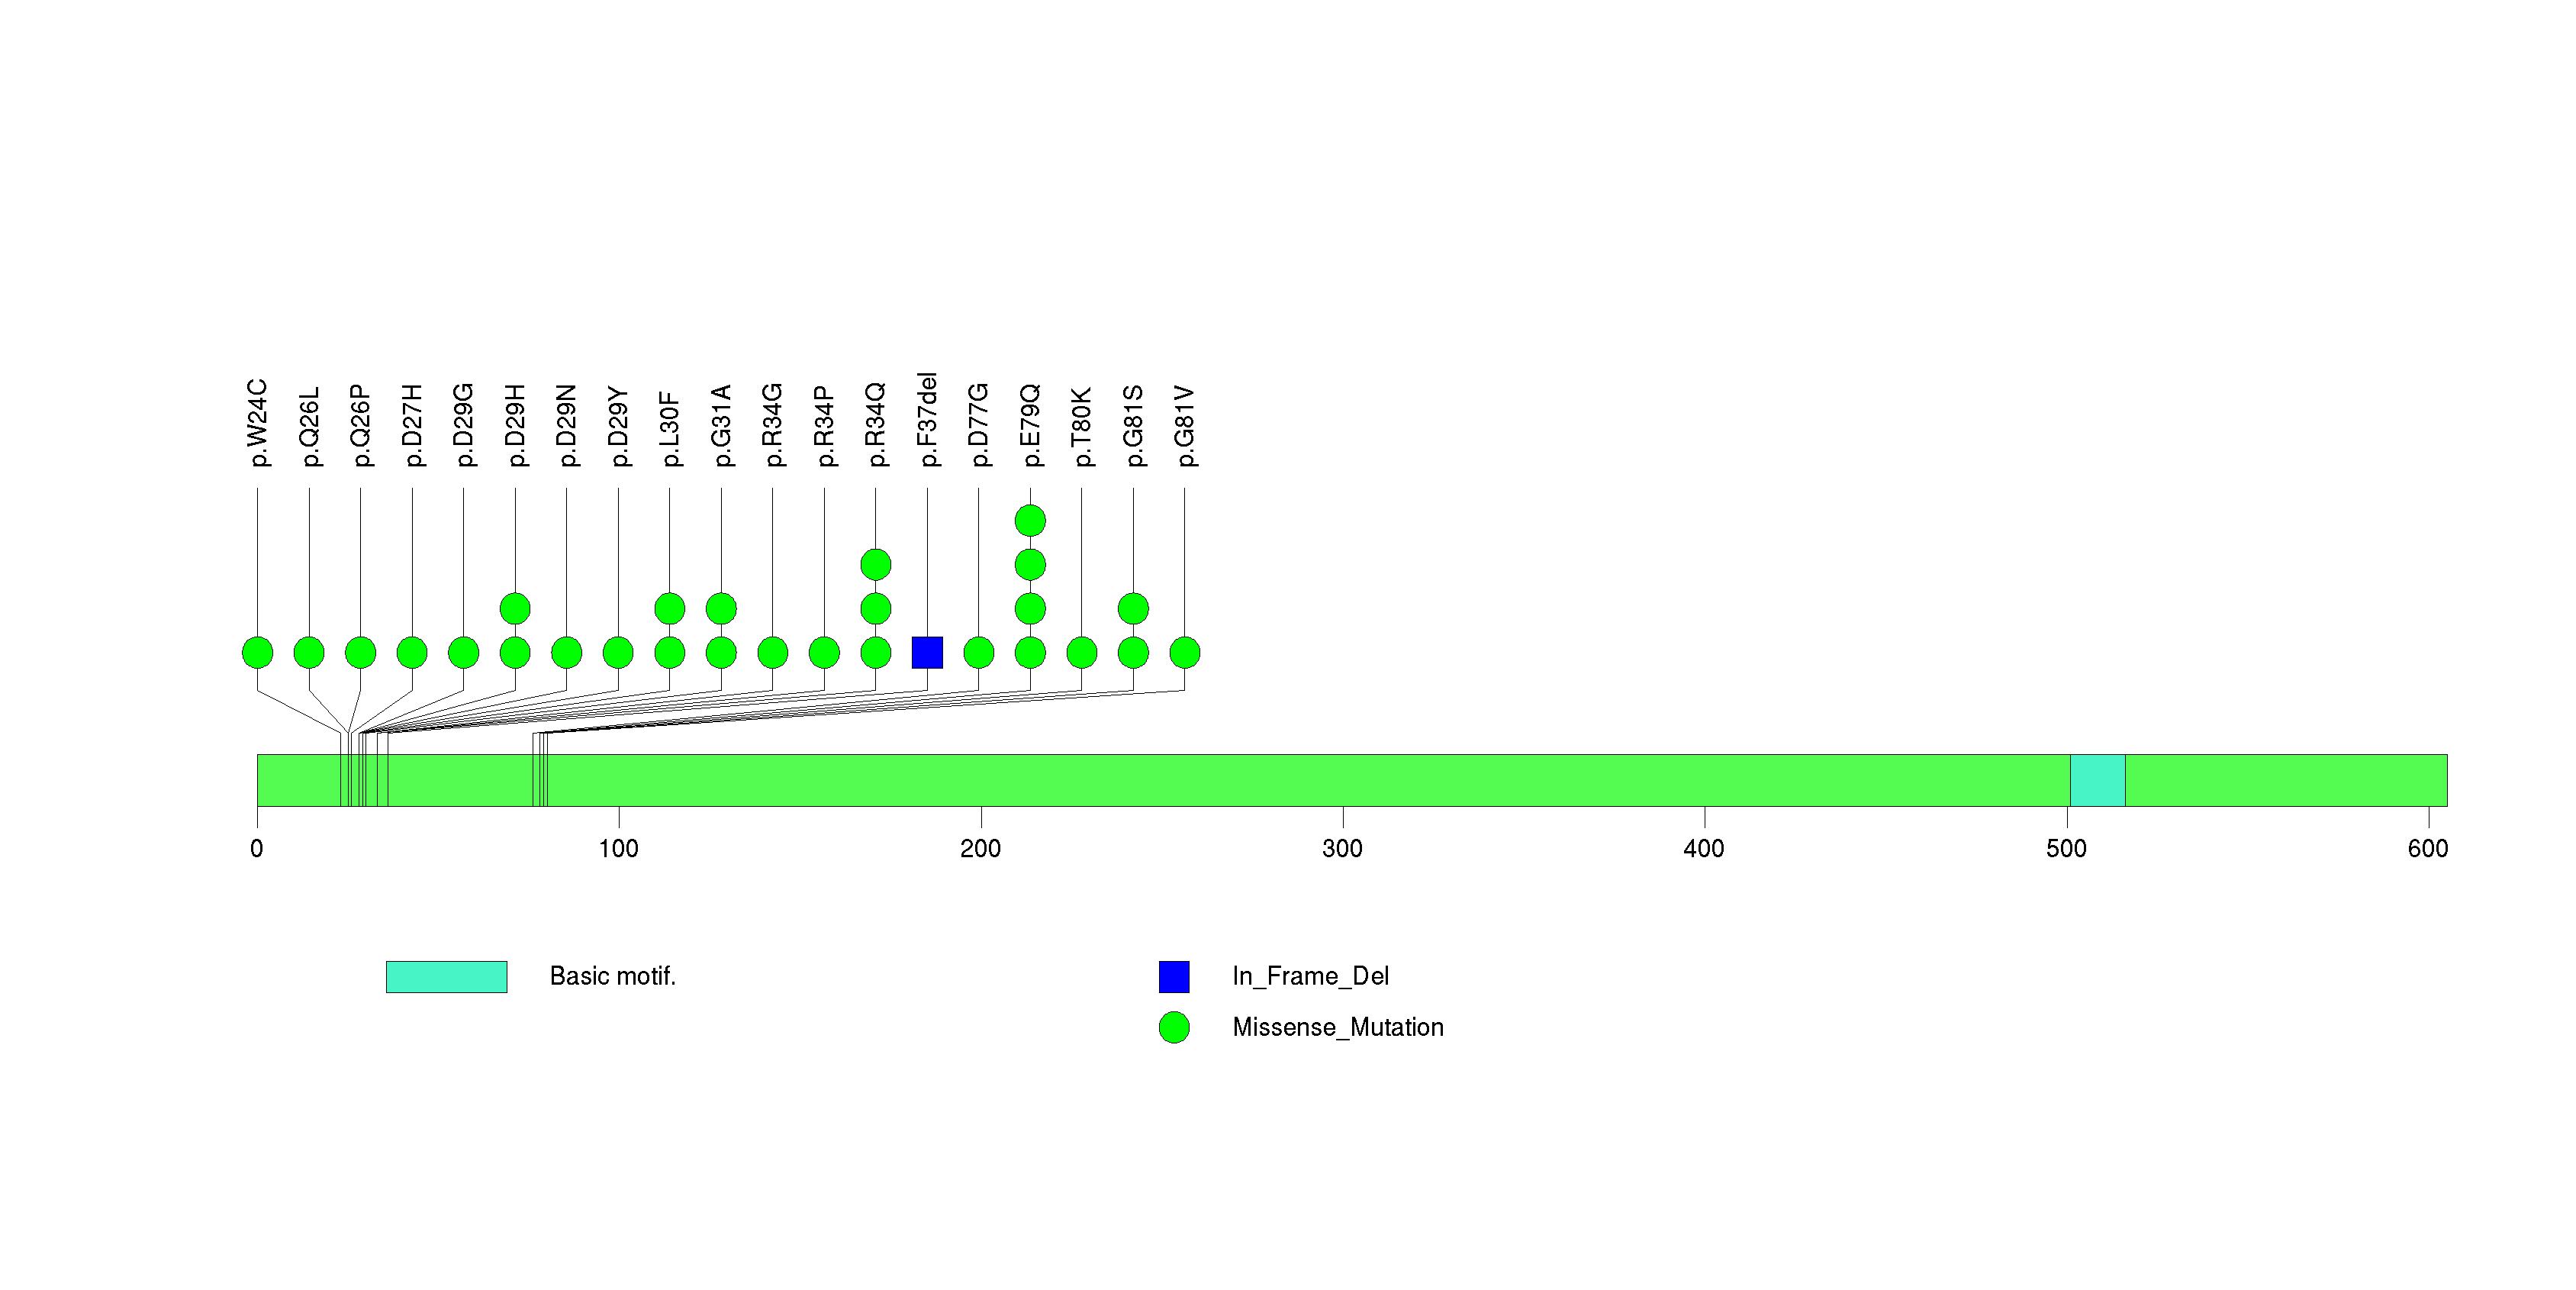
Figure S3. This figure depicts the distribution of mutations and mutation types across the CDKN2A significant gene.
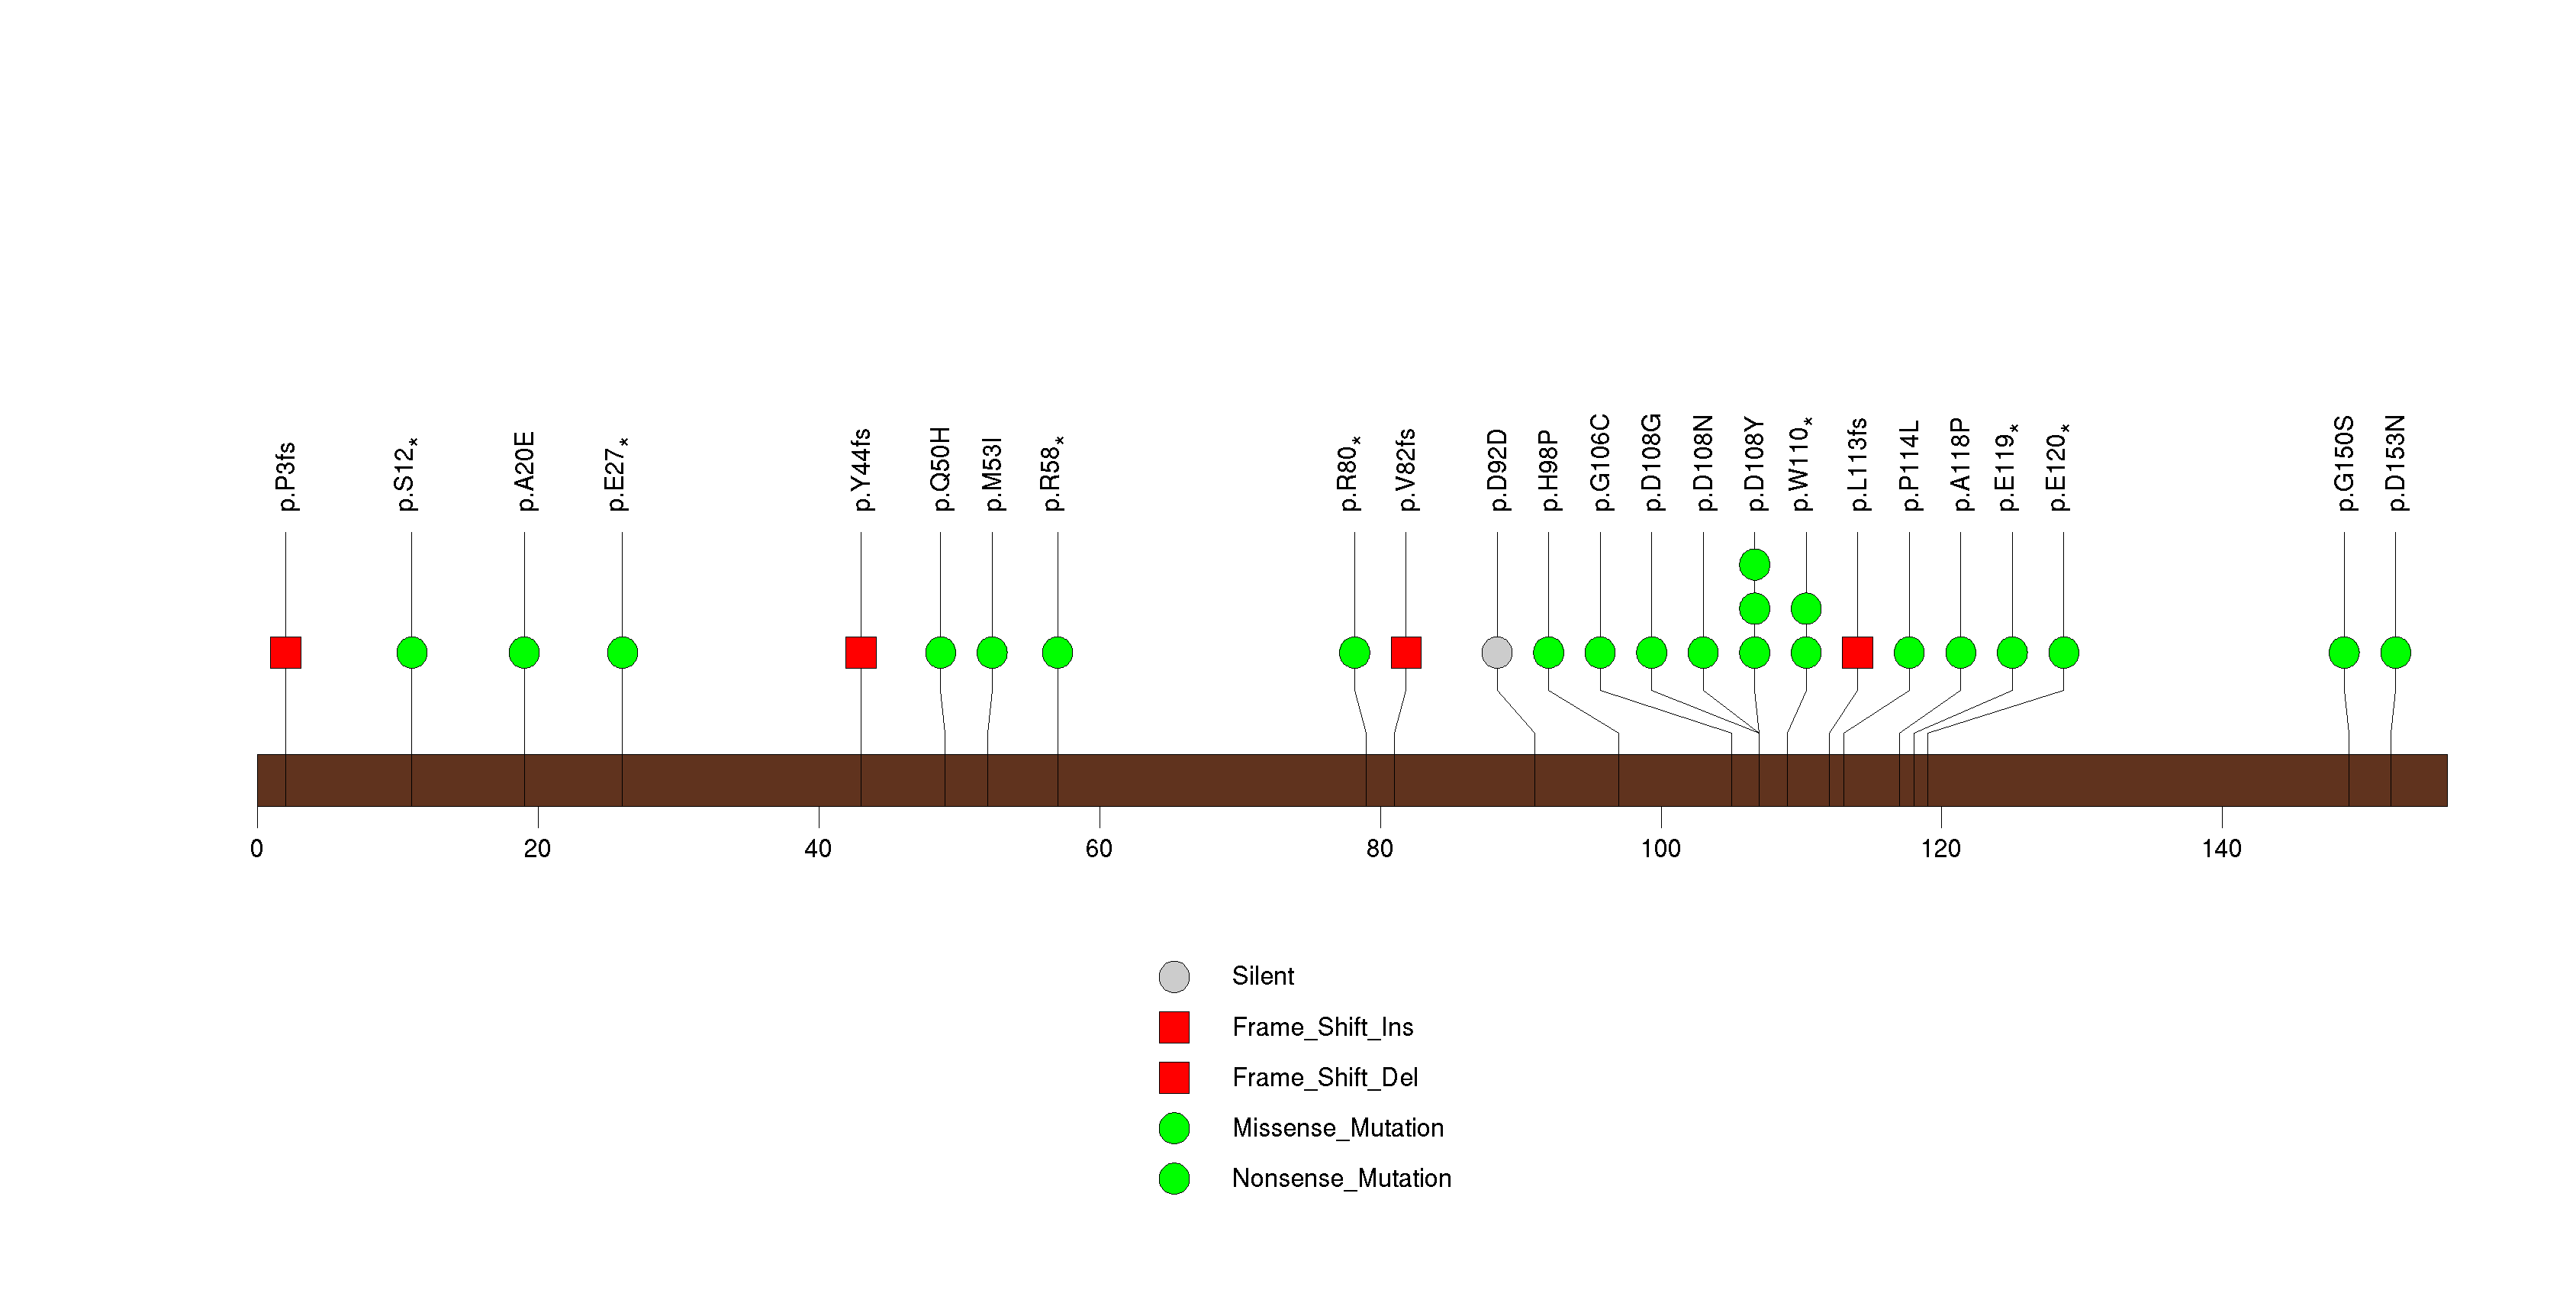
Figure S4. This figure depicts the distribution of mutations and mutation types across the TPTE significant gene.
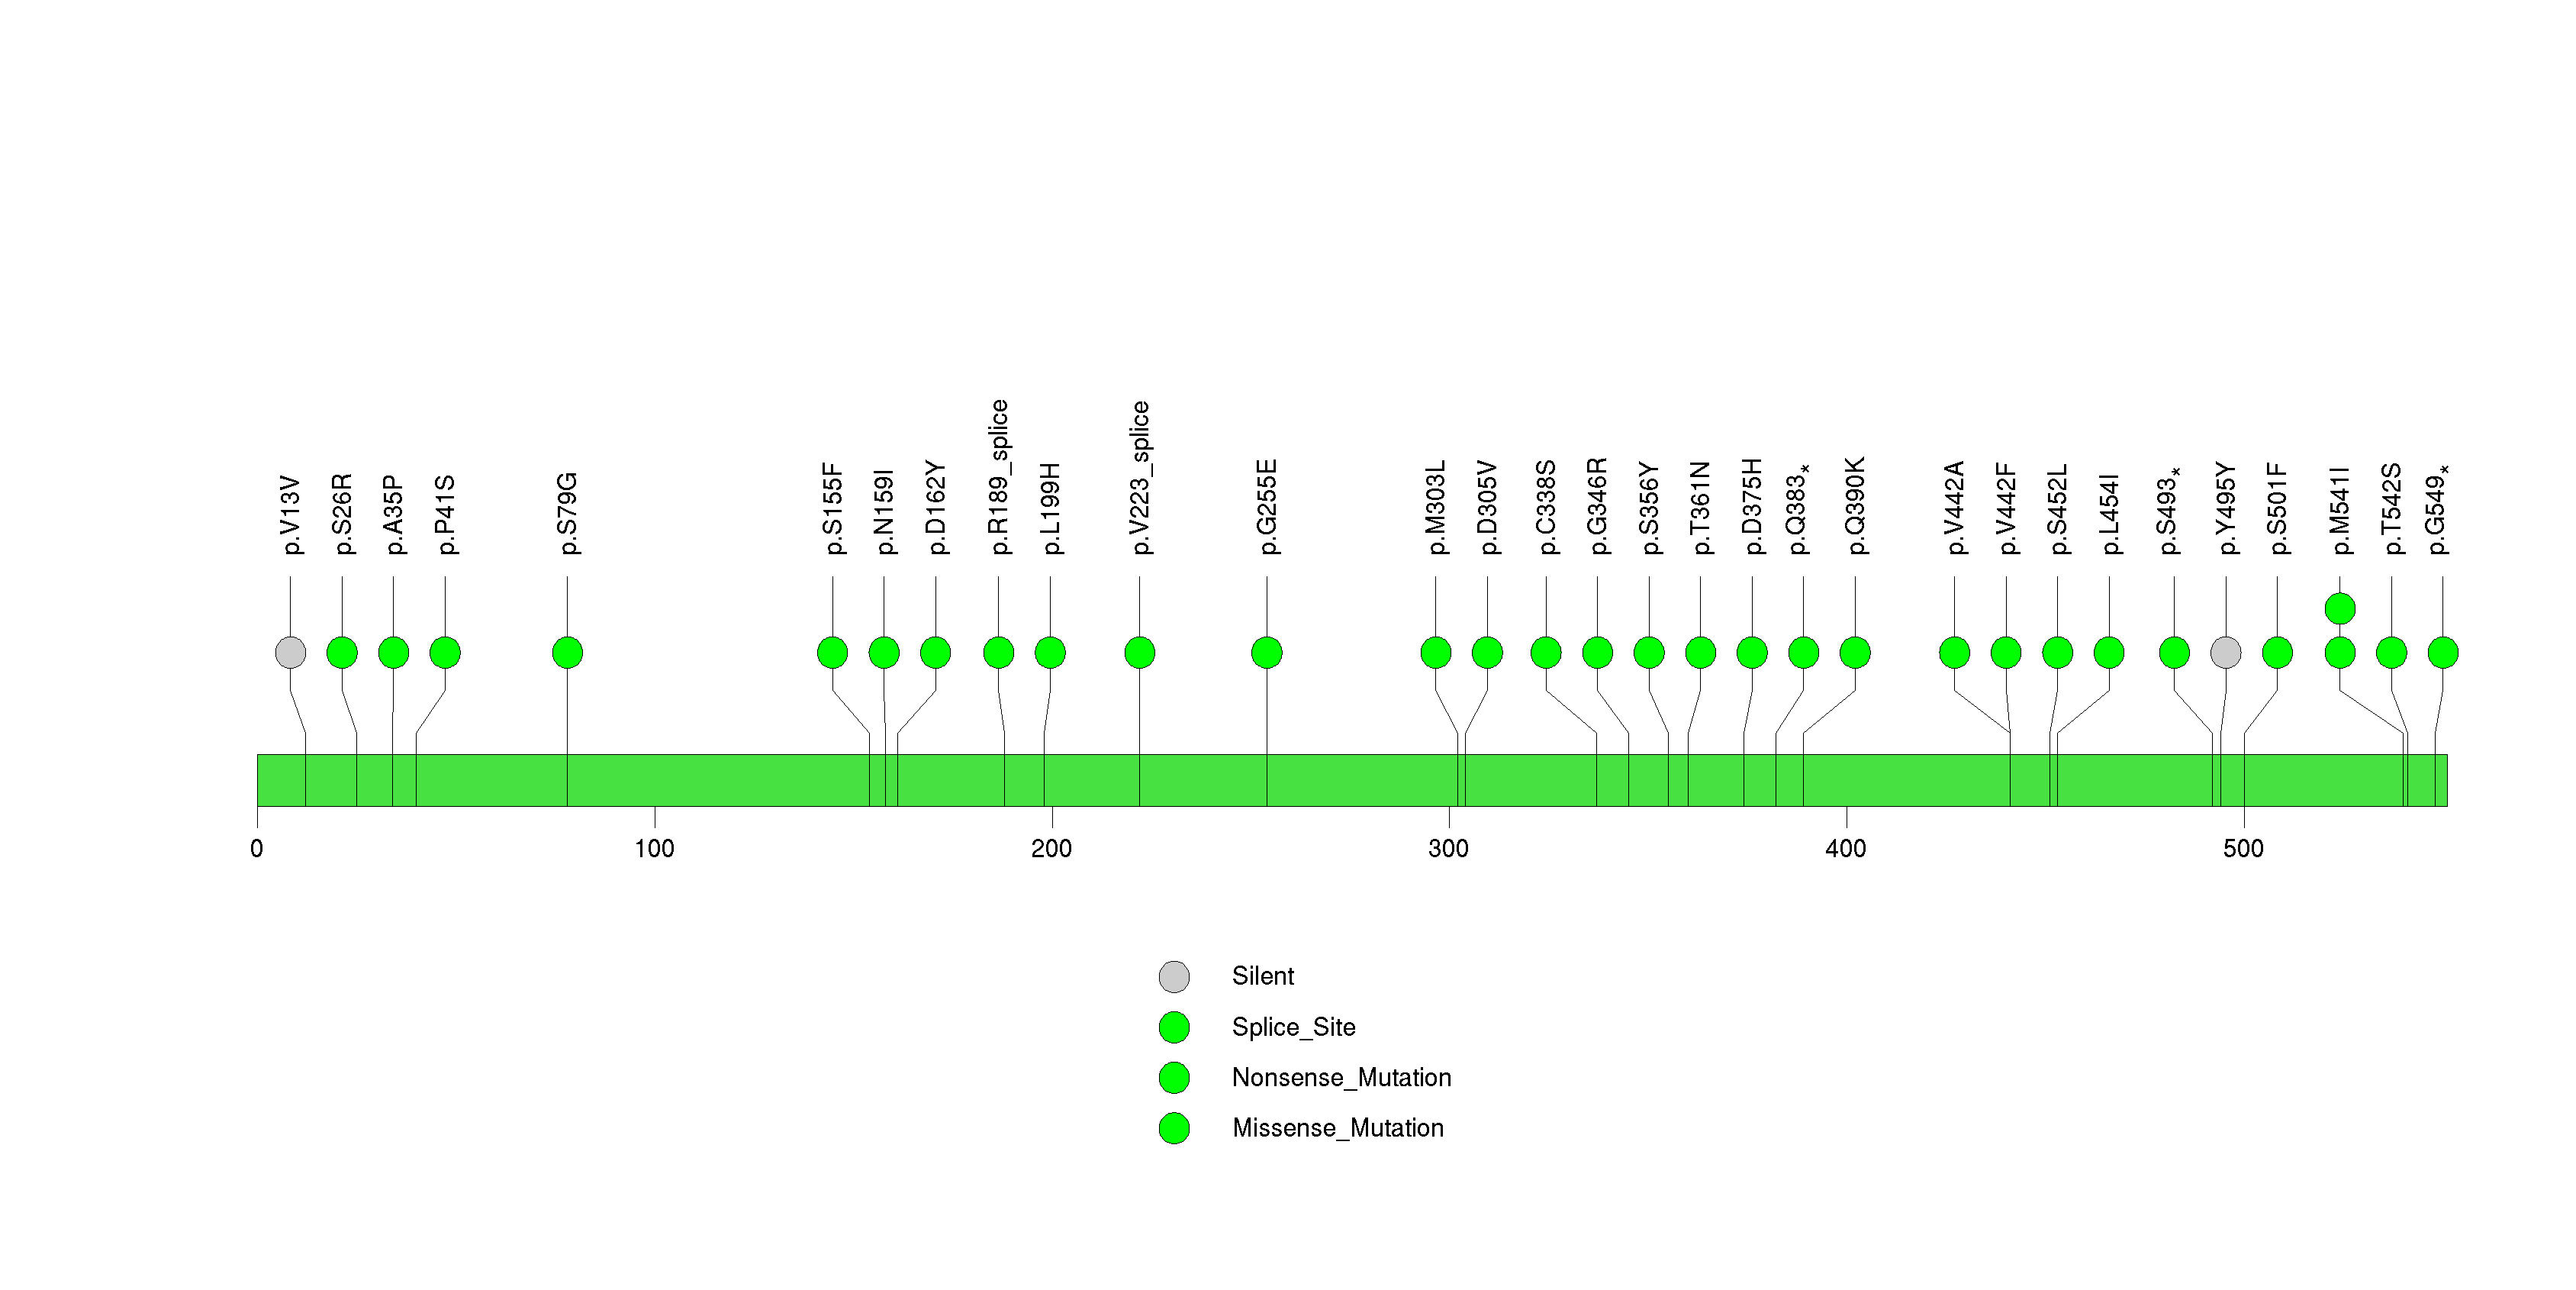
Figure S5. This figure depicts the distribution of mutations and mutation types across the KEAP1 significant gene.
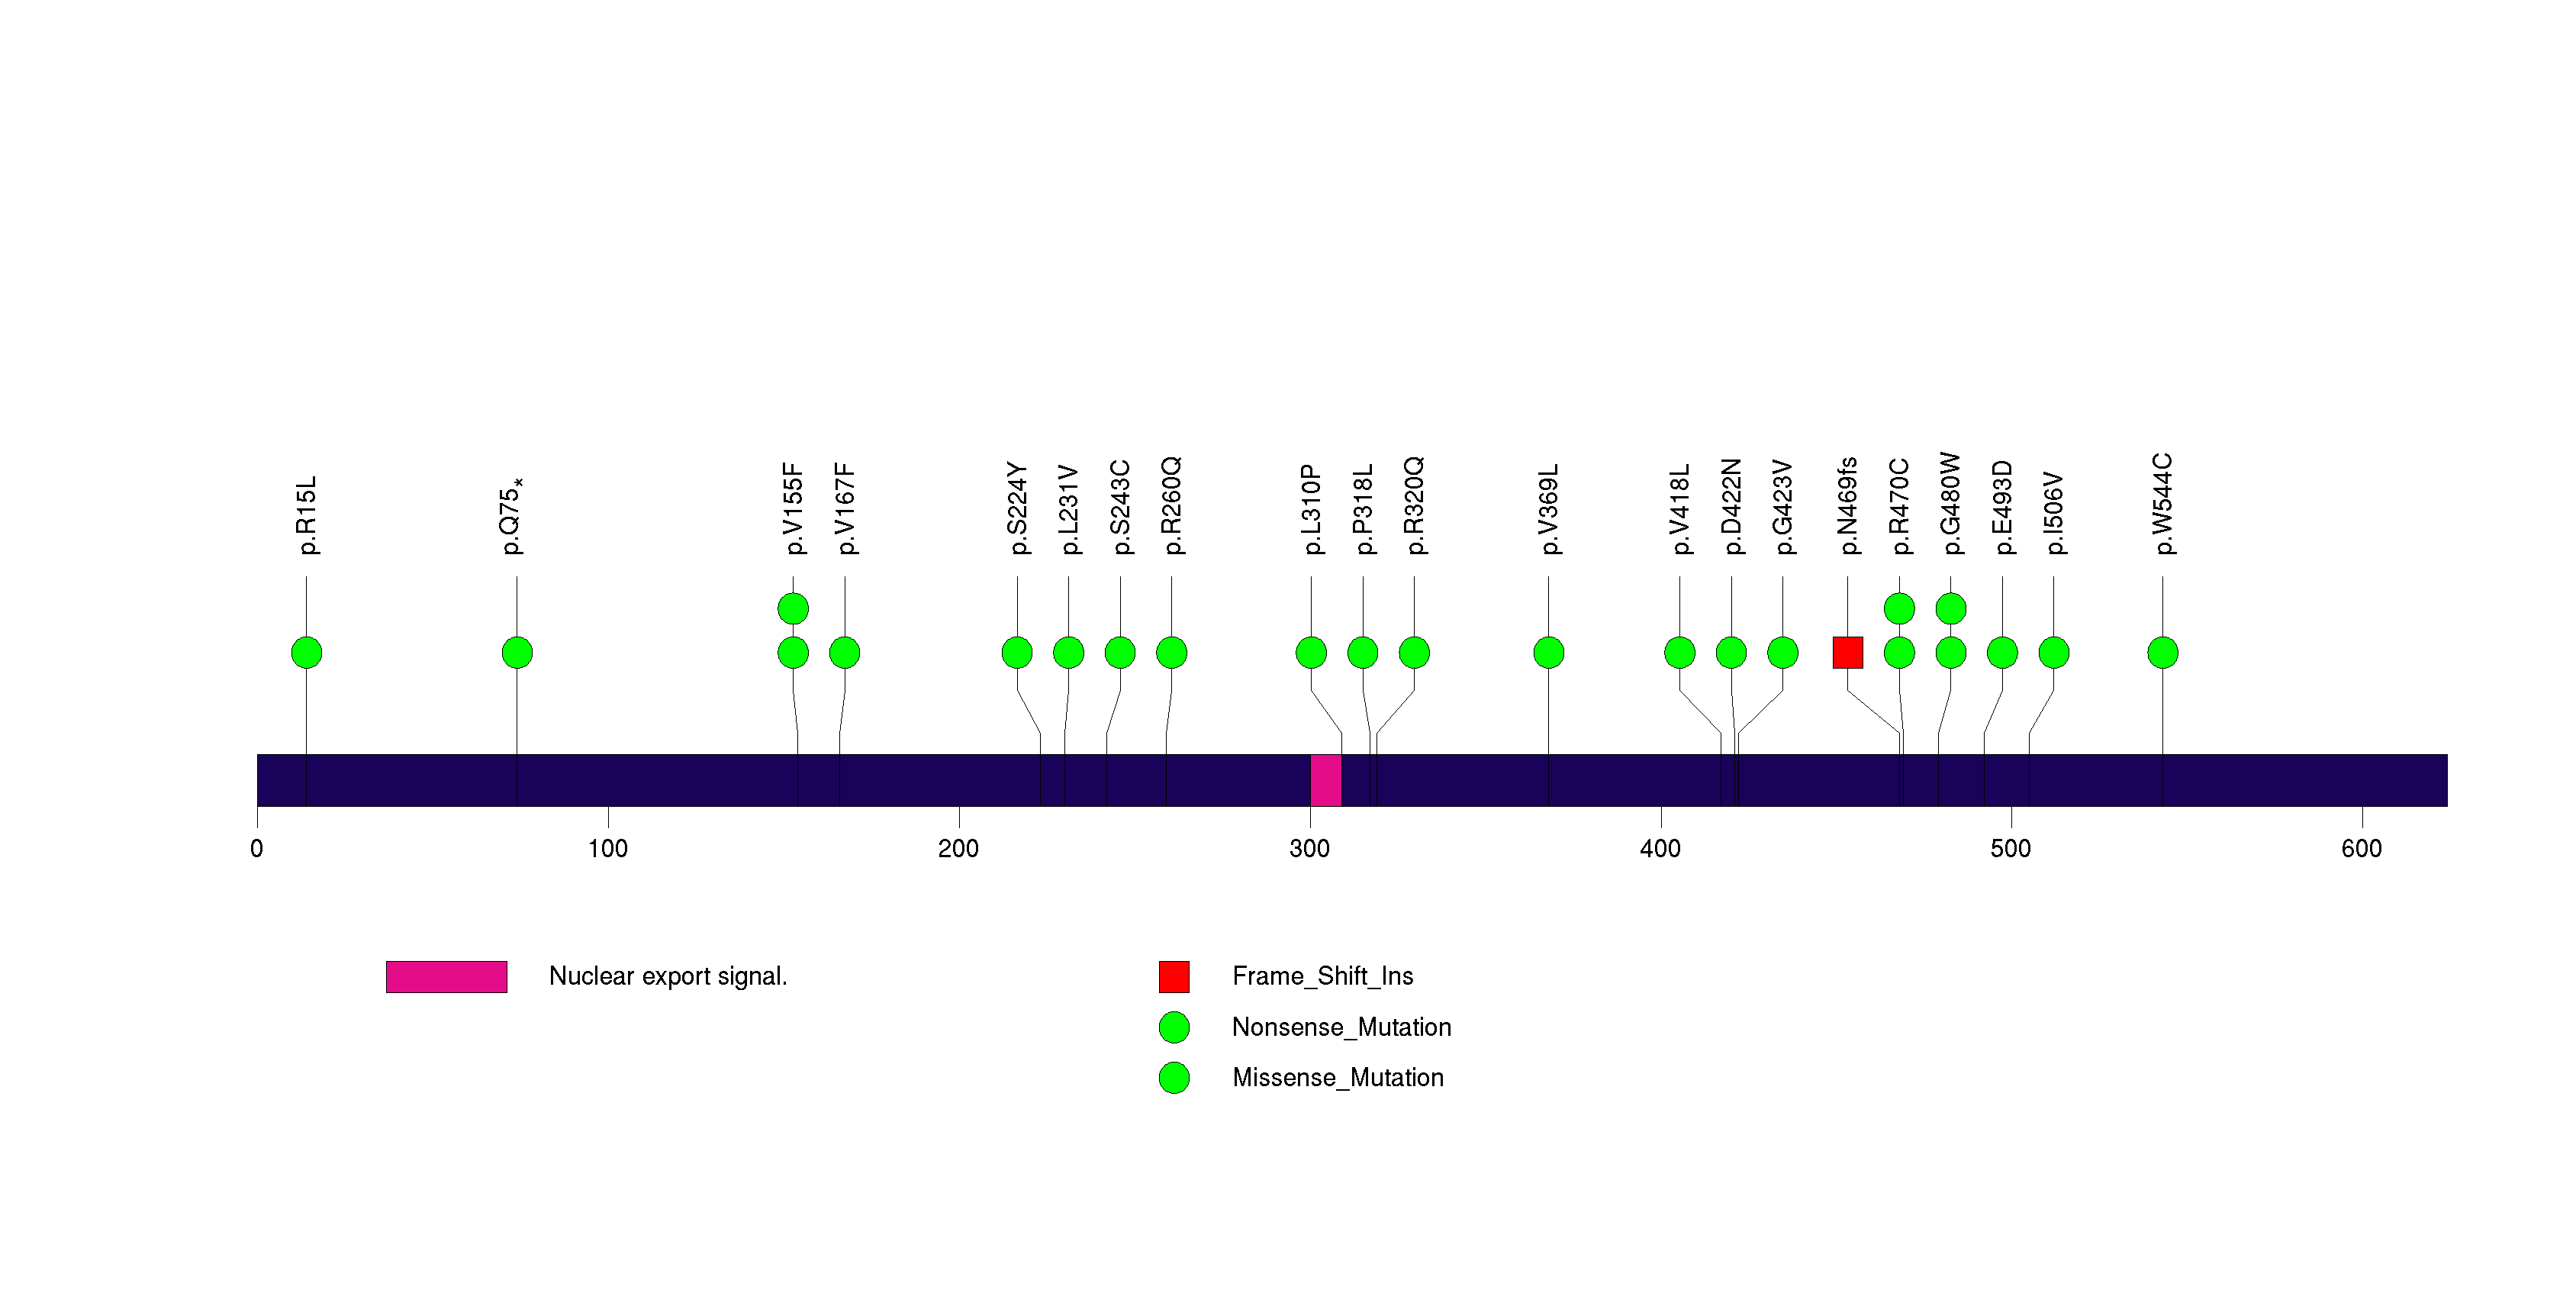
Figure S6. This figure depicts the distribution of mutations and mutation types across the PIK3CA significant gene.
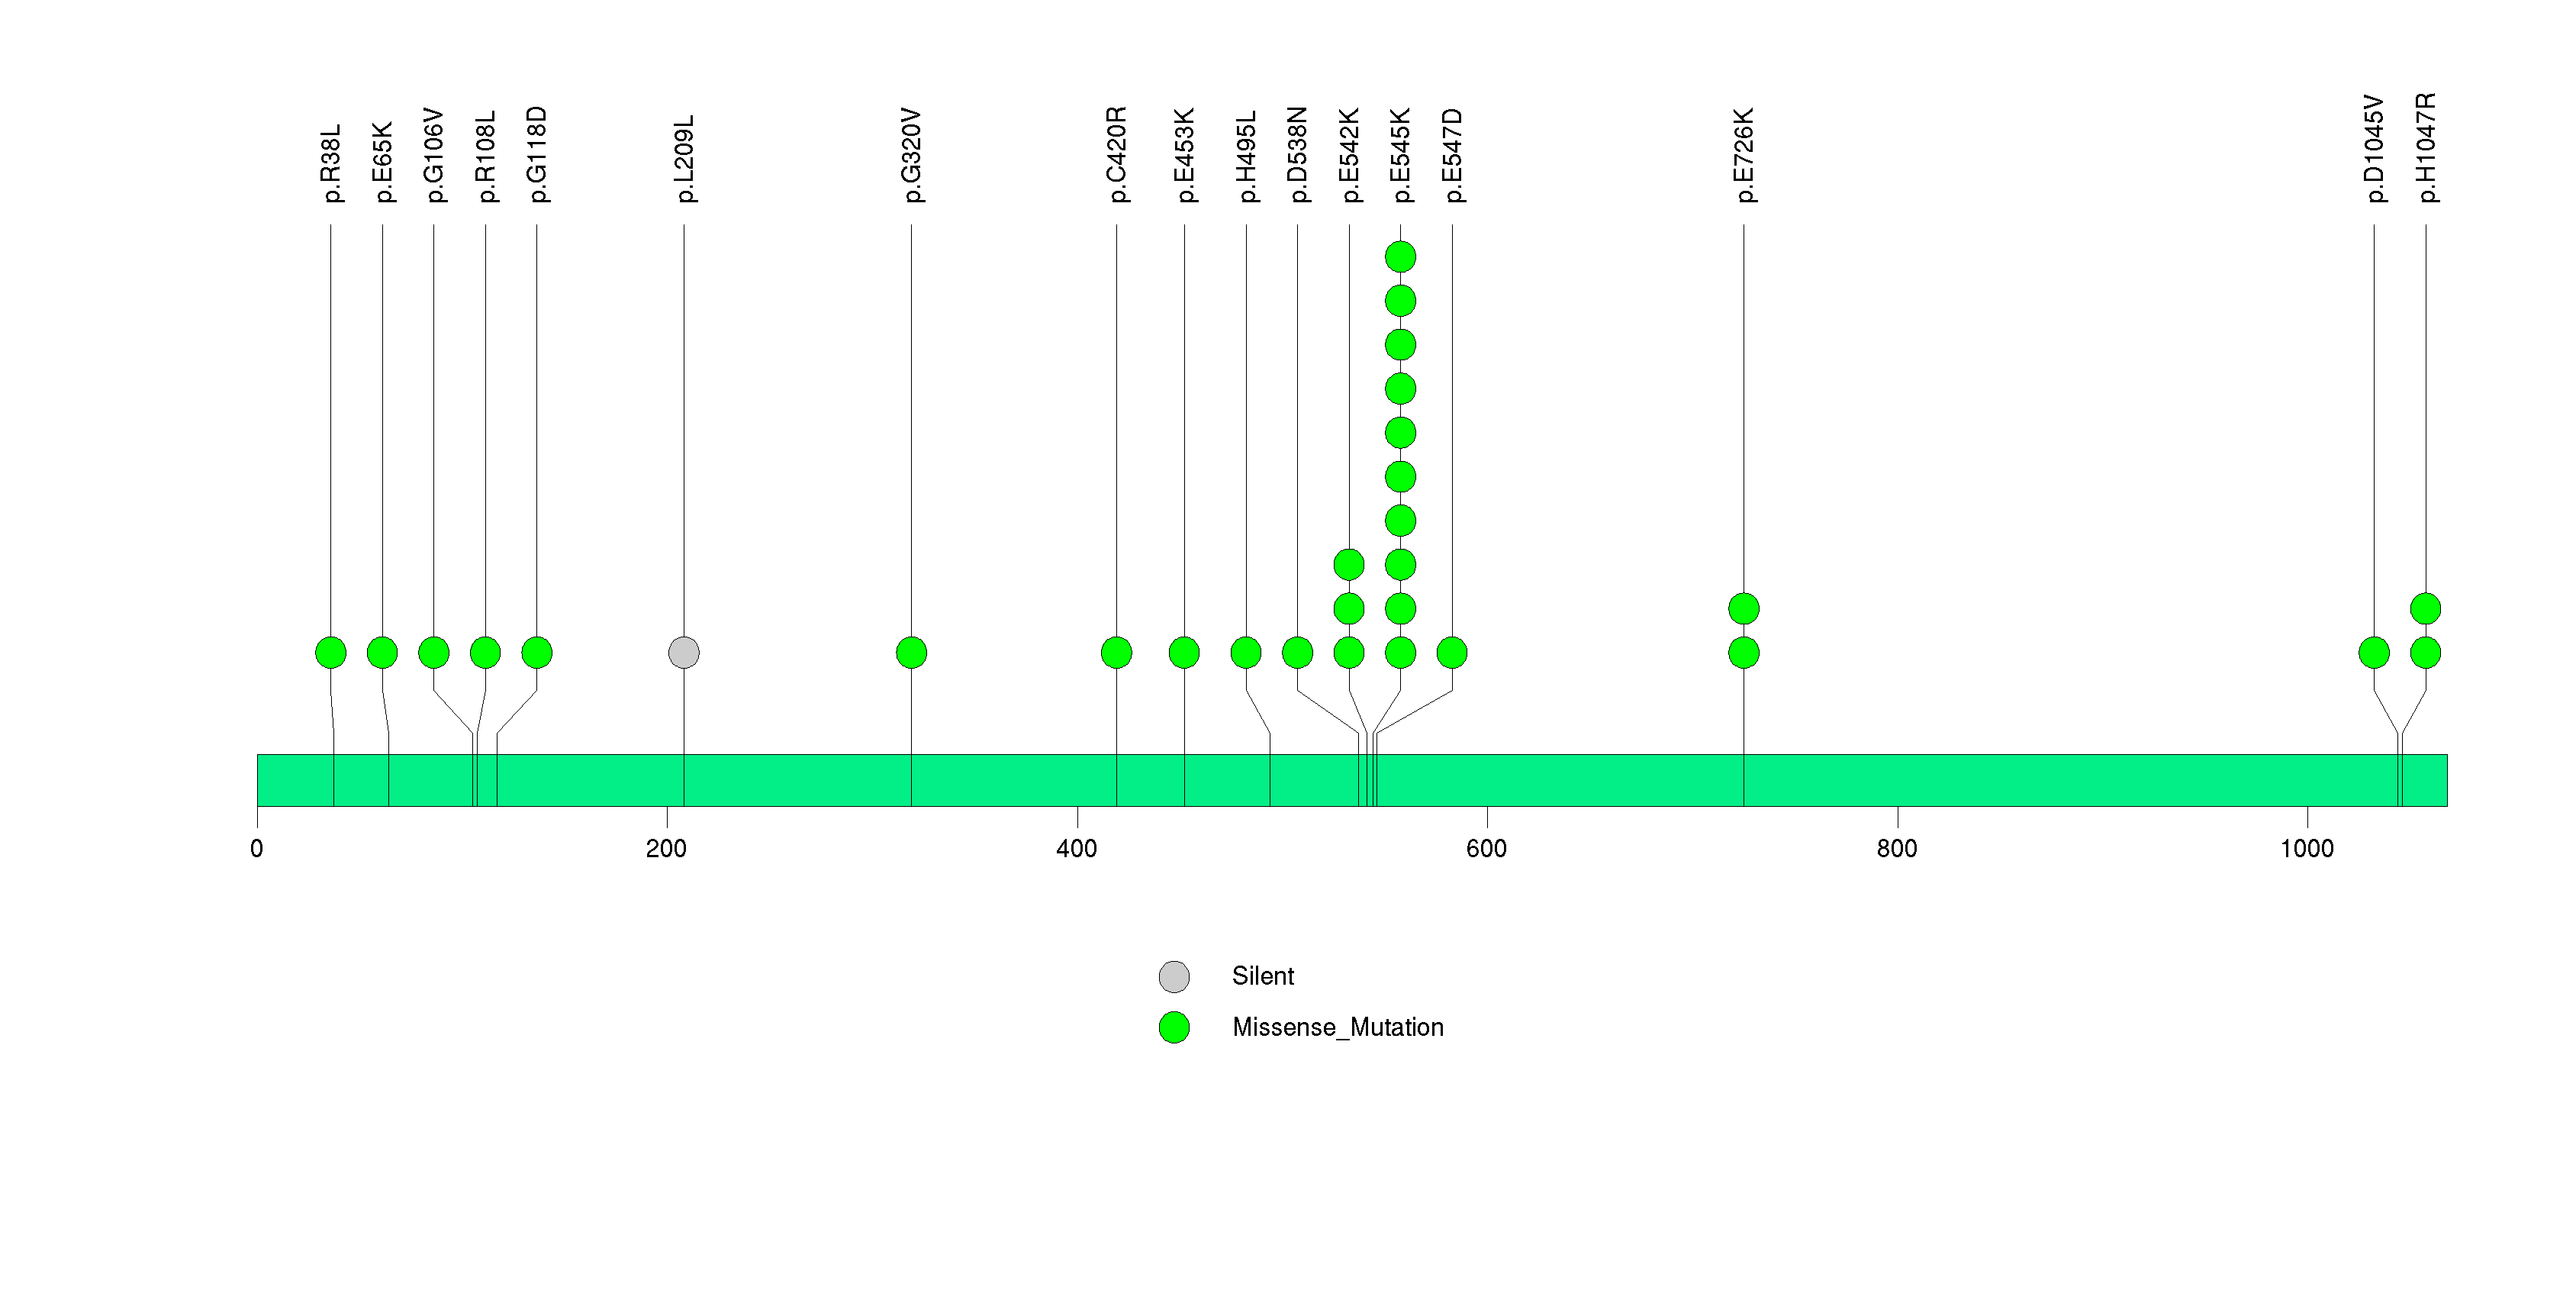
Figure S7. This figure depicts the distribution of mutations and mutation types across the SI significant gene.
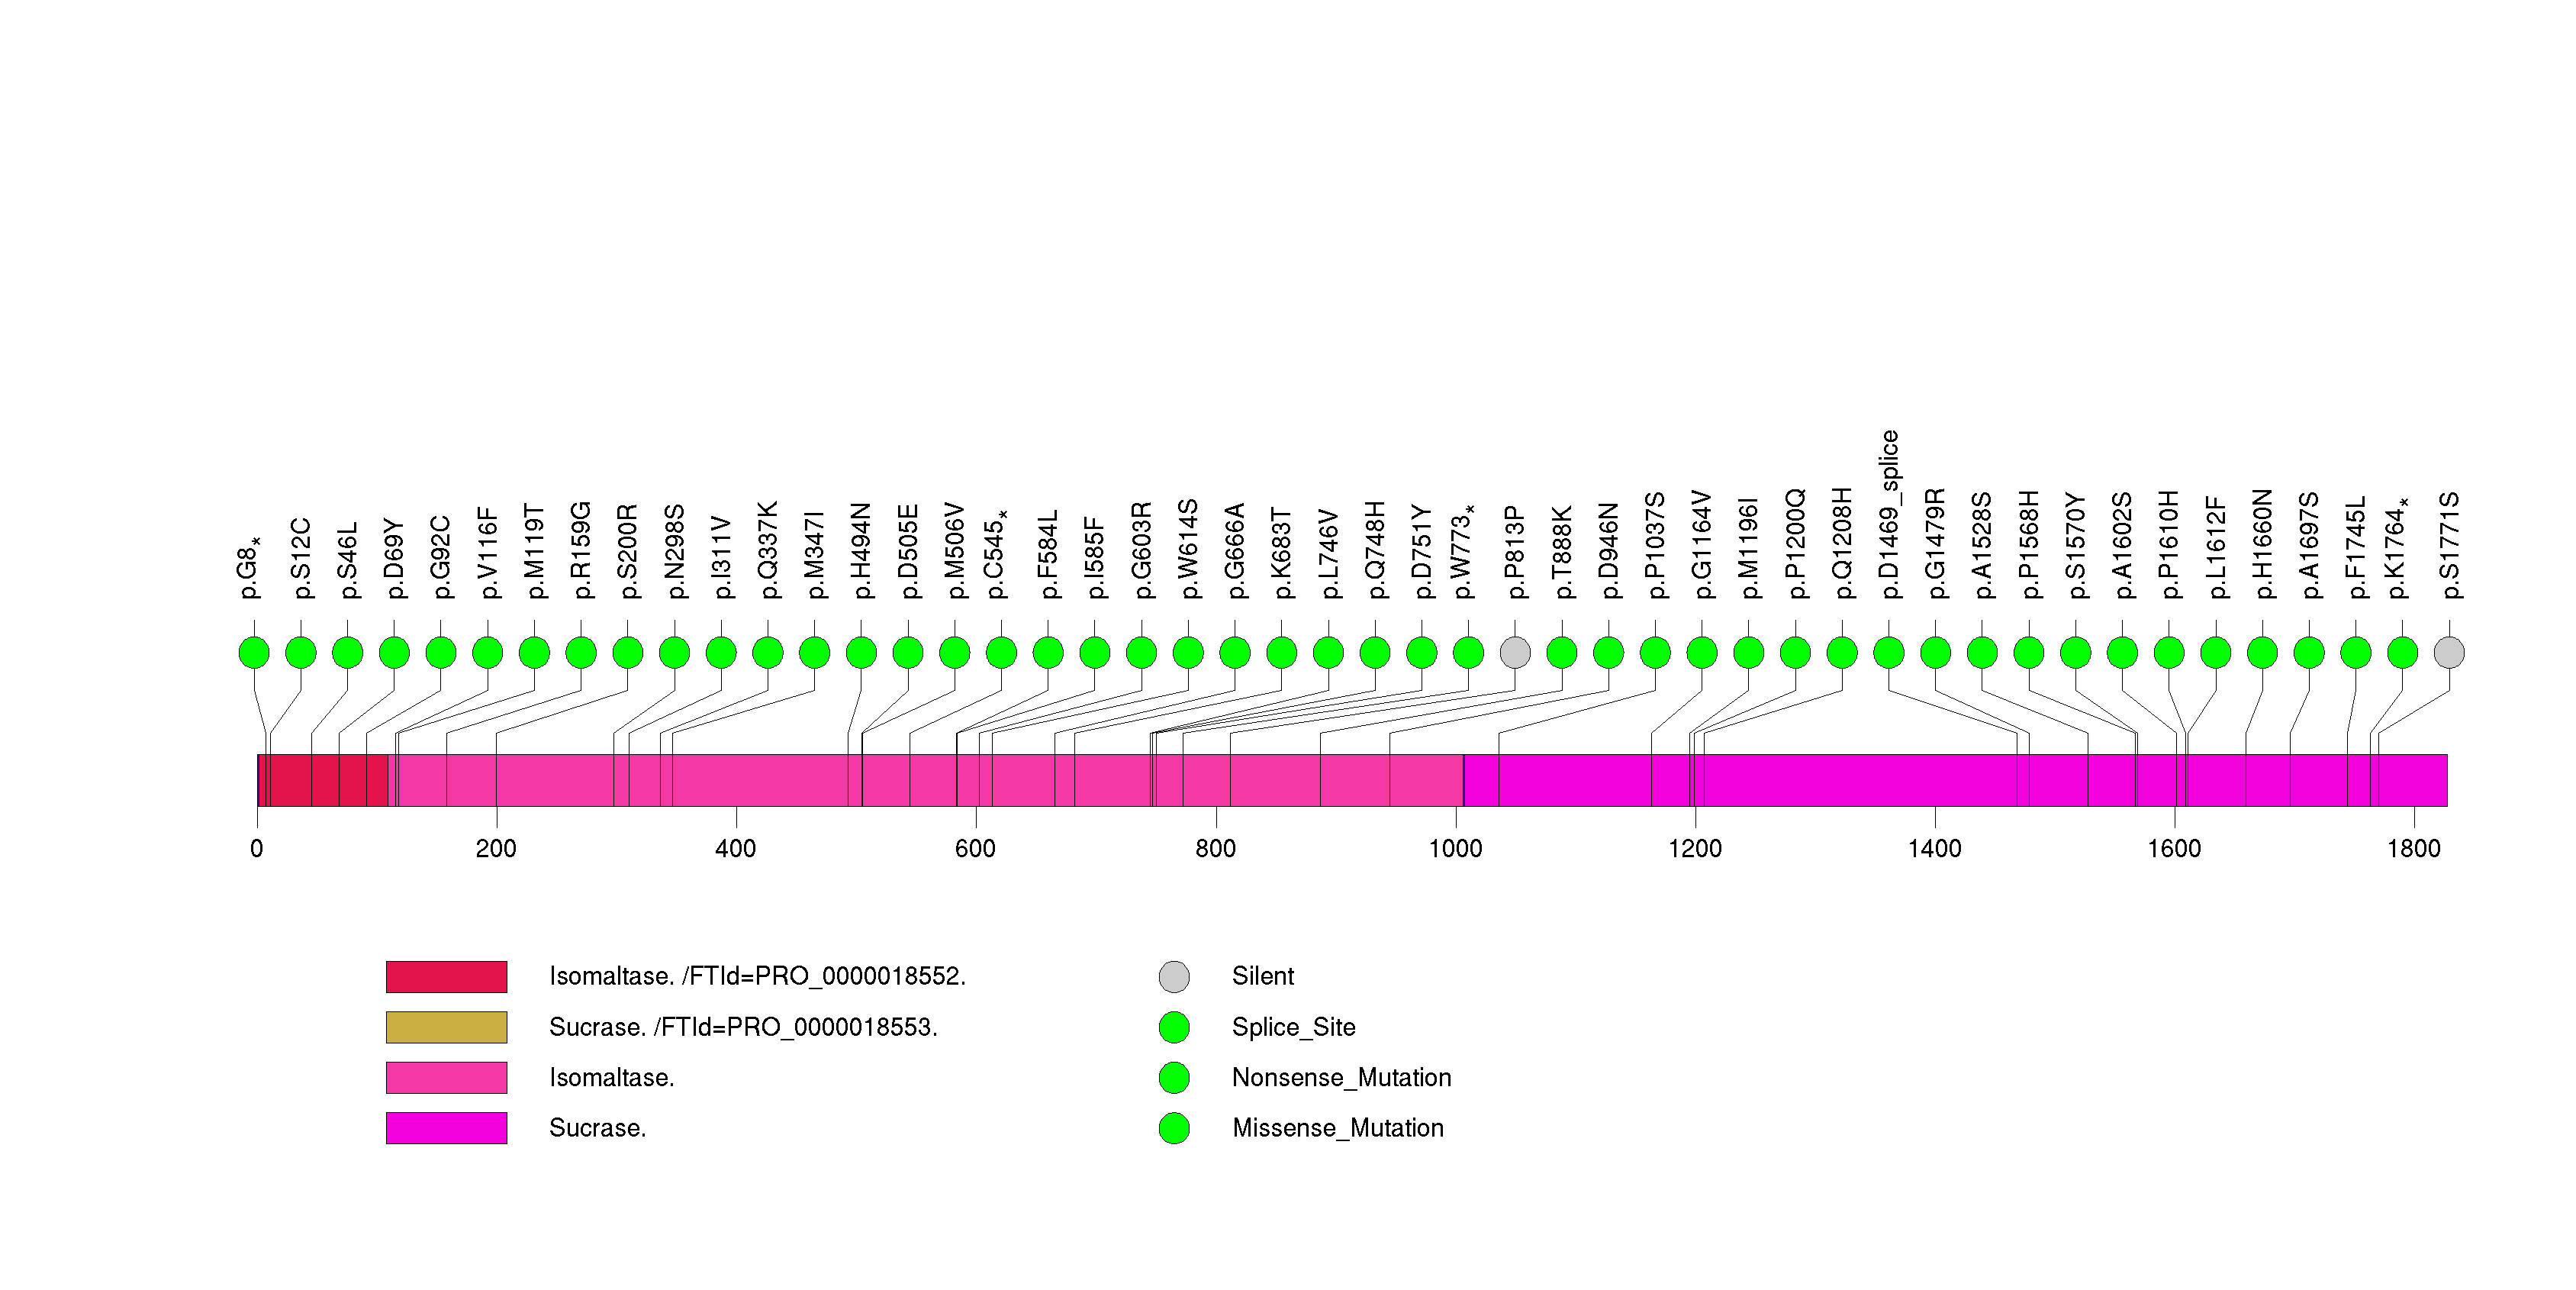
Figure S8. This figure depicts the distribution of mutations and mutation types across the PTEN significant gene.
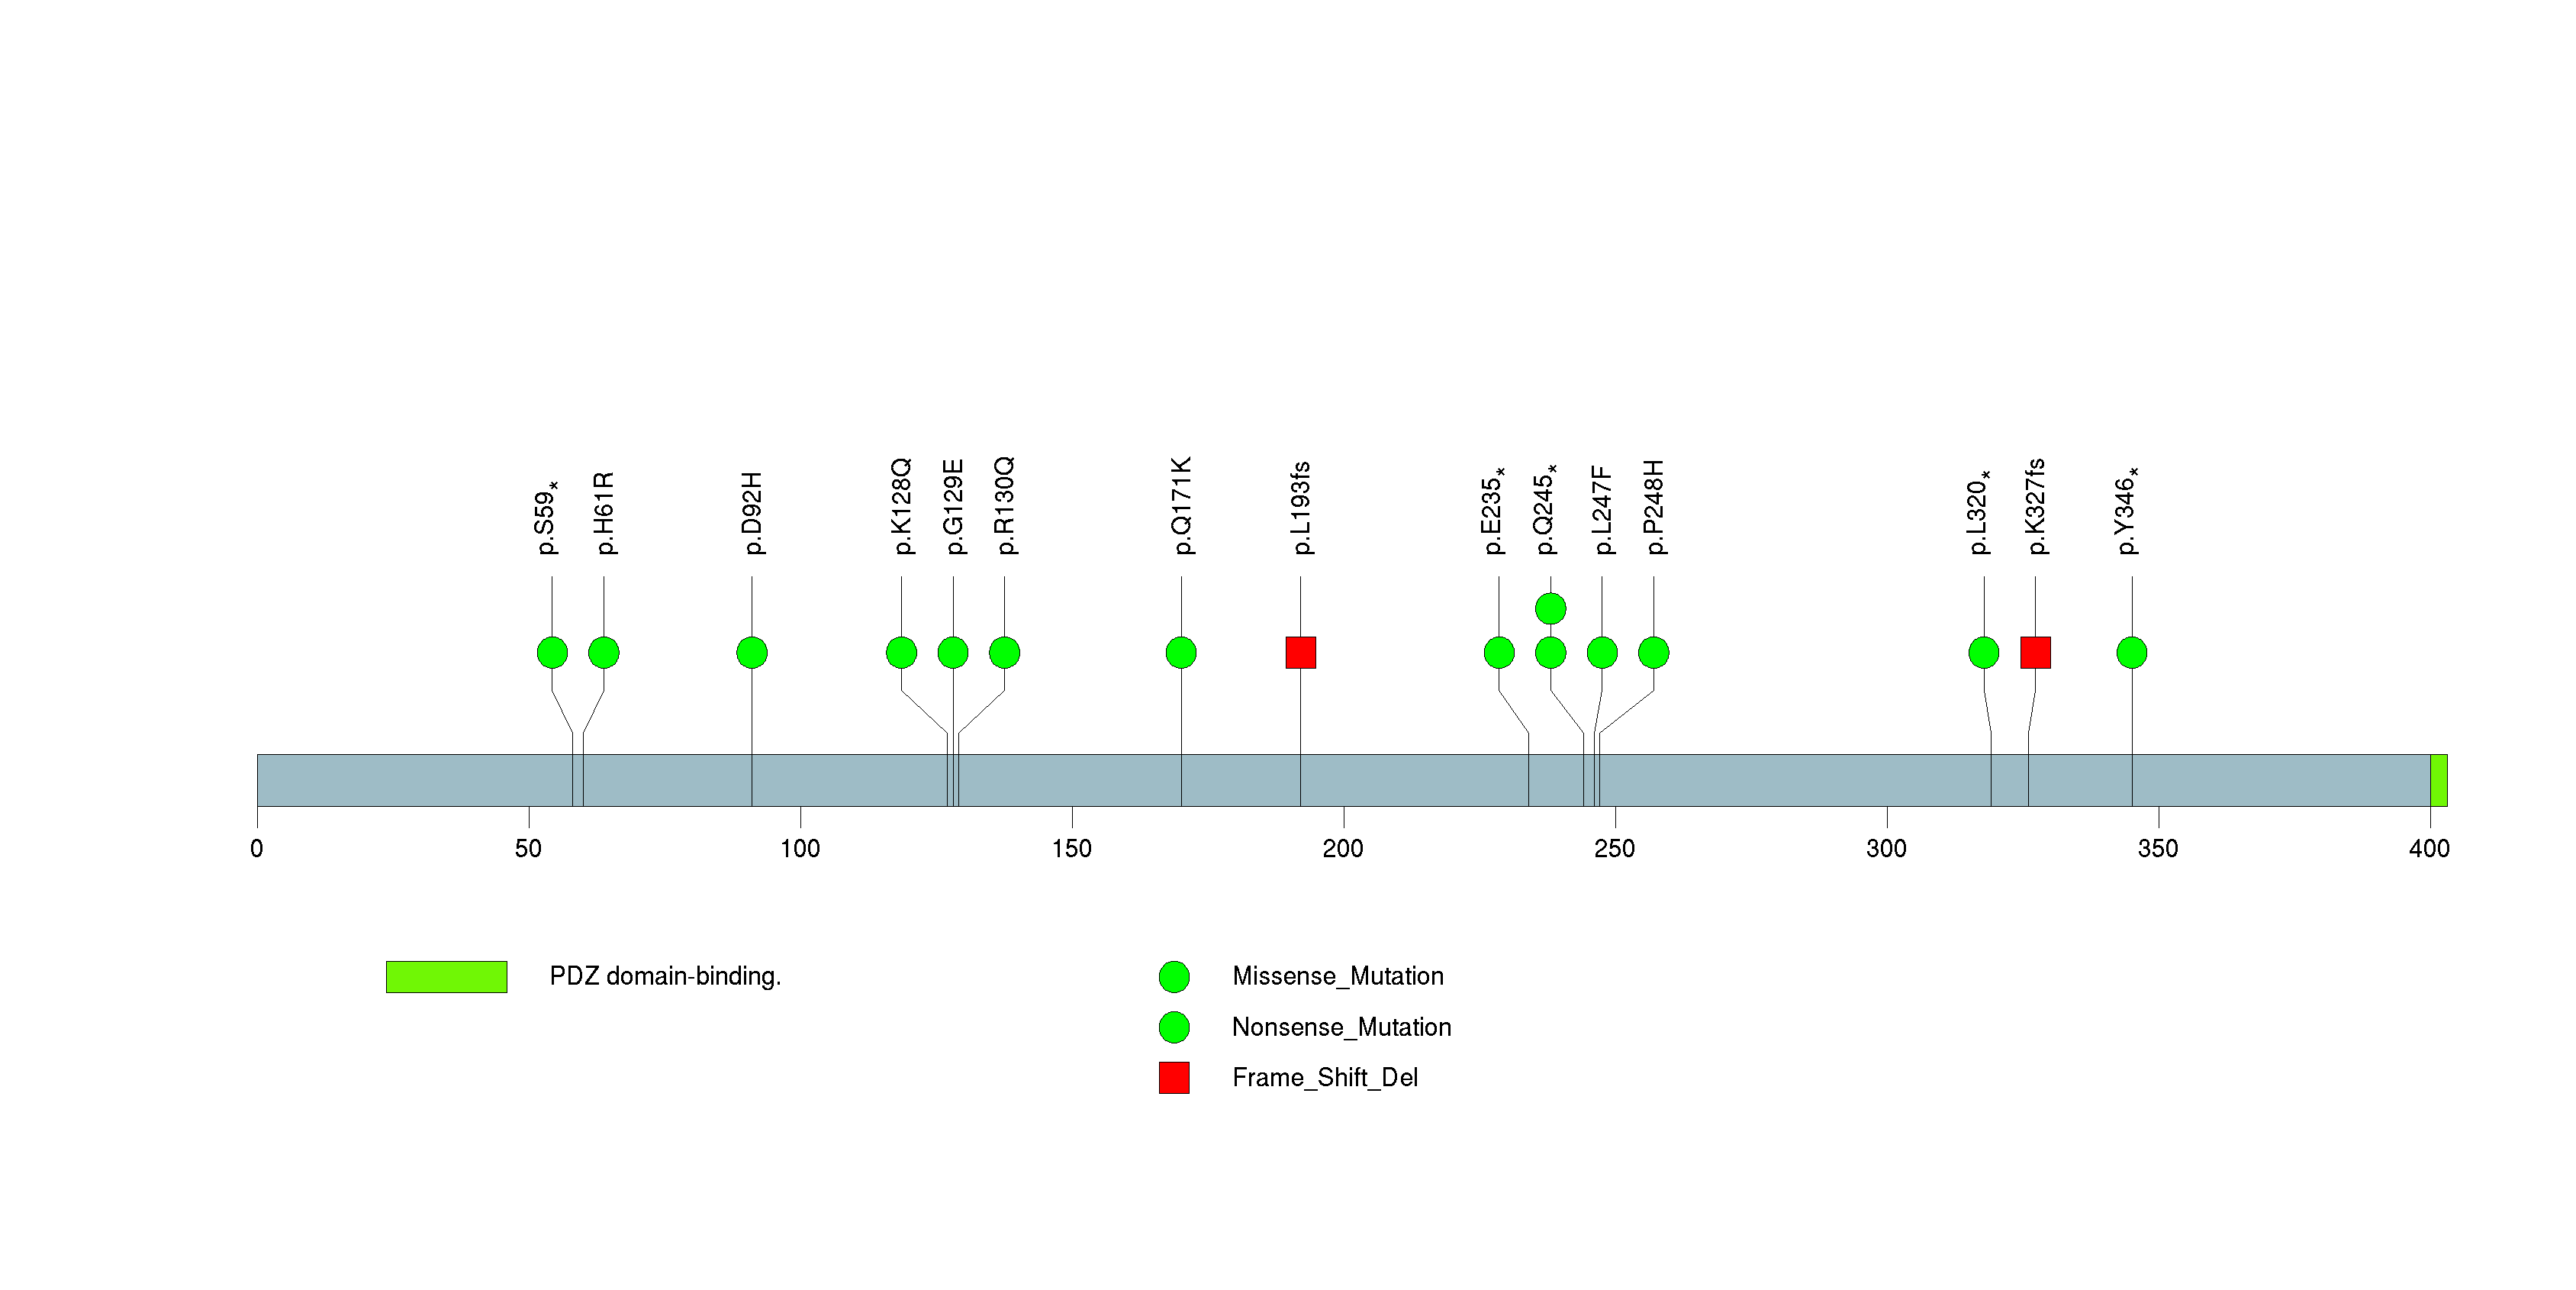
Figure S9. This figure depicts the distribution of mutations and mutation types across the OR5L2 significant gene.
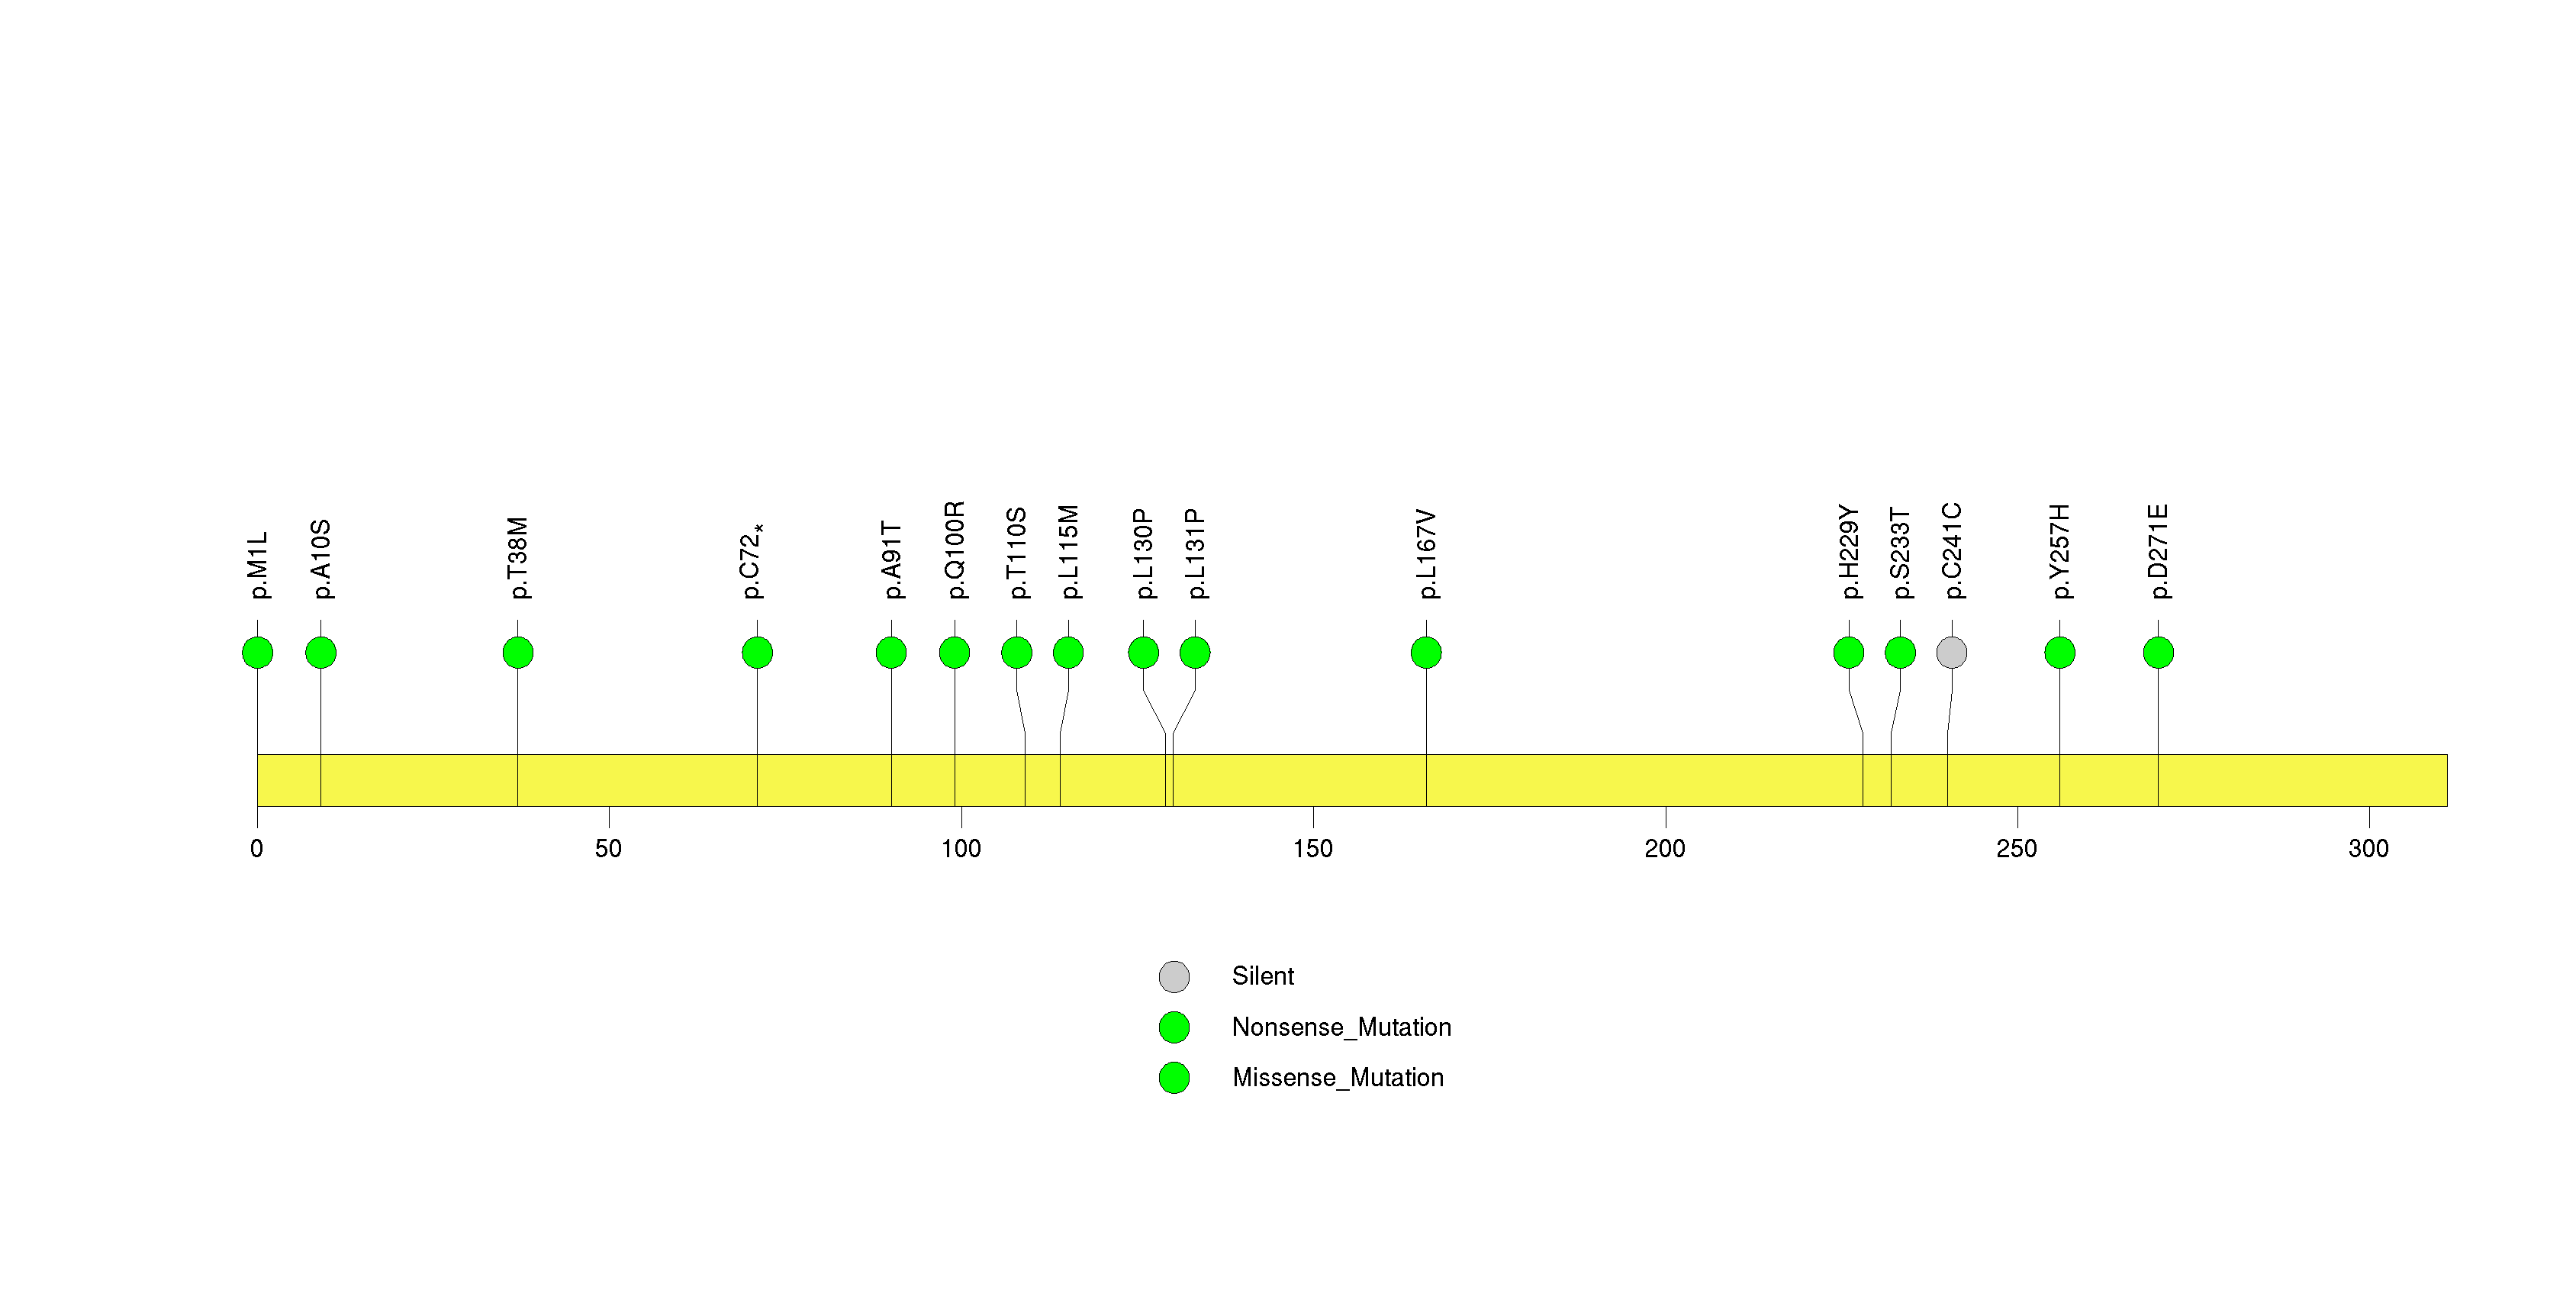
Figure S10. This figure depicts the distribution of mutations and mutation types across the TRIM58 significant gene.
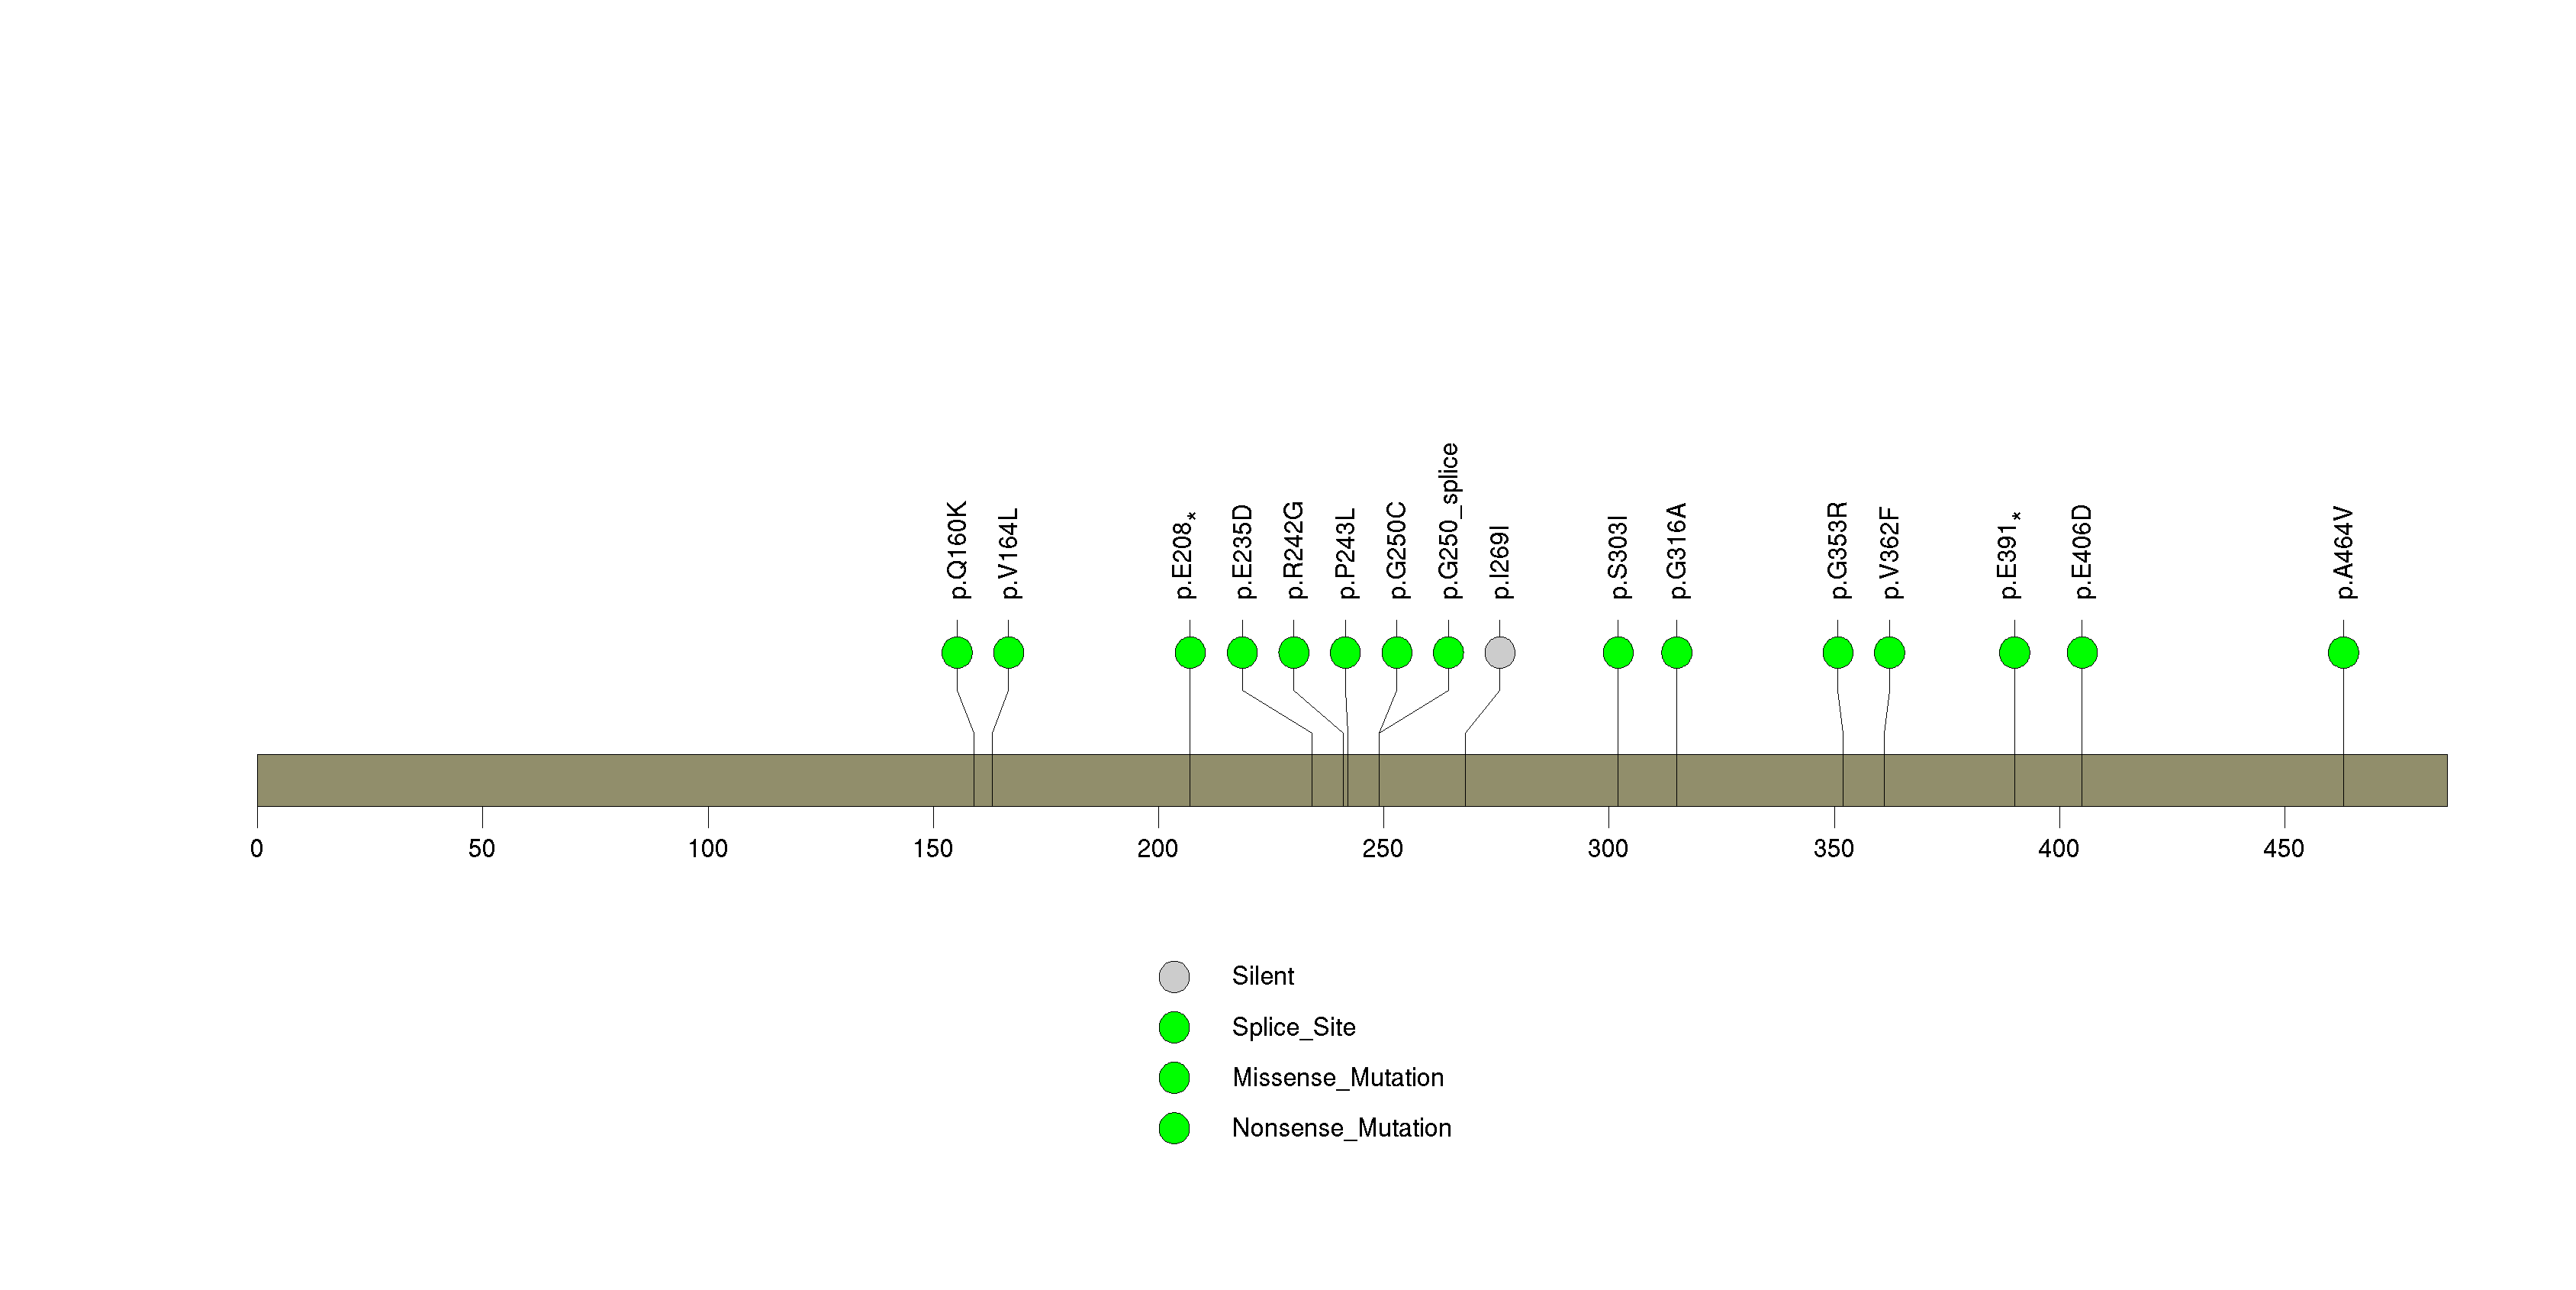
Figure S11. This figure depicts the distribution of mutations and mutation types across the FAM5C significant gene.
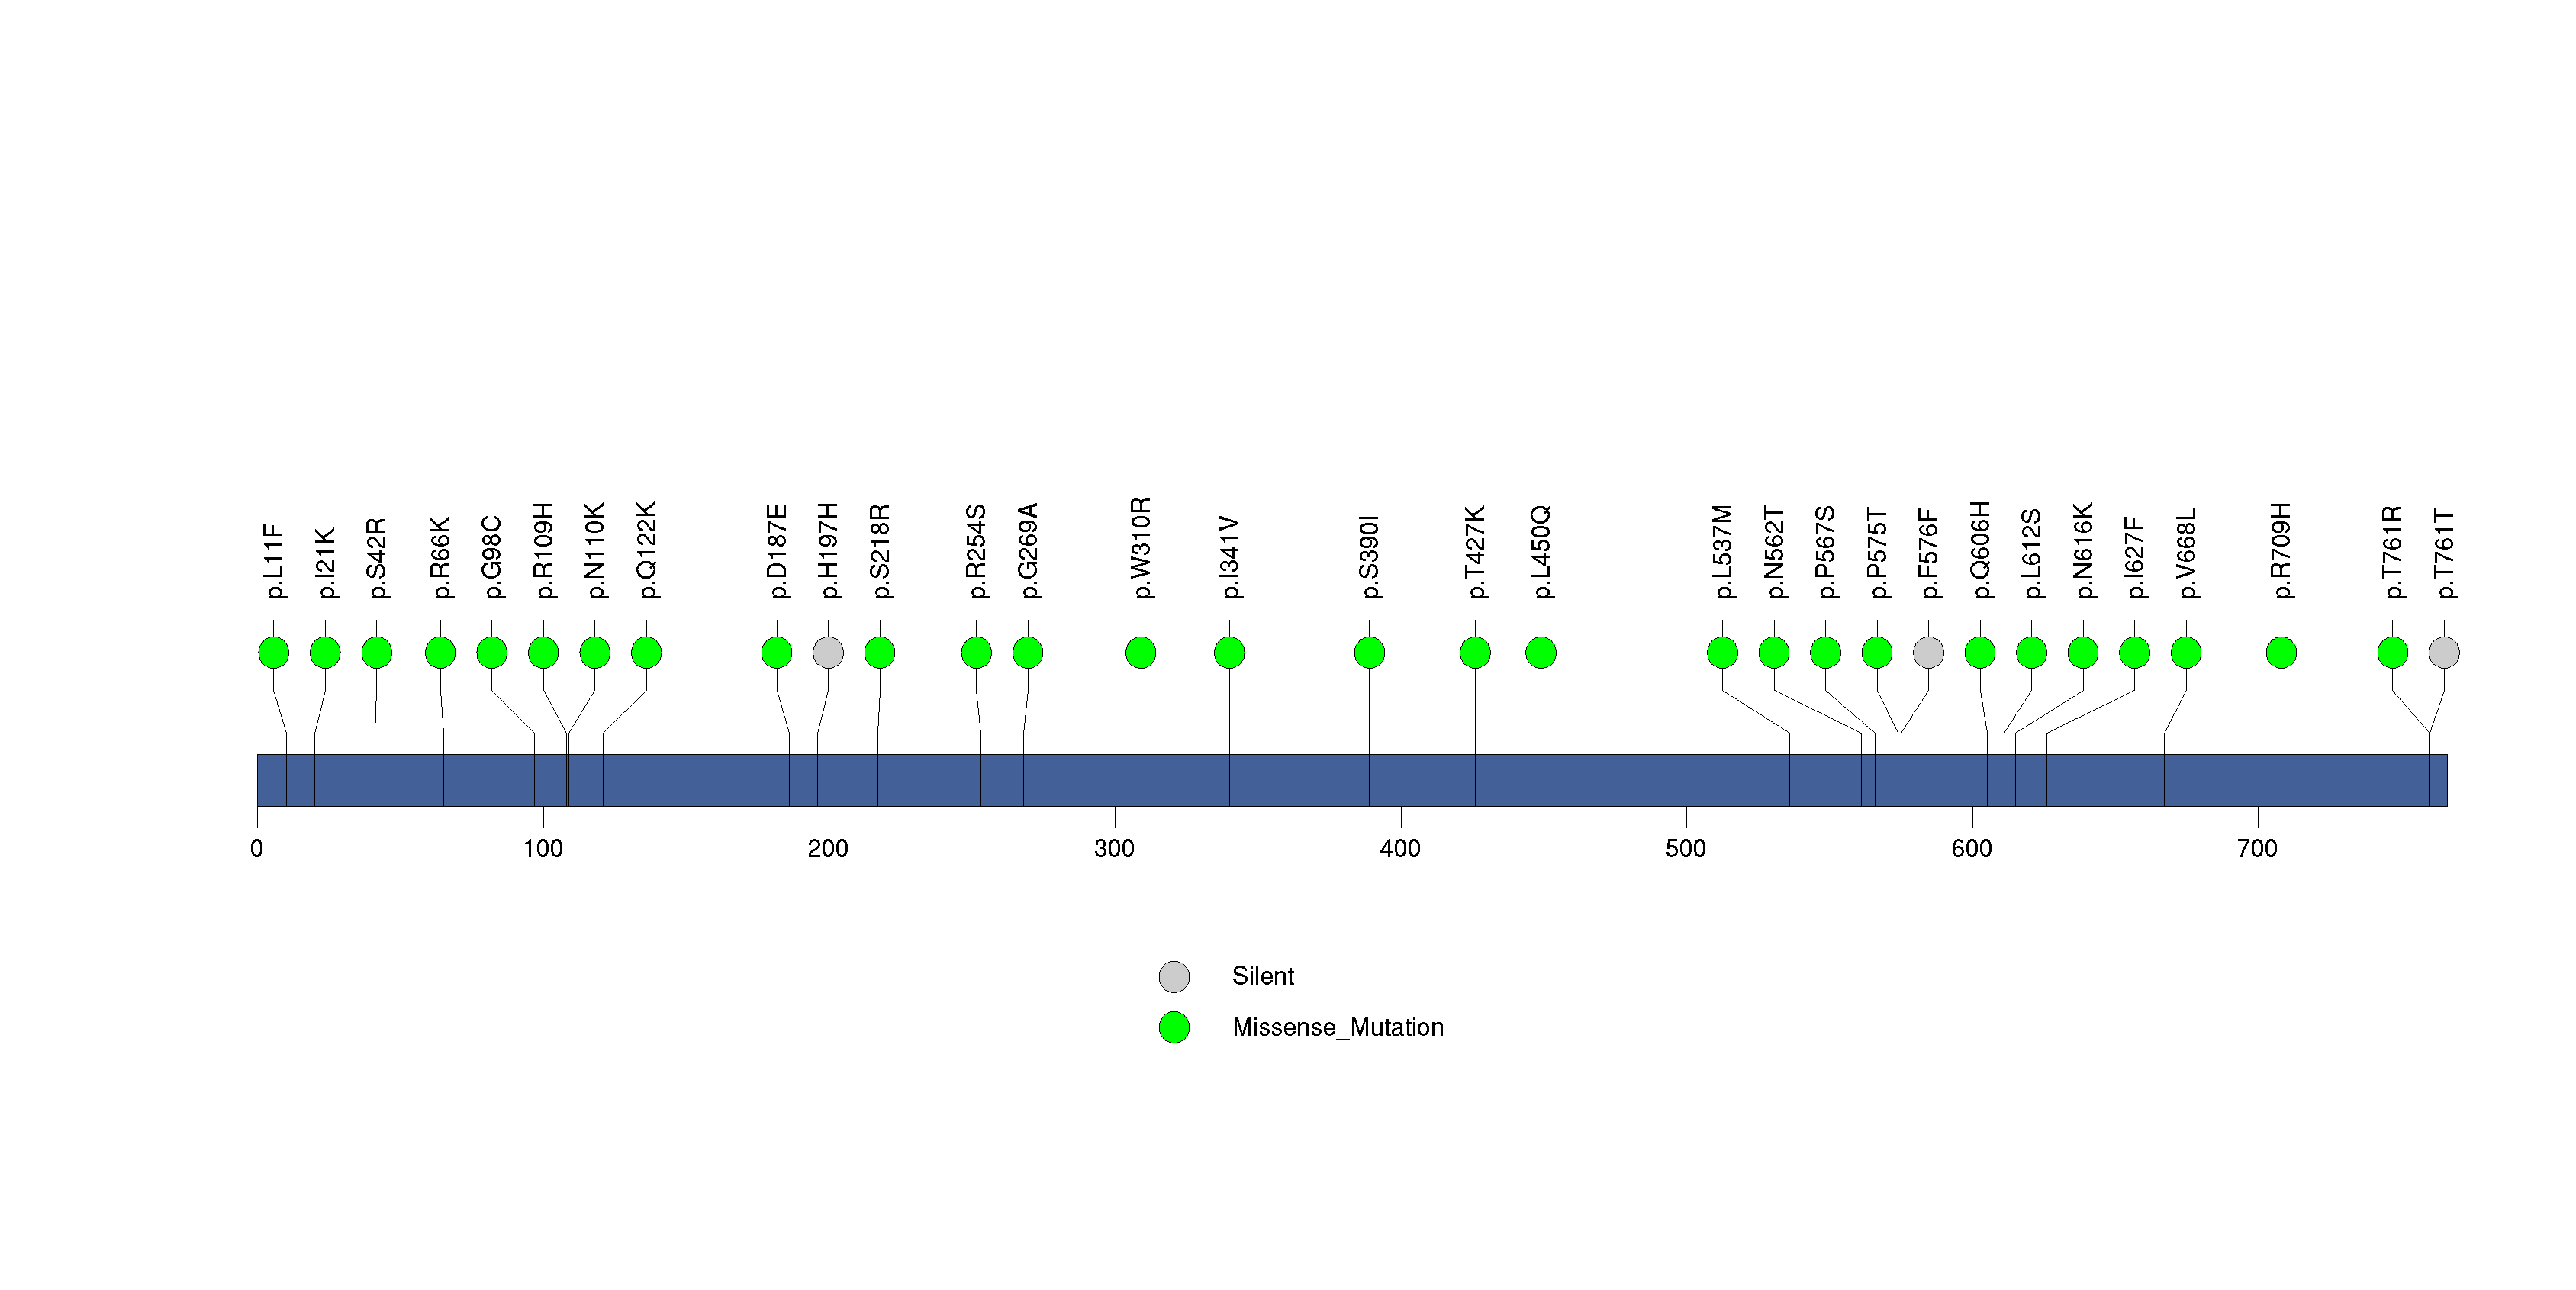
Figure S12. This figure depicts the distribution of mutations and mutation types across the DPPA4 significant gene.
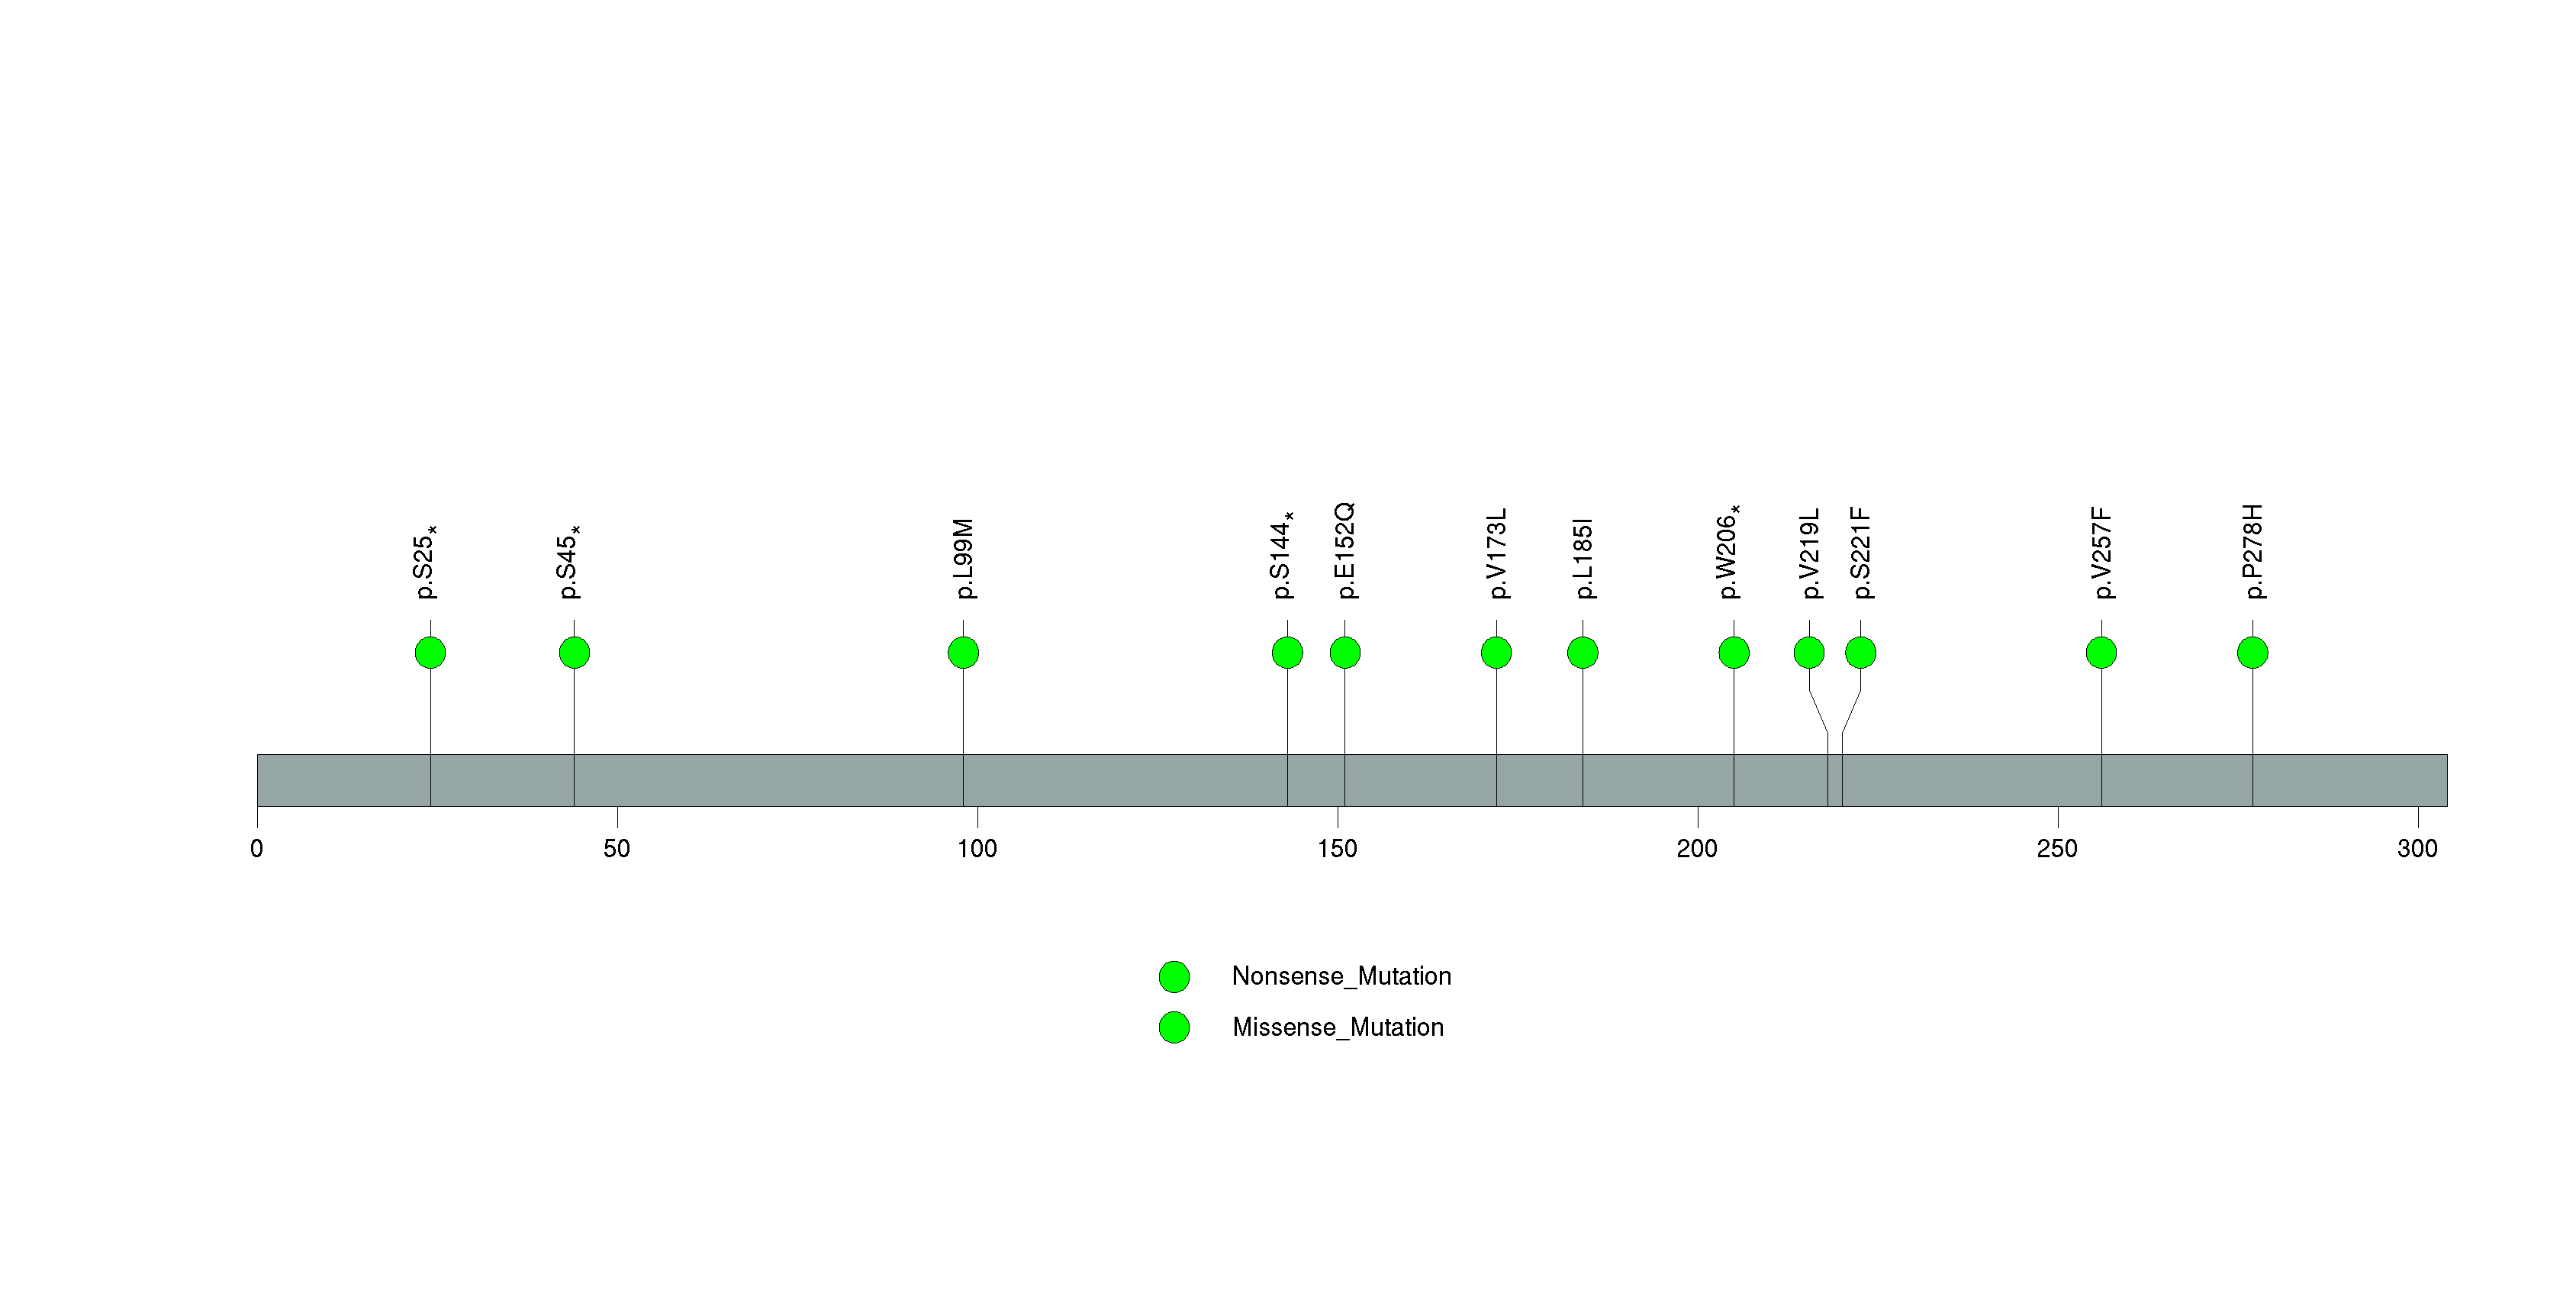
Figure S13. This figure depicts the distribution of mutations and mutation types across the LRRC4C significant gene.
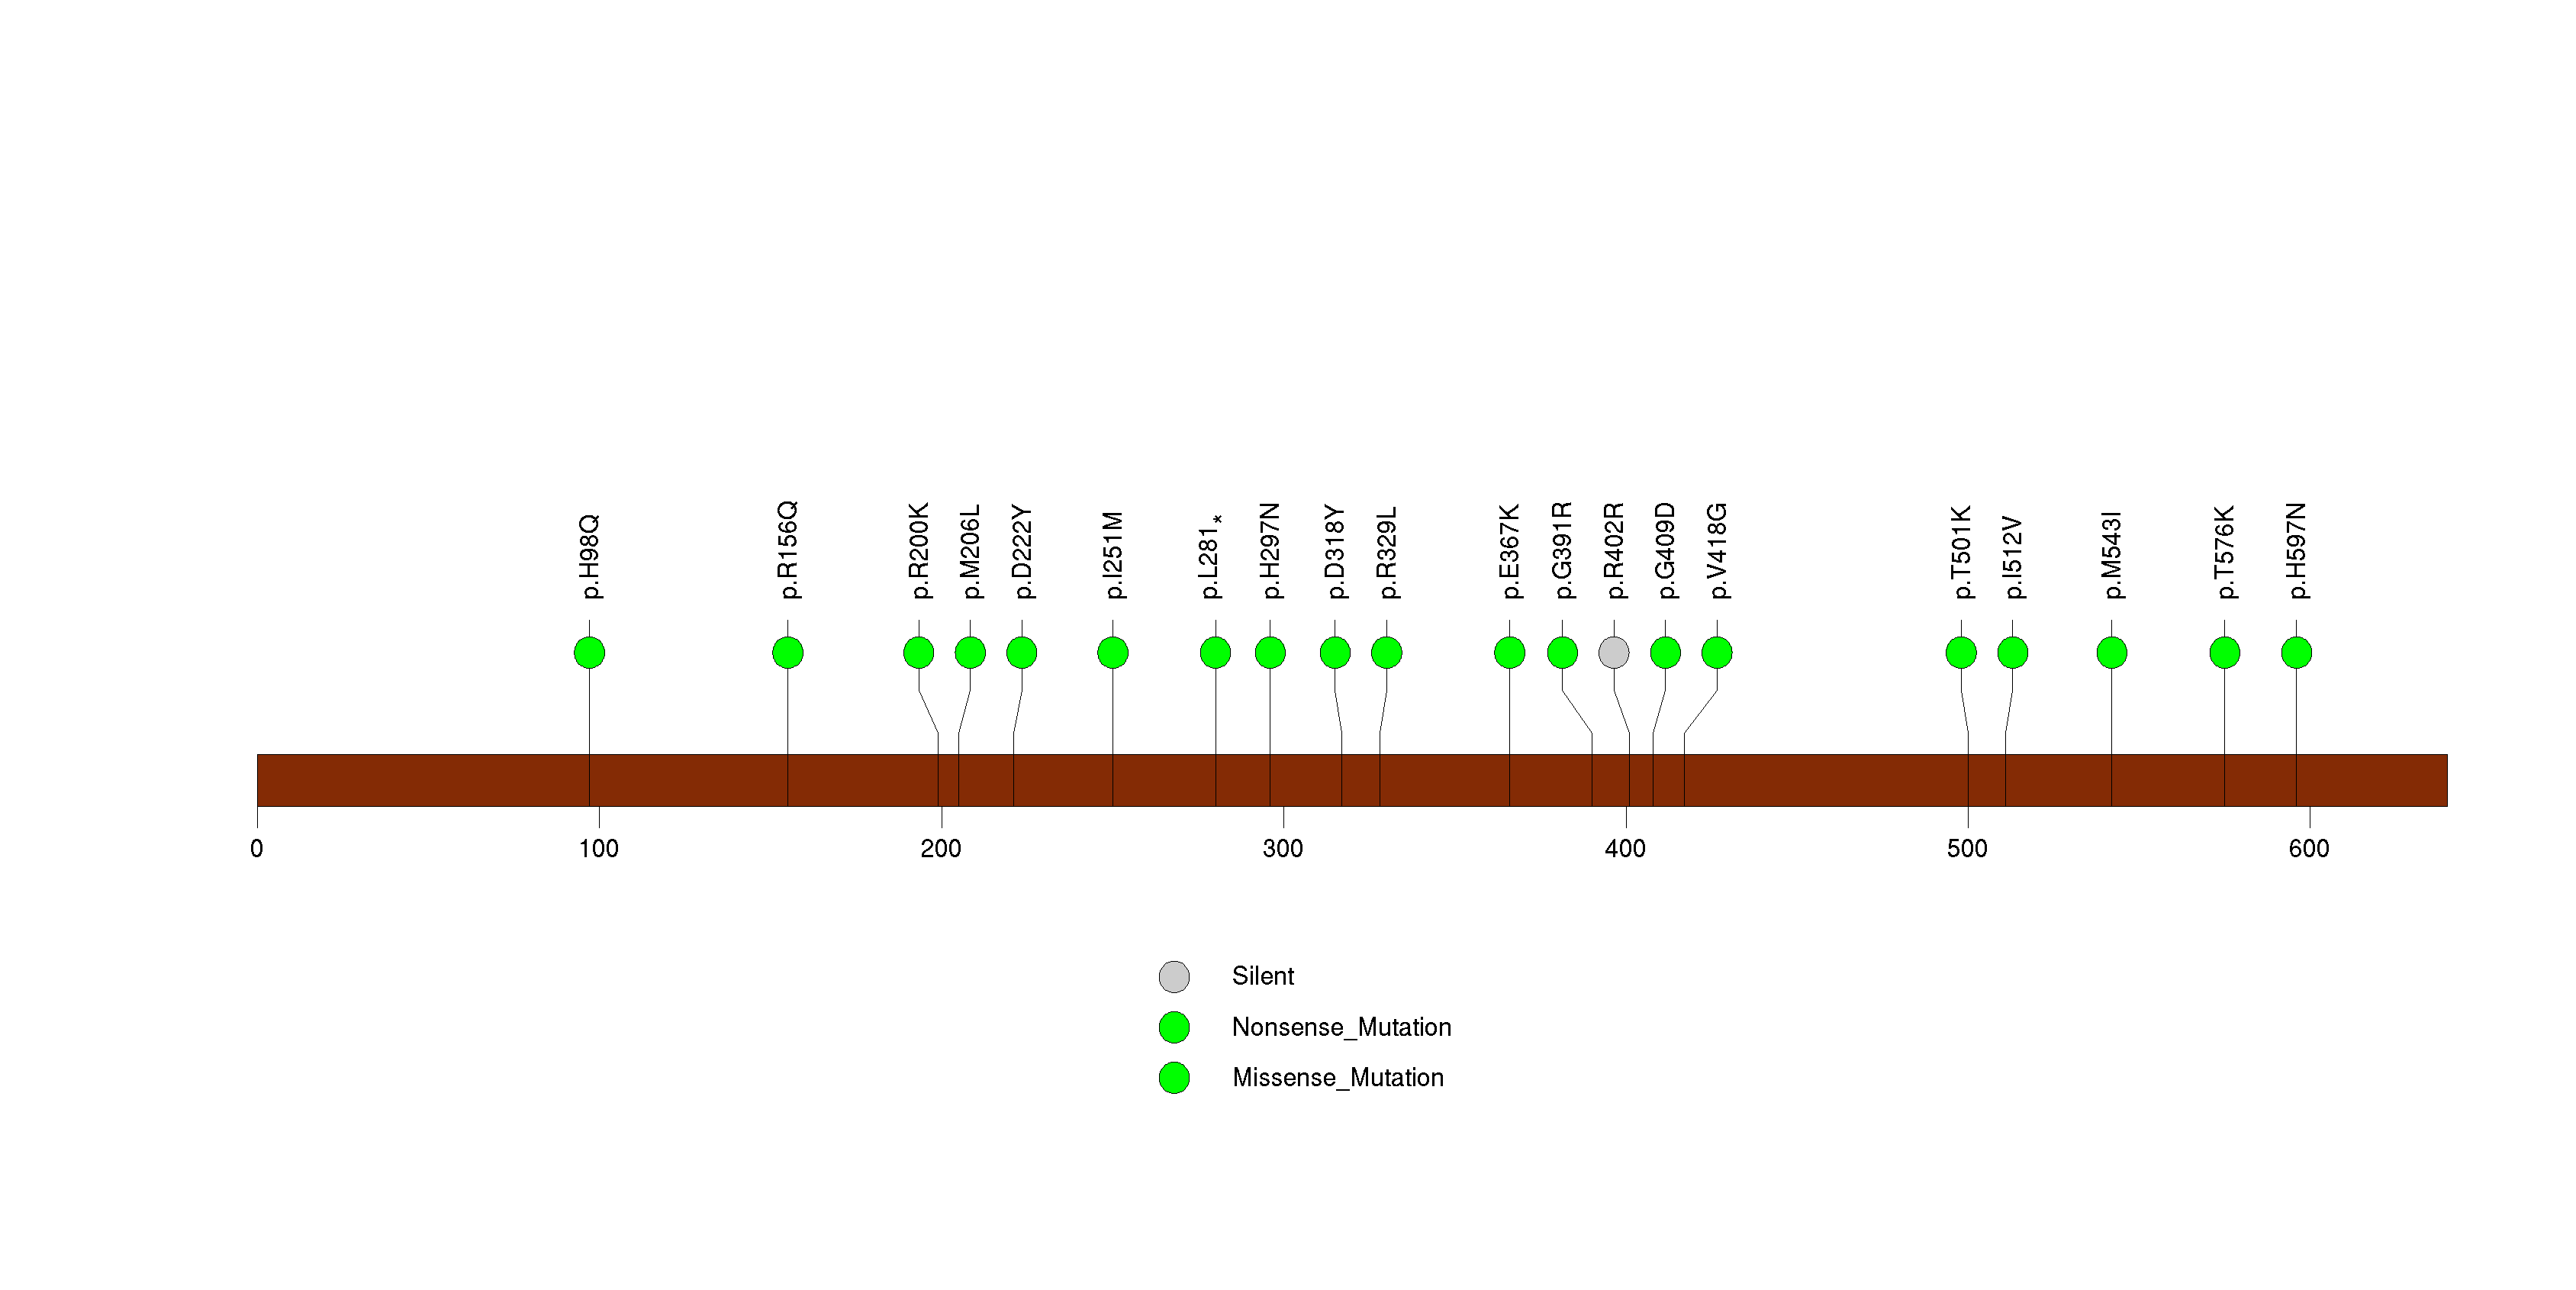
Figure S14. This figure depicts the distribution of mutations and mutation types across the ZBBX significant gene.
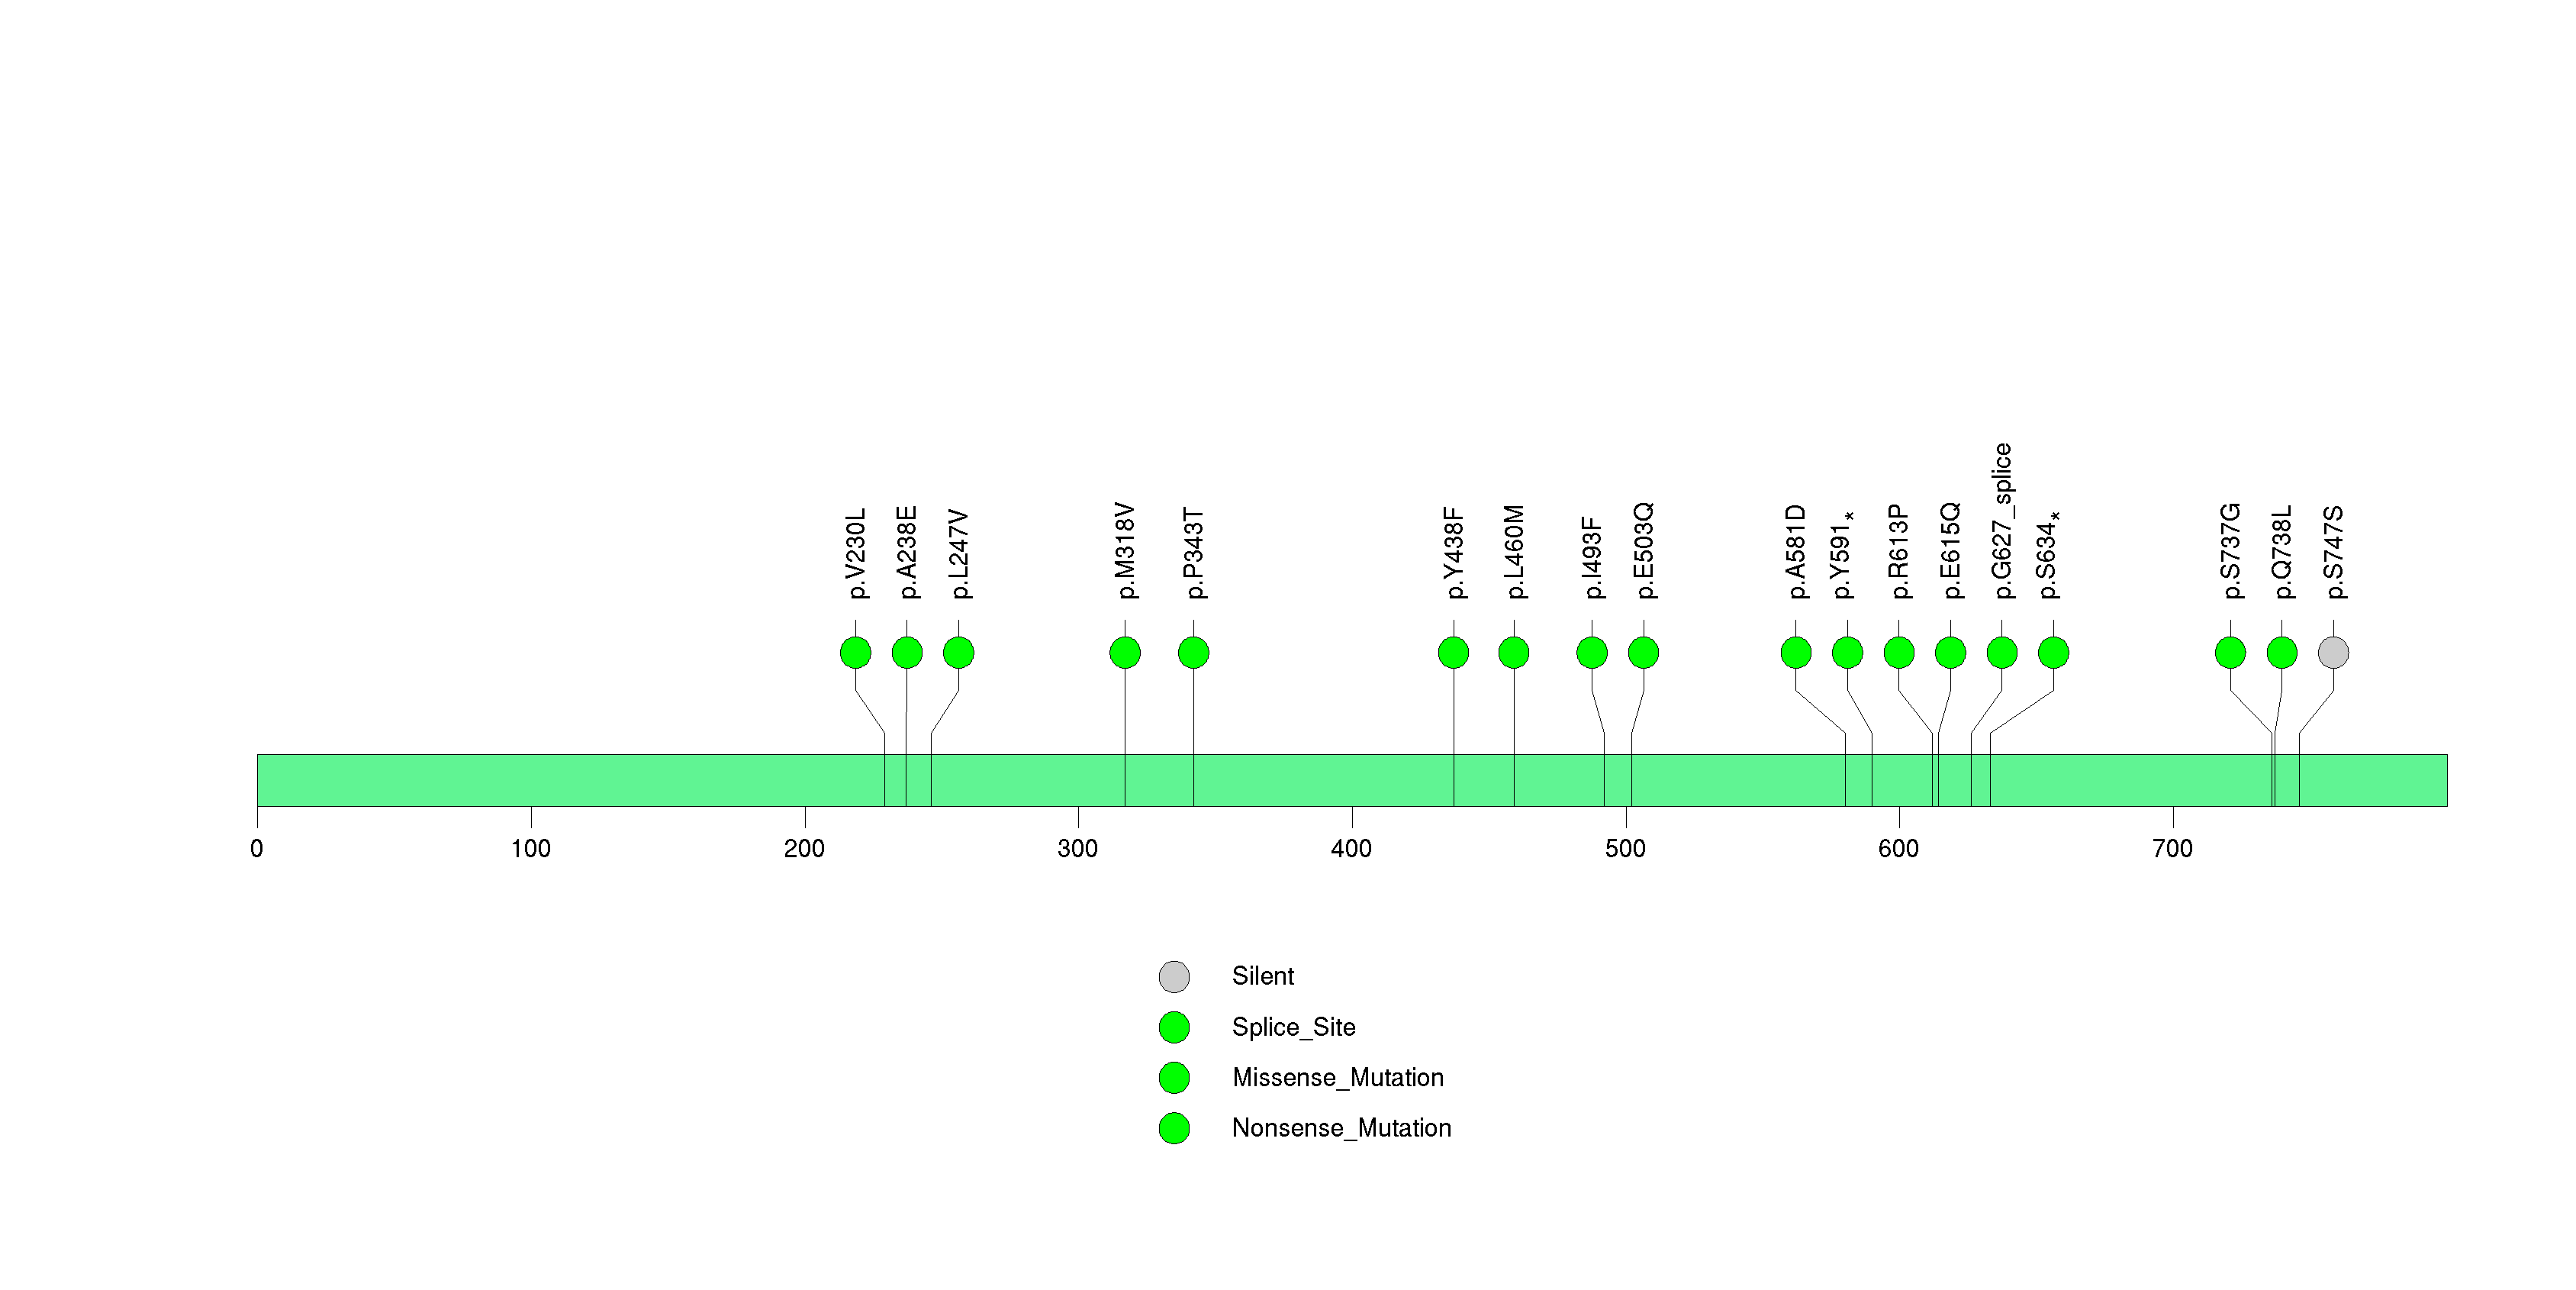
Figure S15. This figure depicts the distribution of mutations and mutation types across the REG1B significant gene.
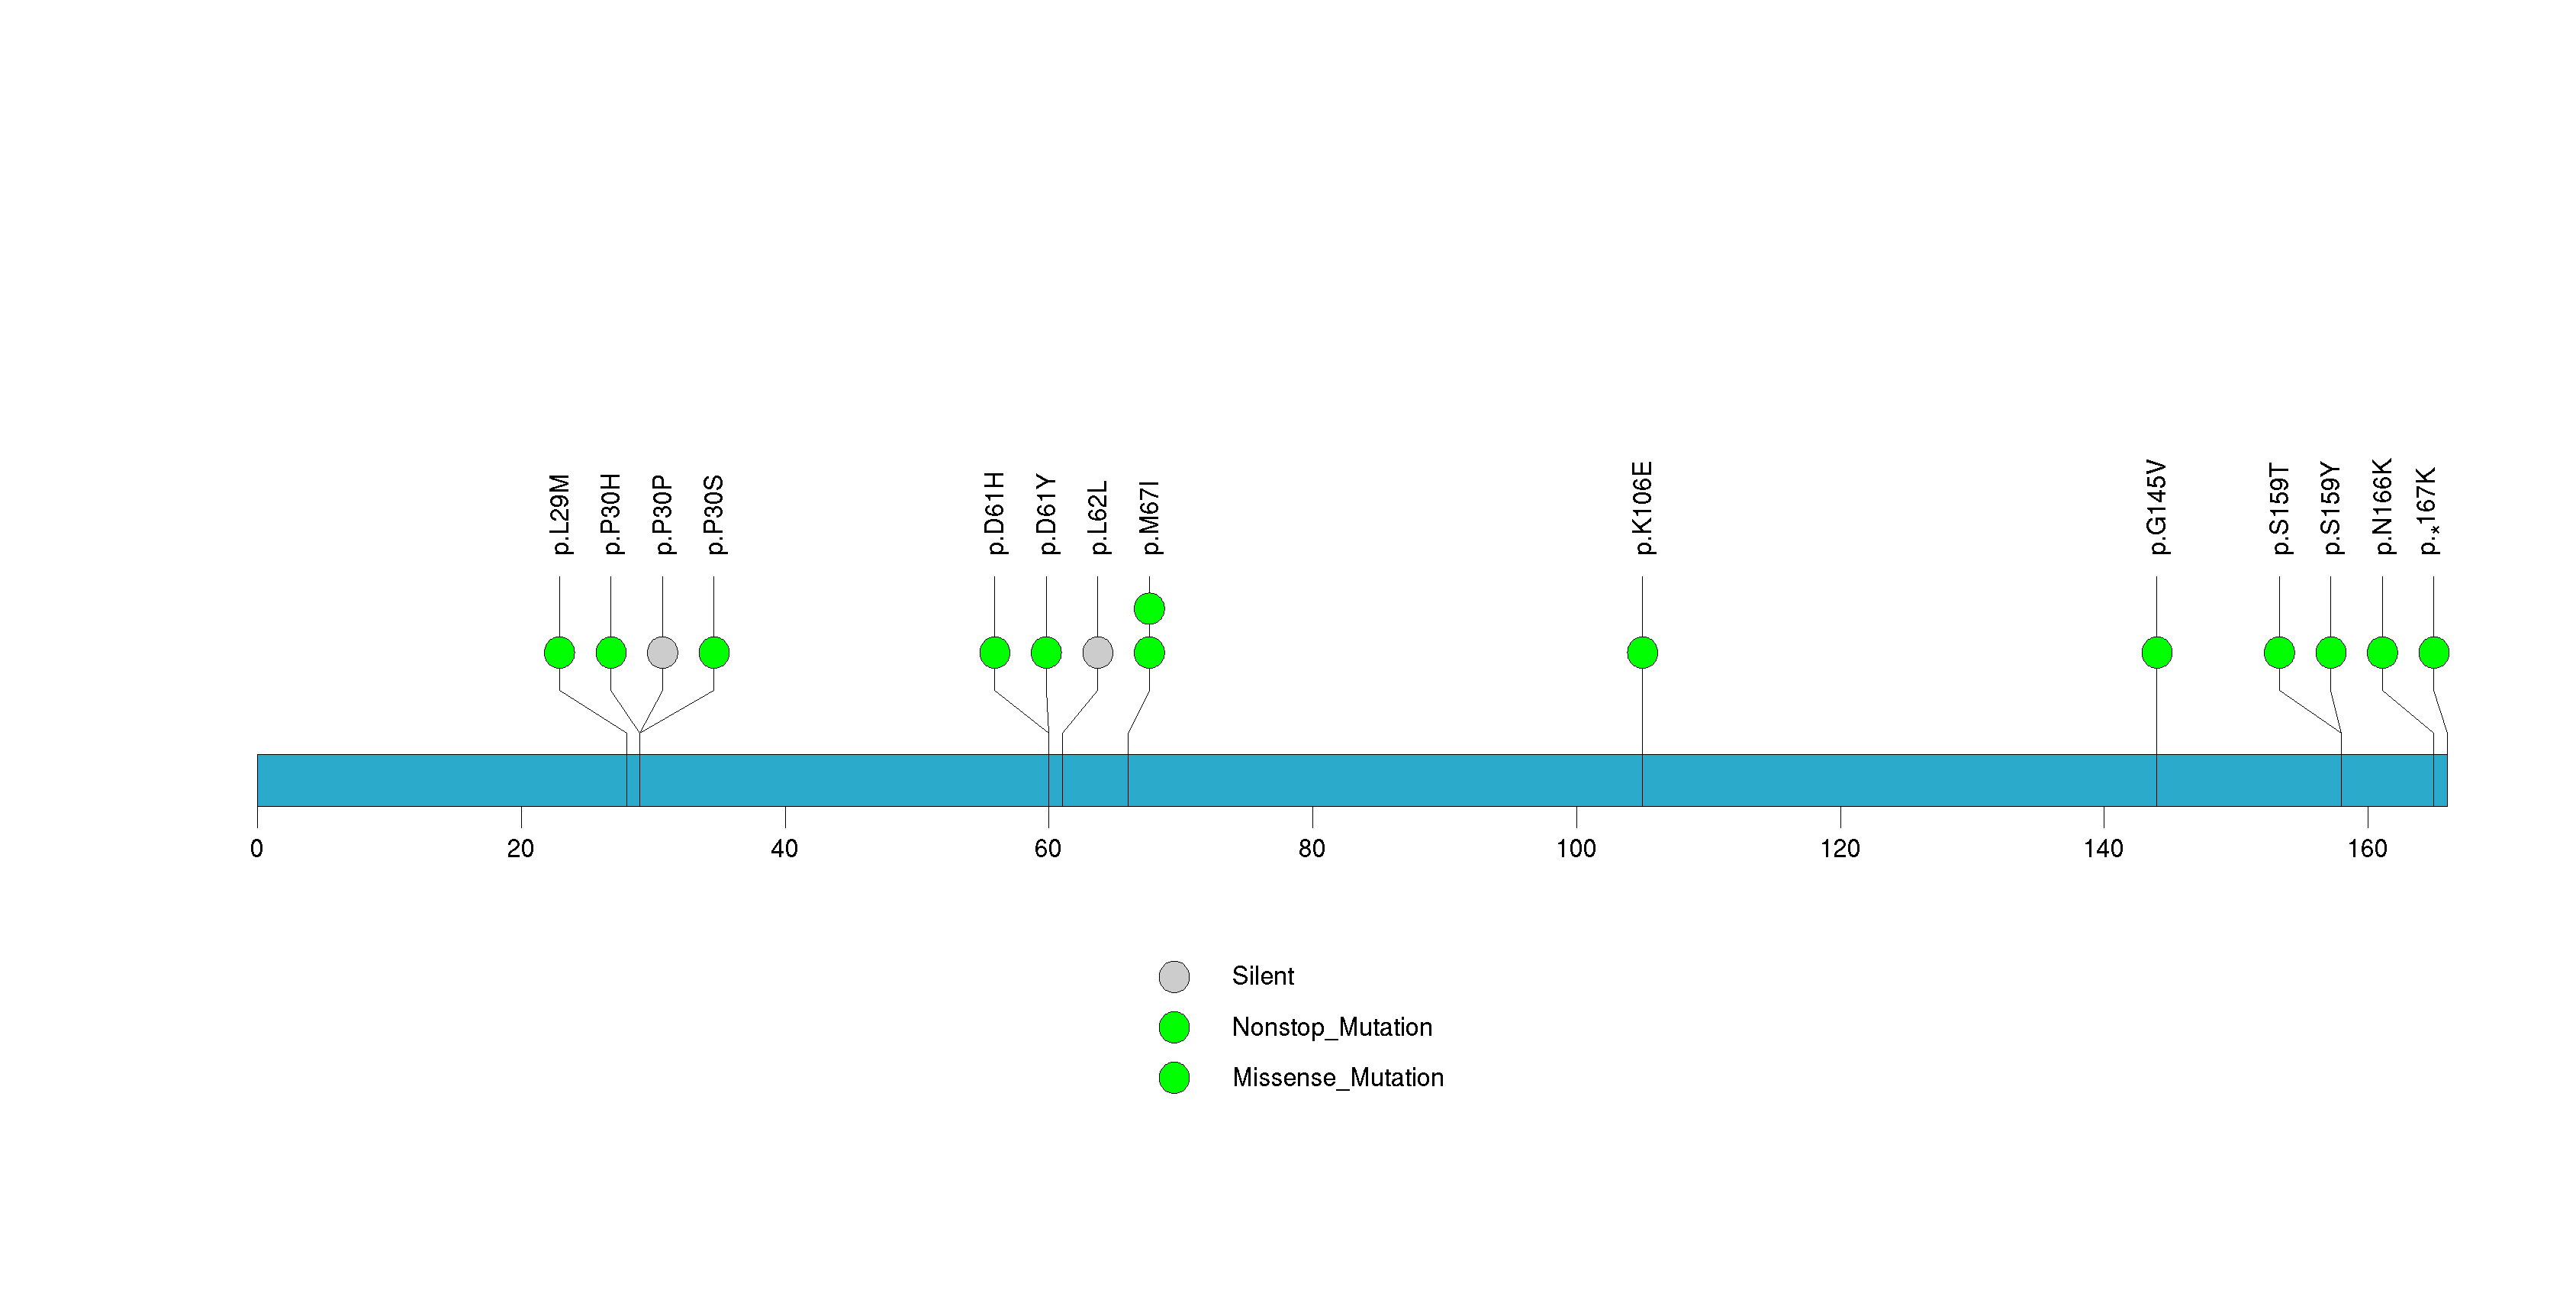
Figure S16. This figure depicts the distribution of mutations and mutation types across the CYP11B1 significant gene.
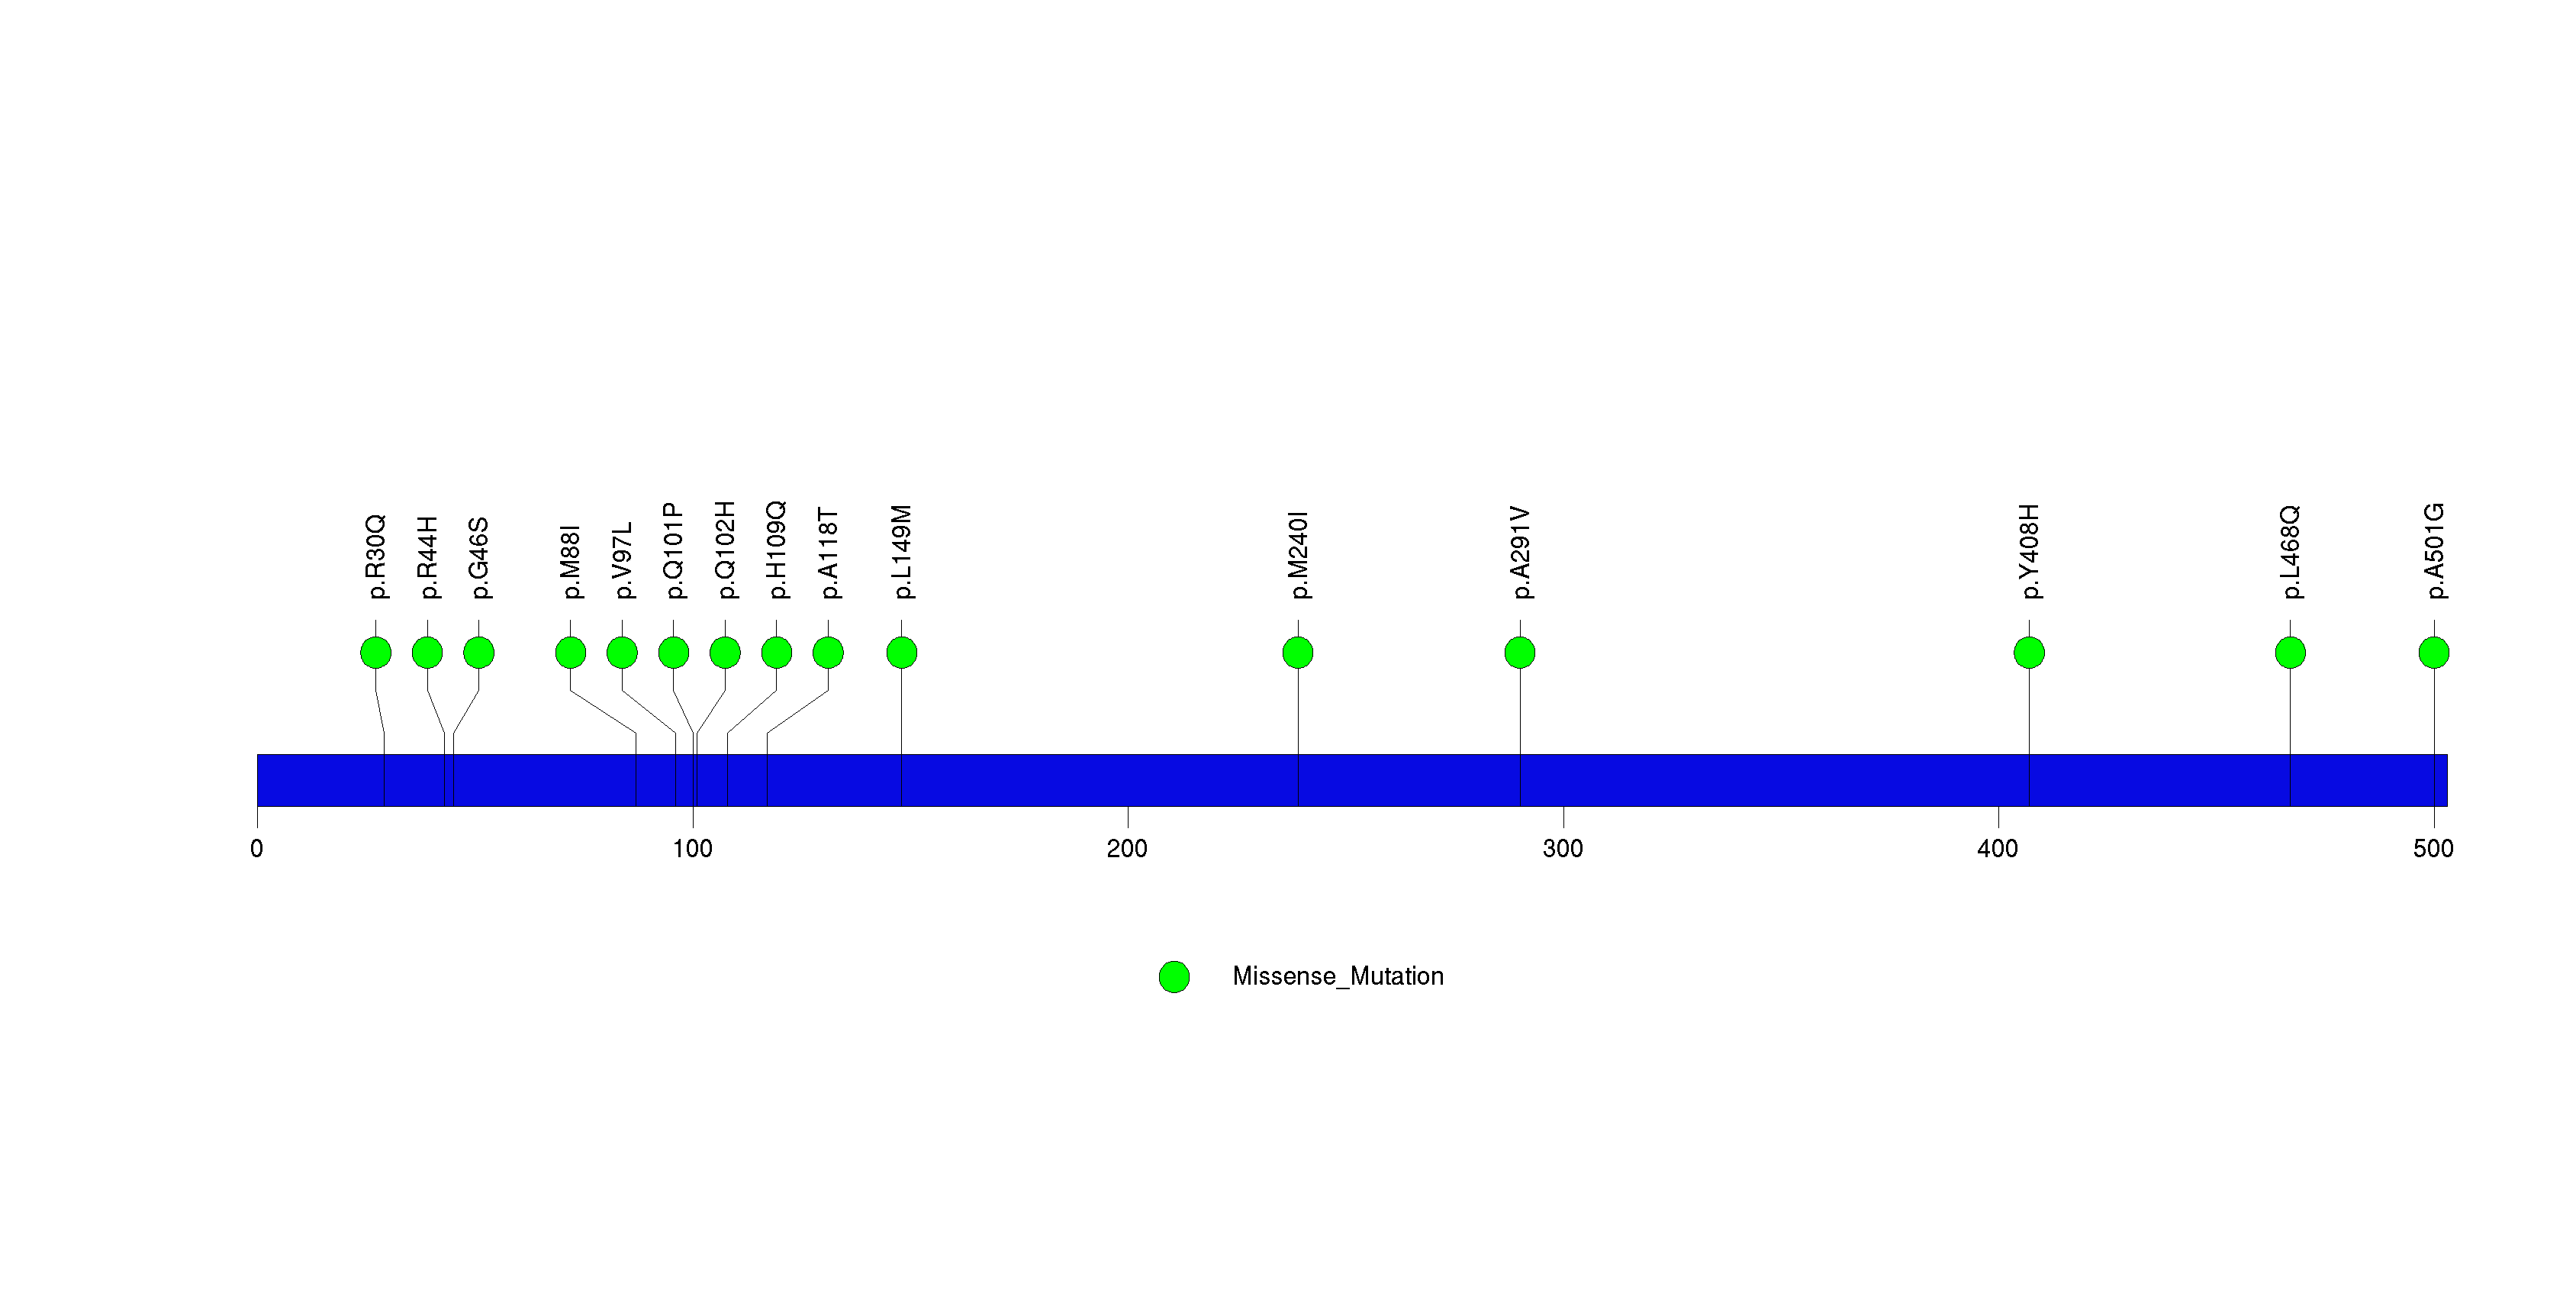
Figure S17. This figure depicts the distribution of mutations and mutation types across the CRB1 significant gene.
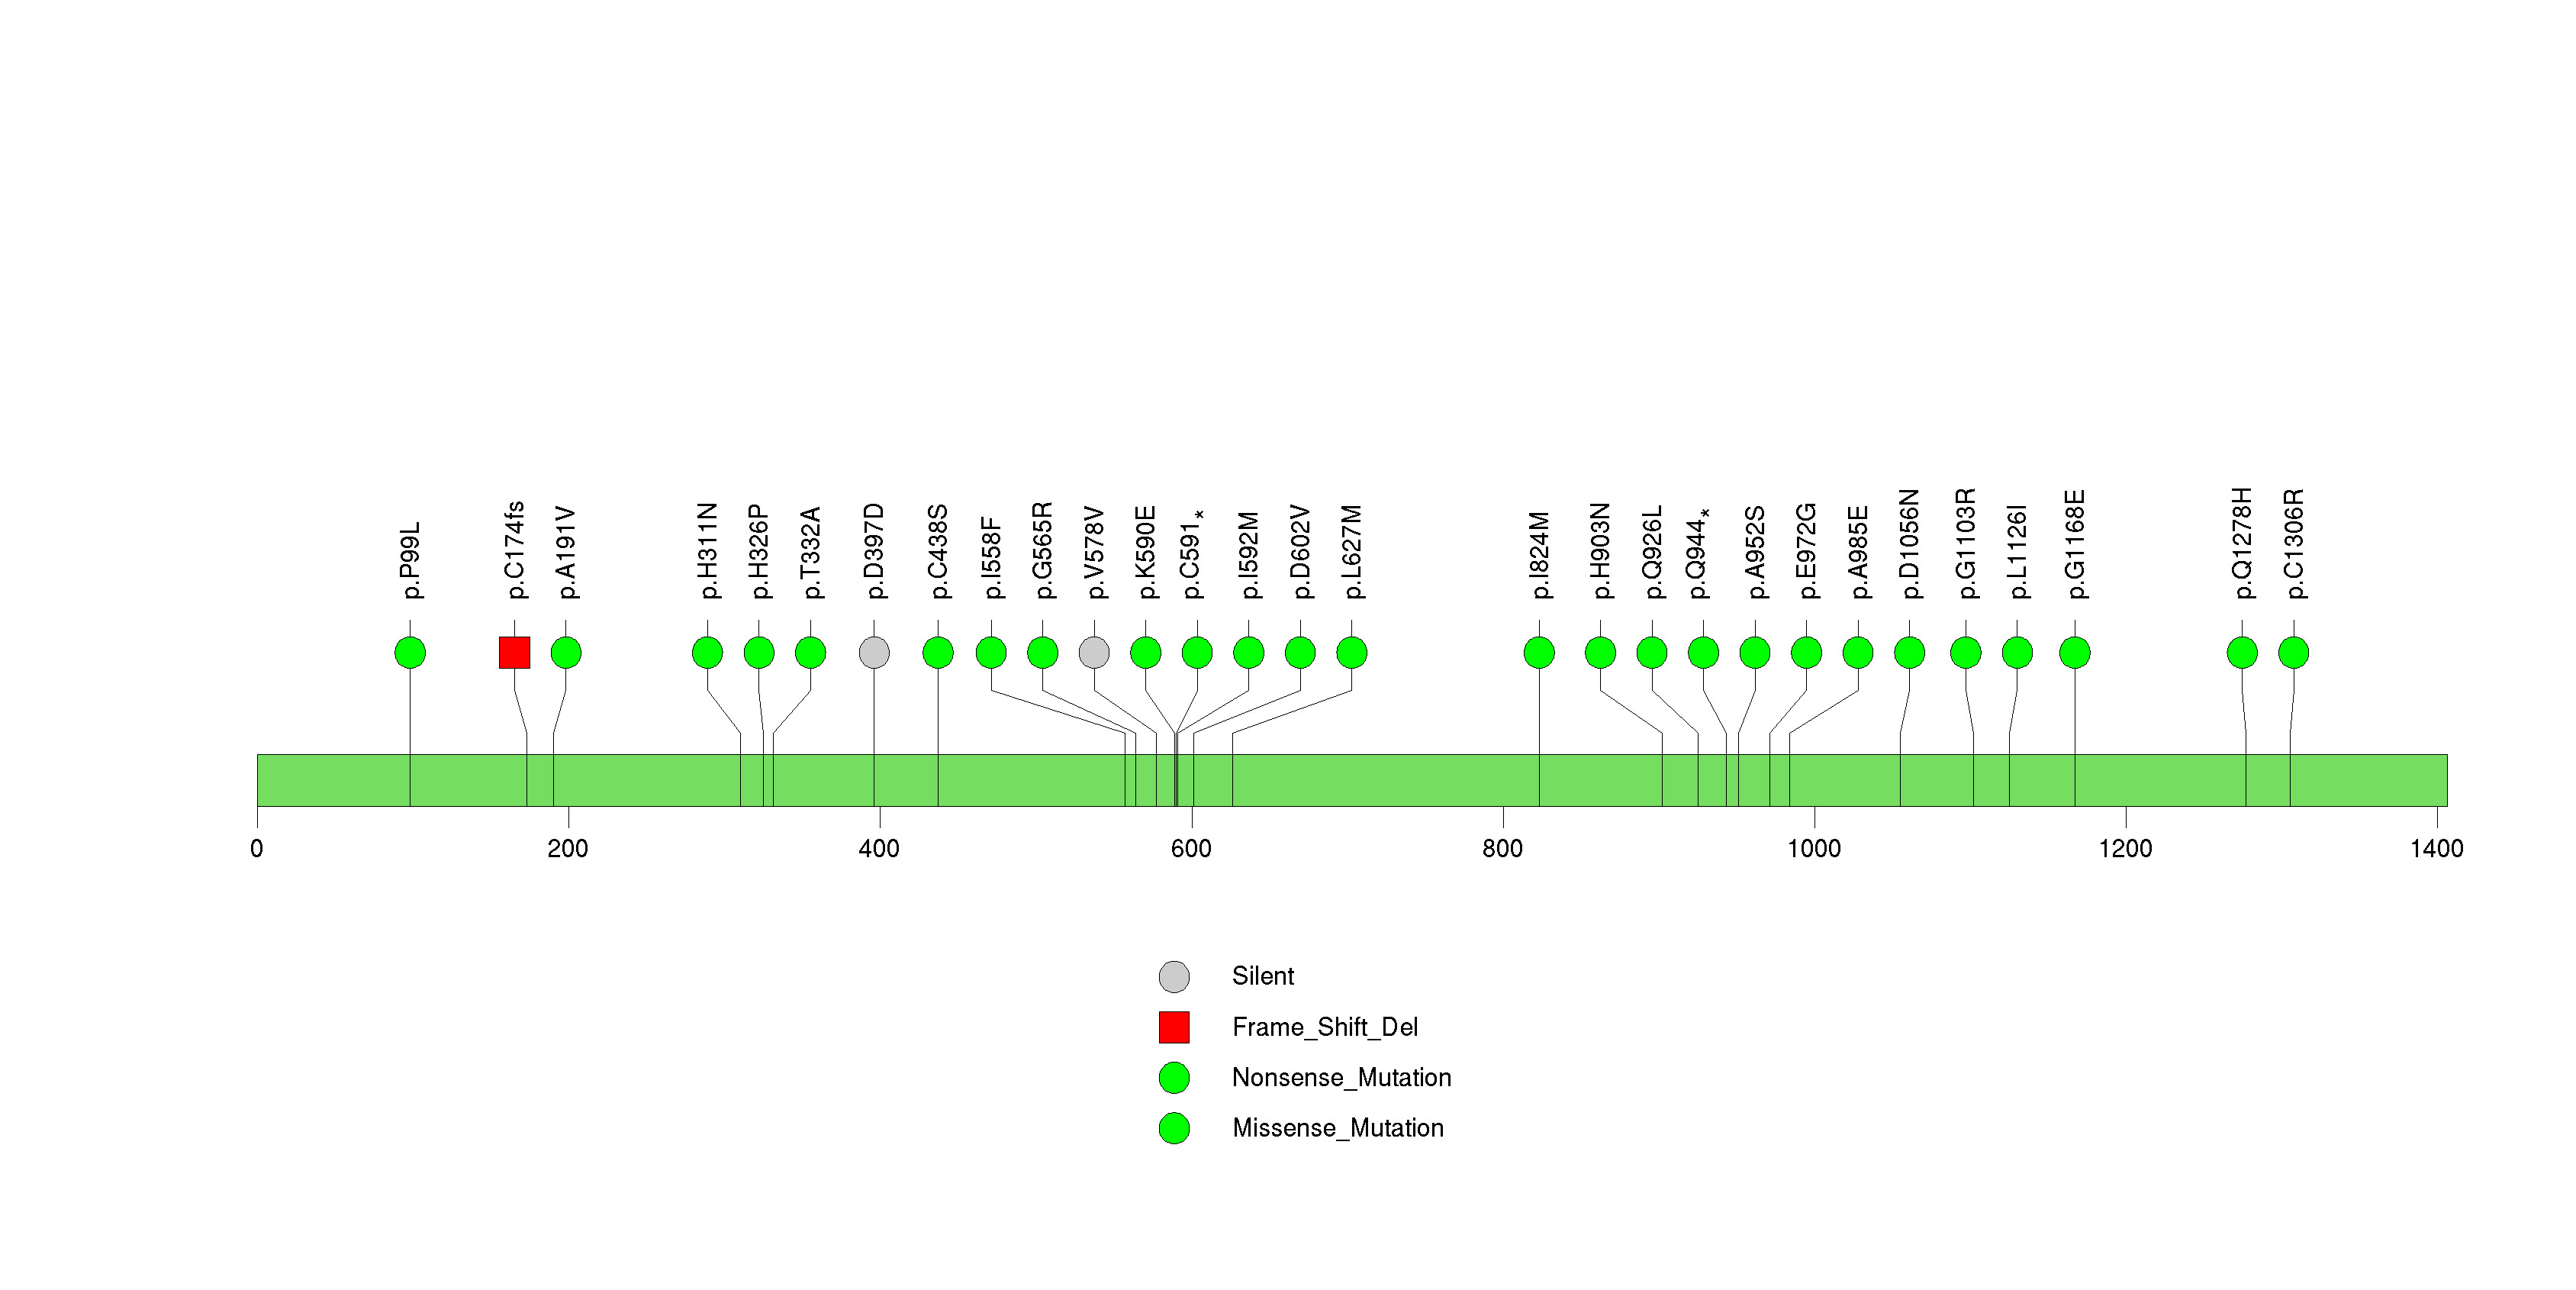
Figure S18. This figure depicts the distribution of mutations and mutation types across the OR2T33 significant gene.
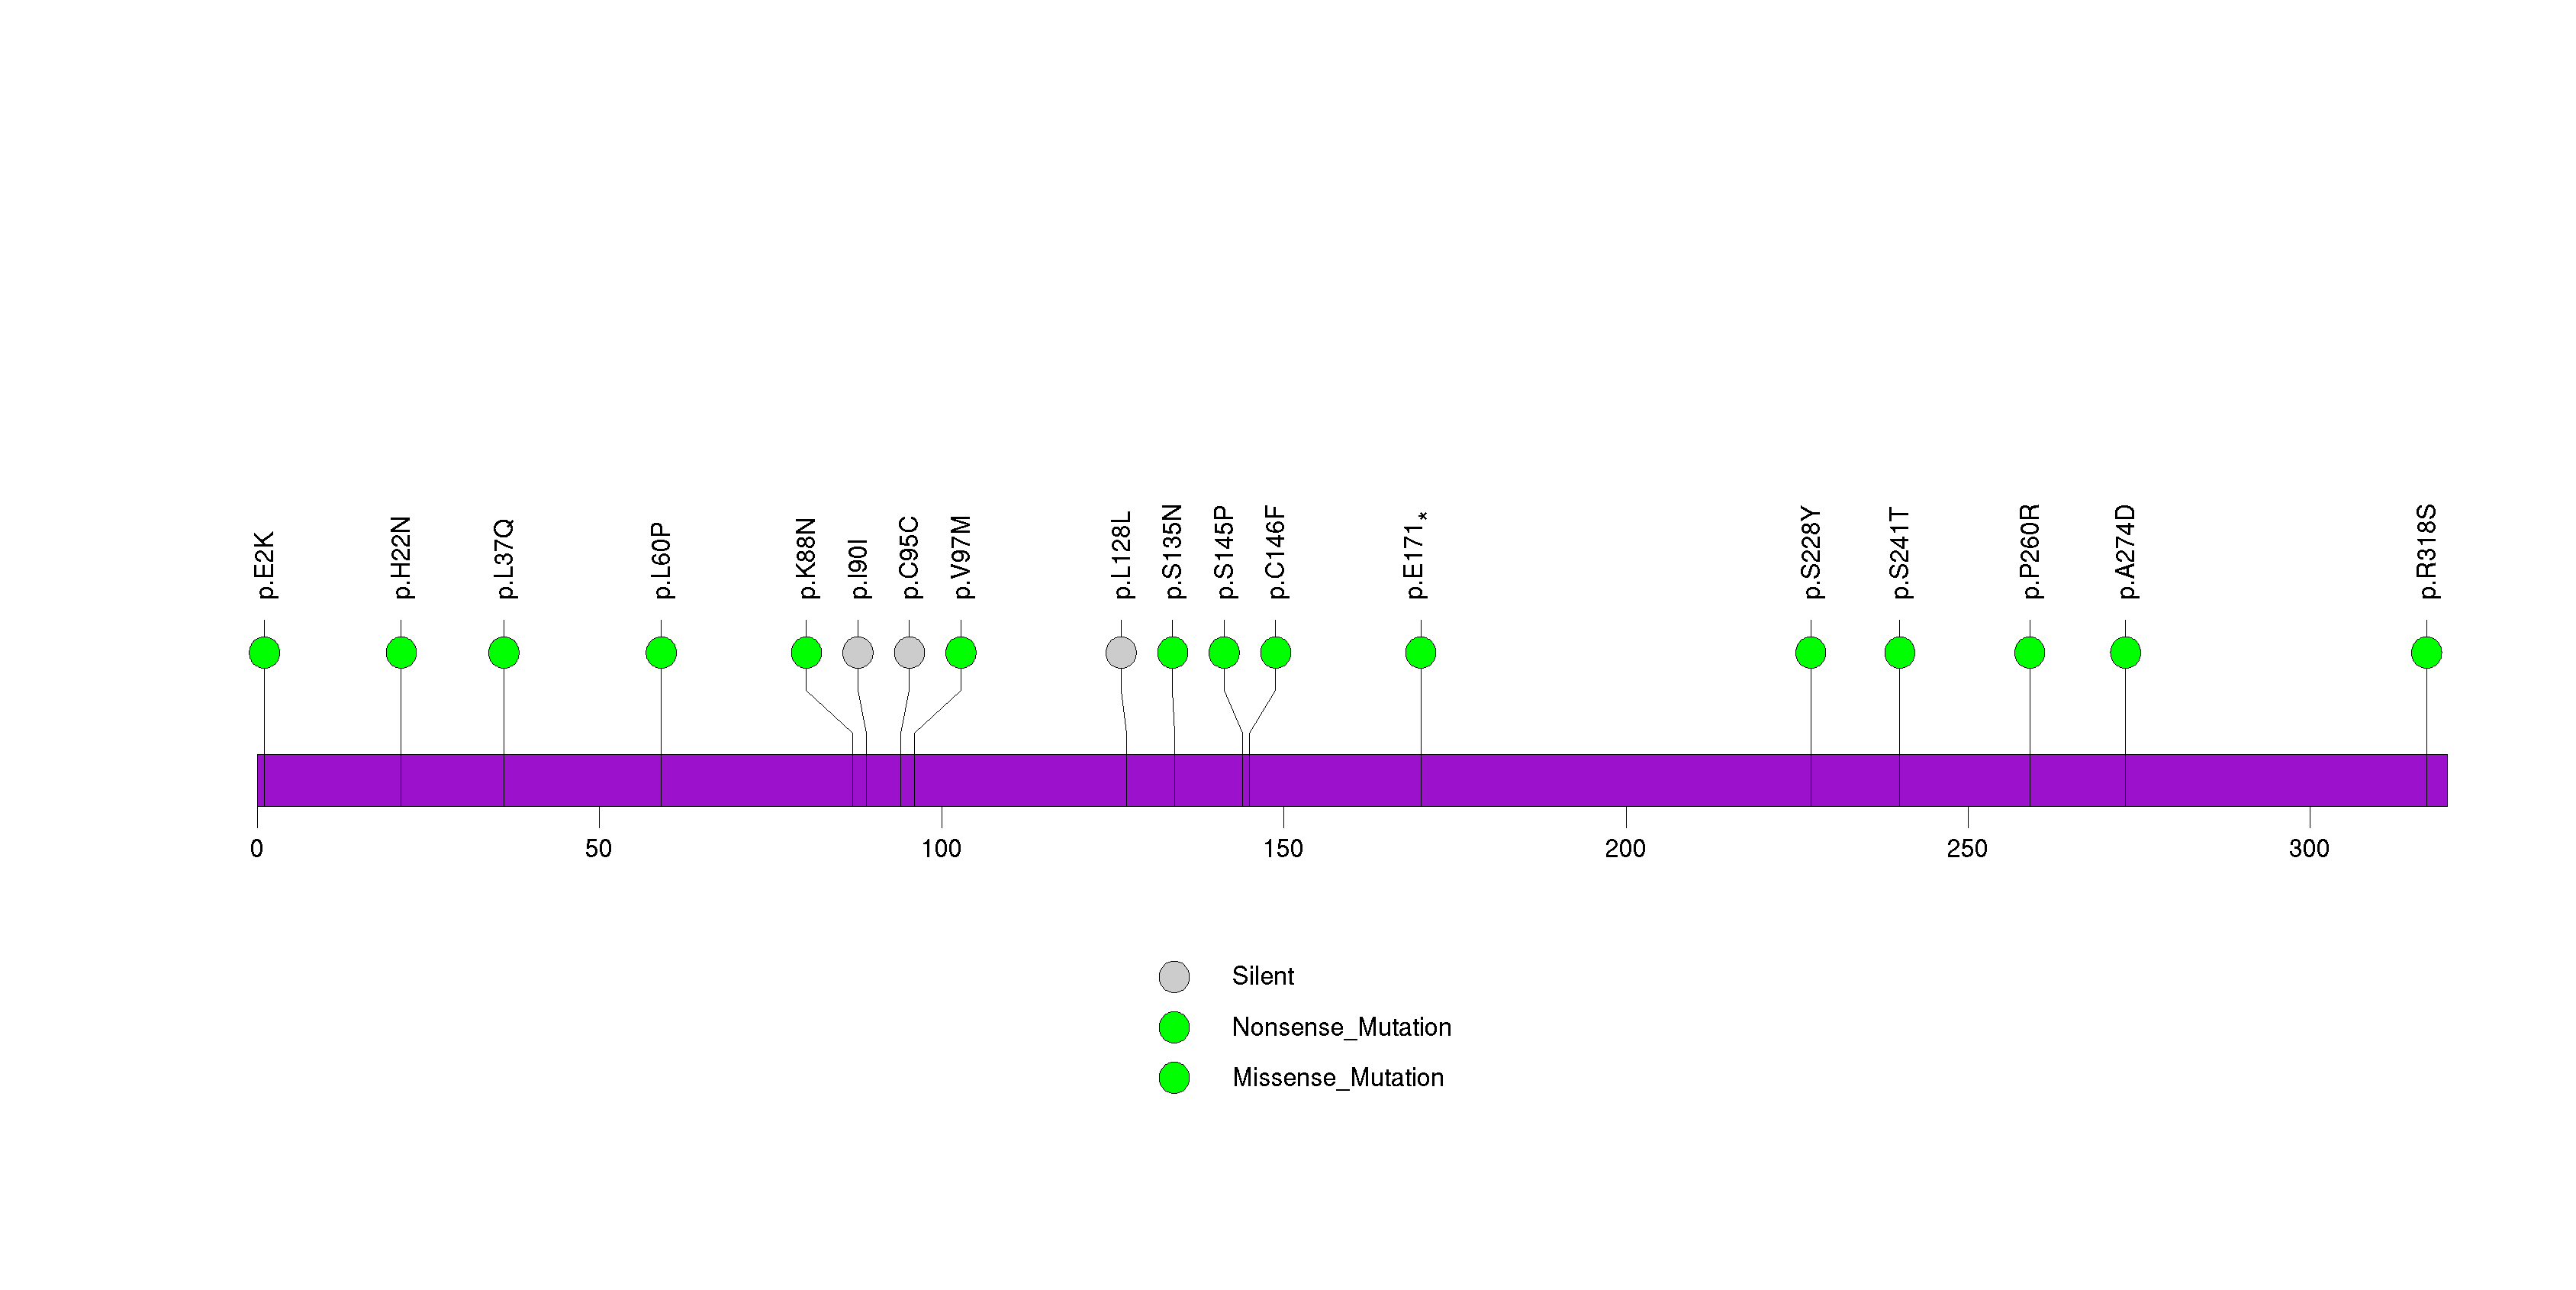
Figure S19. This figure depicts the distribution of mutations and mutation types across the USP29 significant gene.
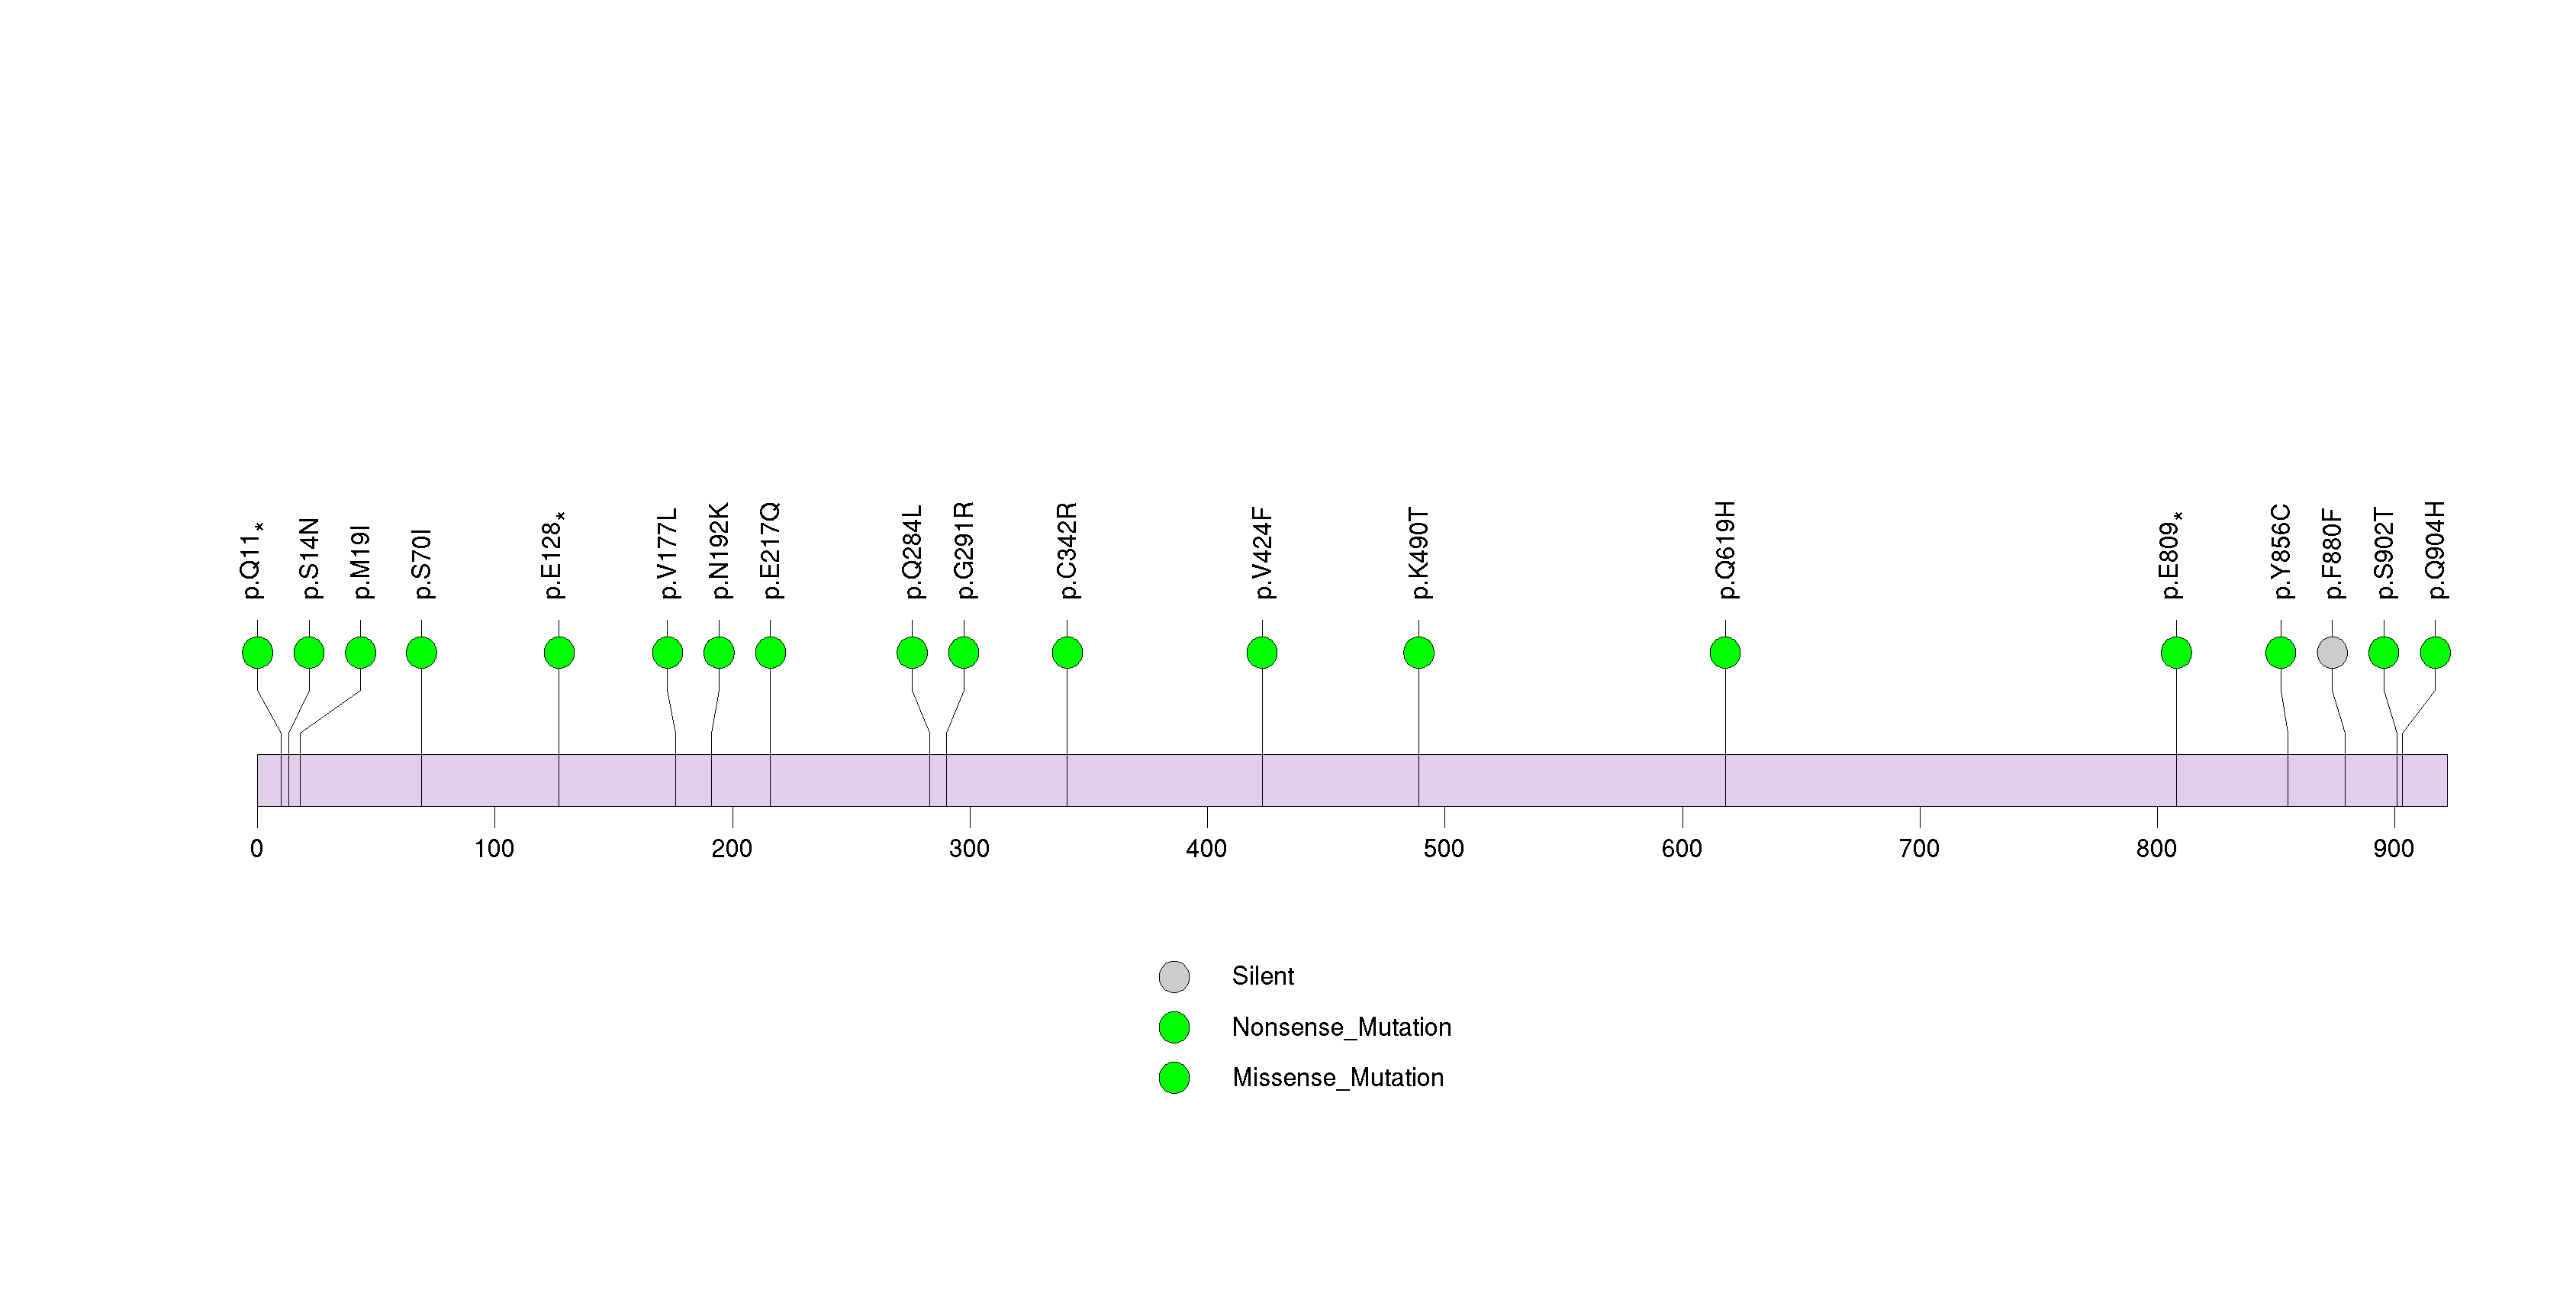
Figure S20. This figure depicts the distribution of mutations and mutation types across the OR6F1 significant gene.
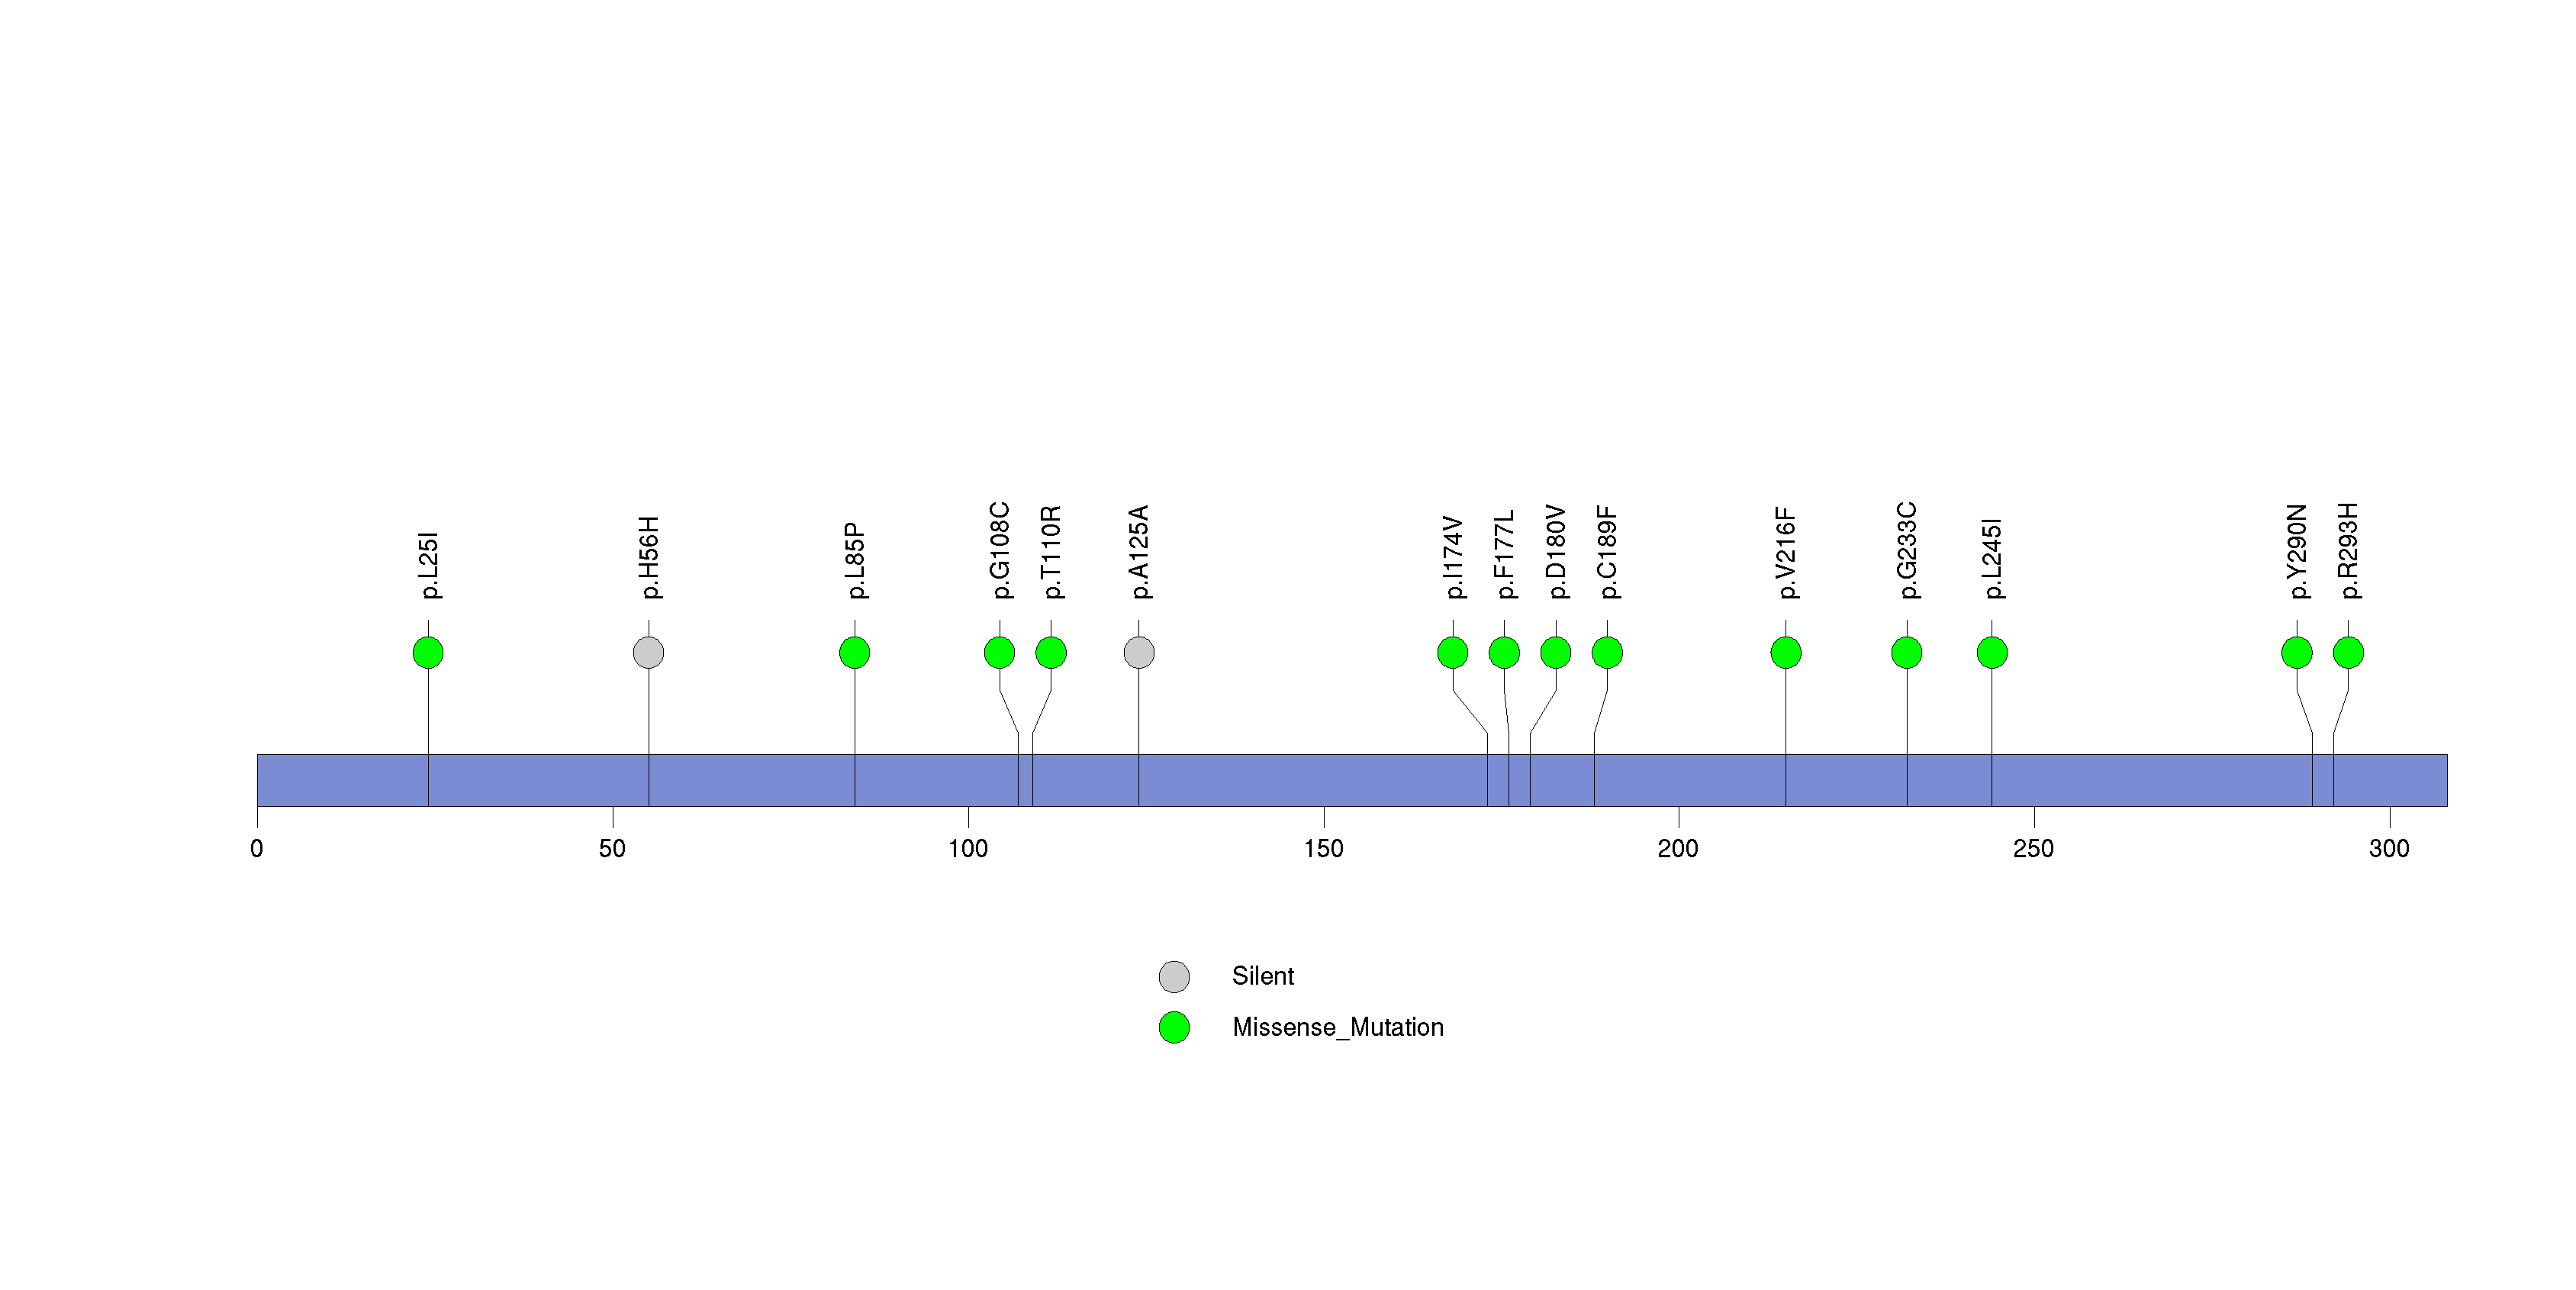
Figure S21. This figure depicts the distribution of mutations and mutation types across the SPHKAP significant gene.
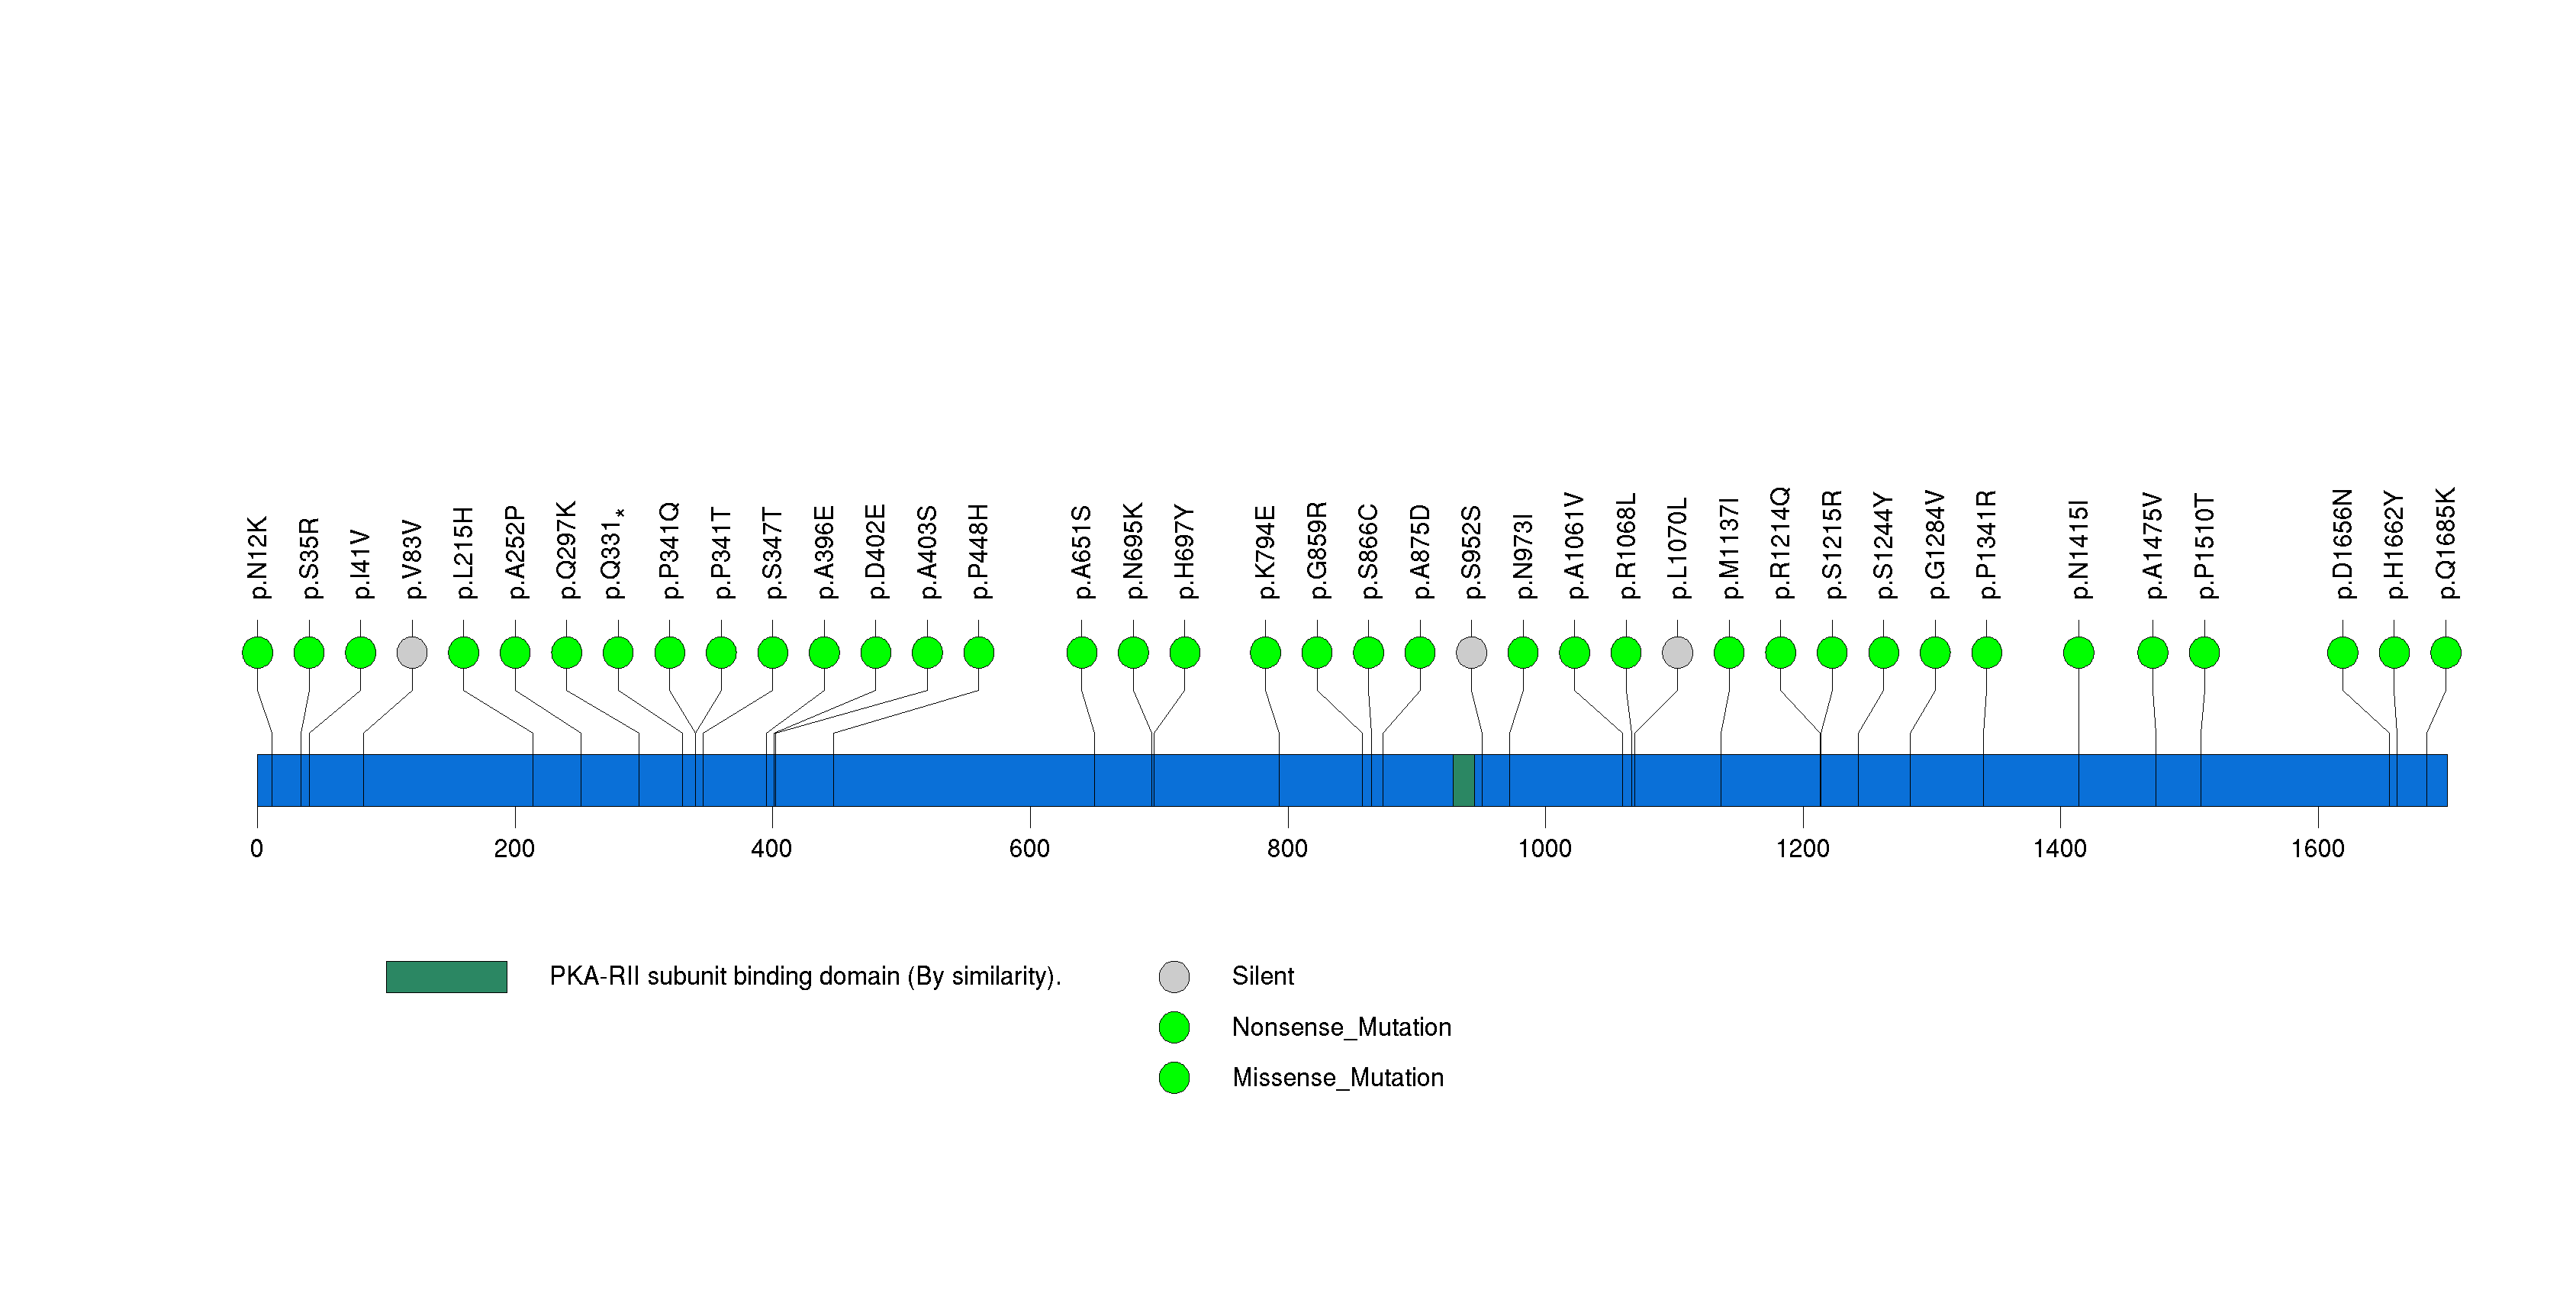
Figure S22. This figure depicts the distribution of mutations and mutation types across the MAGEB2 significant gene.
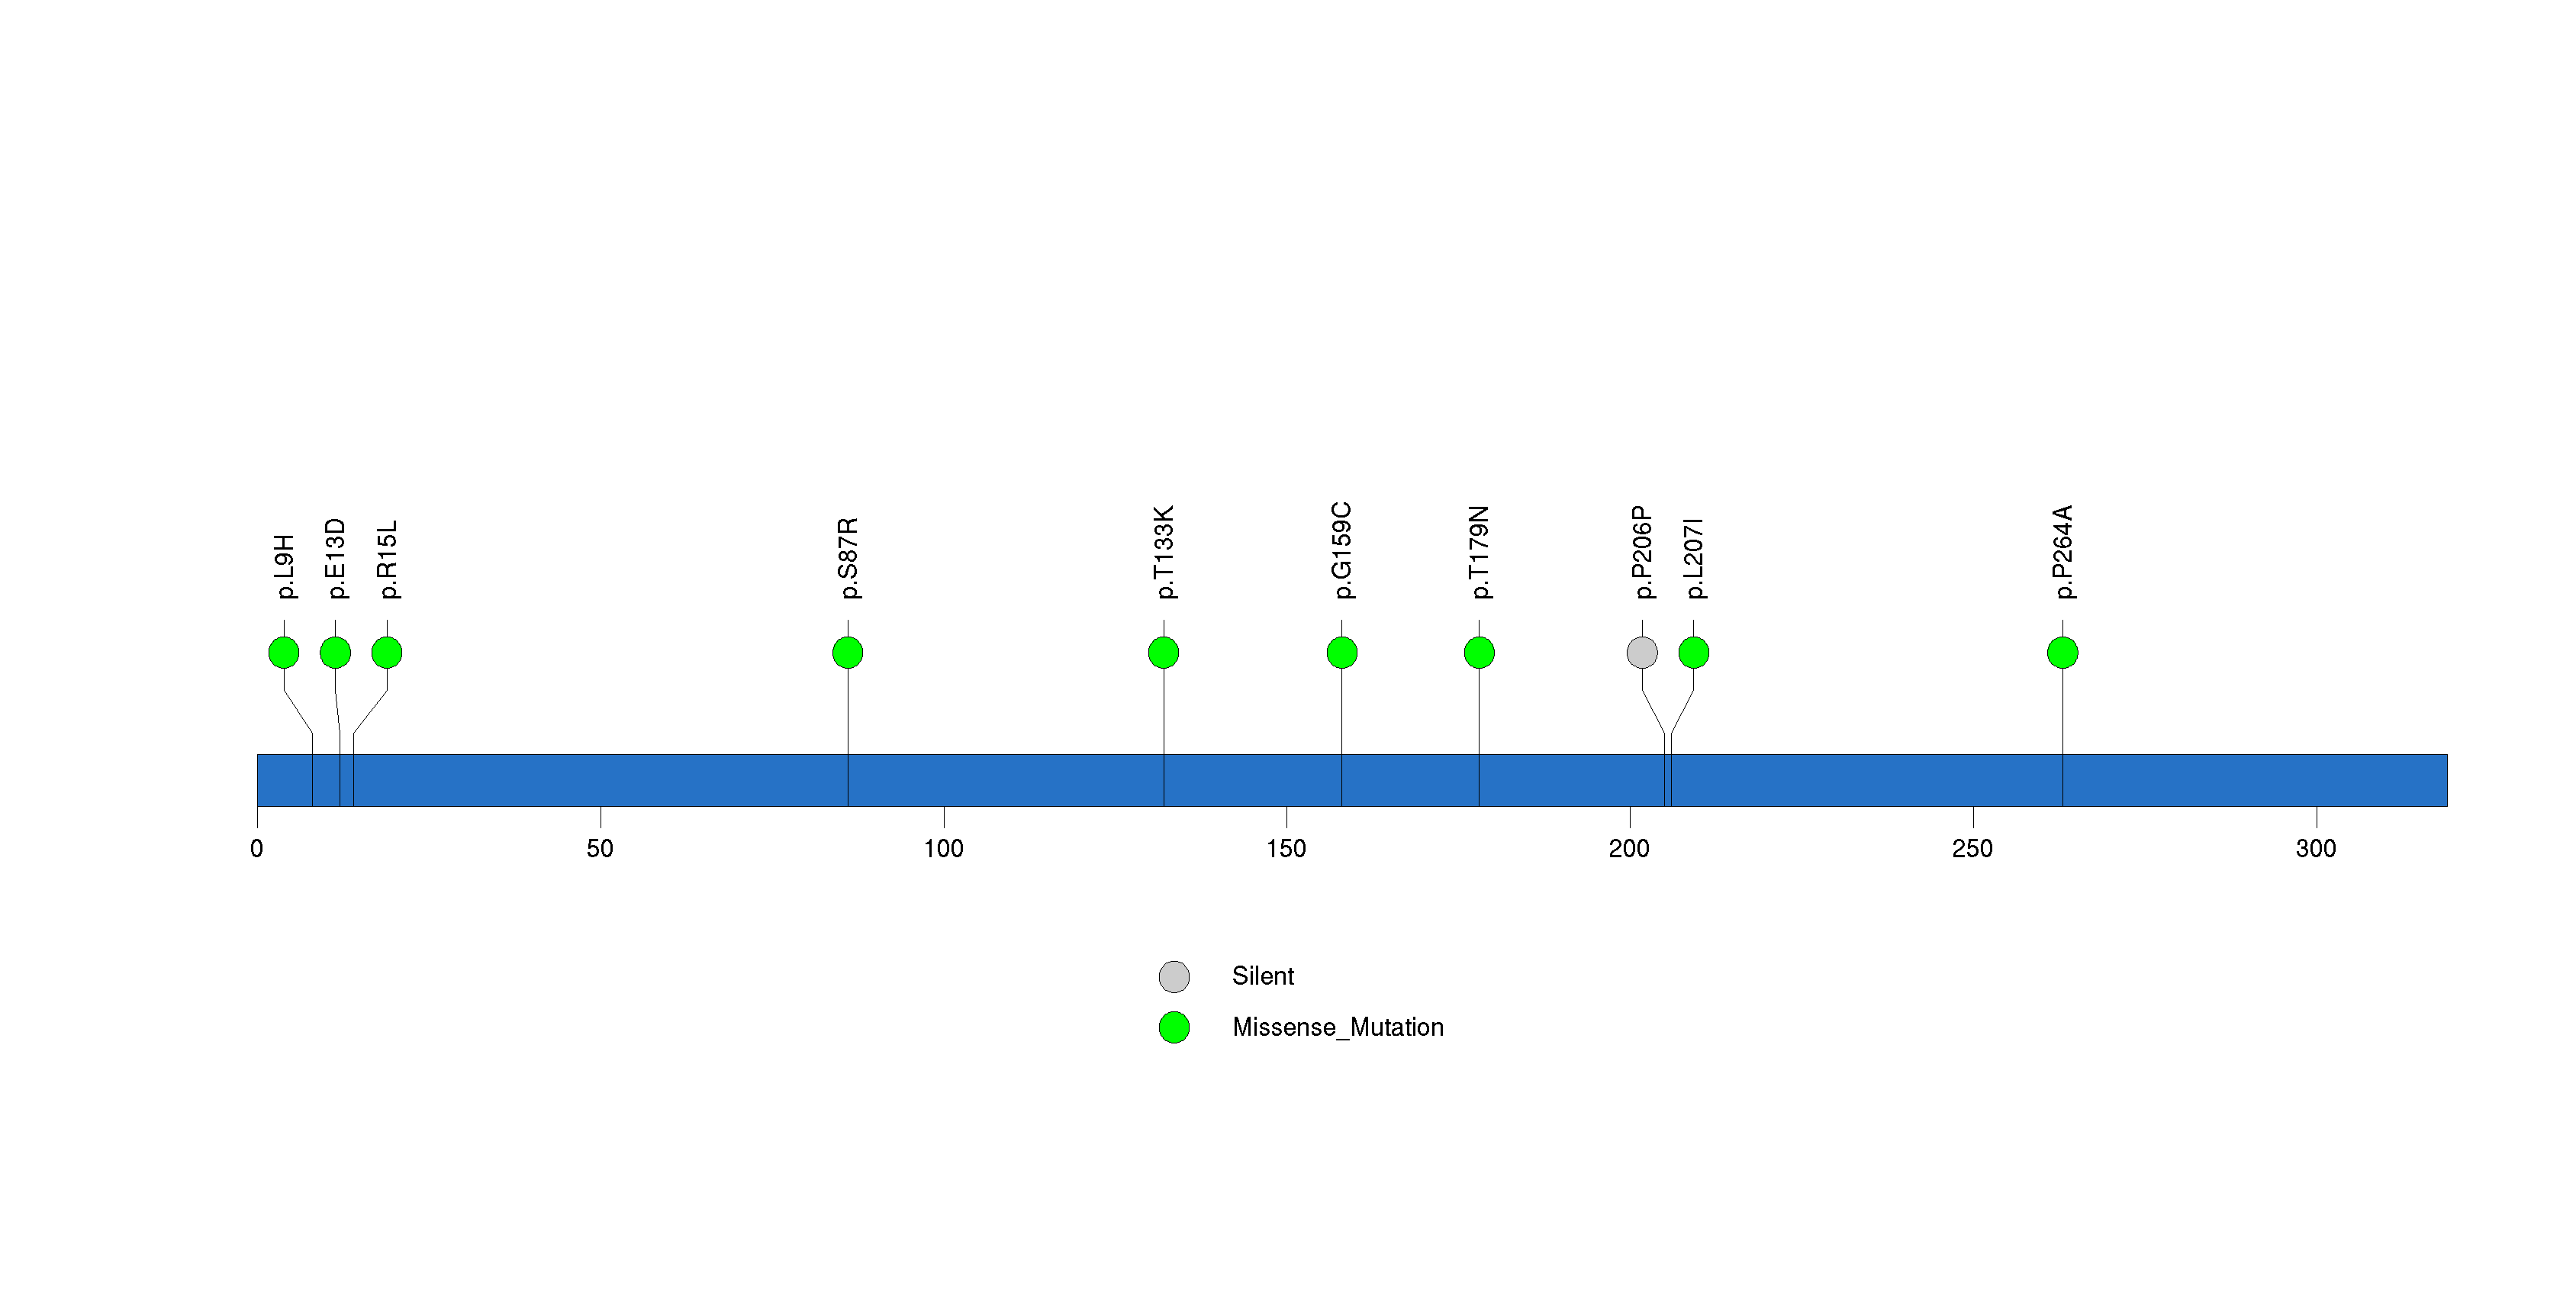
Figure S23. This figure depicts the distribution of mutations and mutation types across the OR4M2 significant gene.
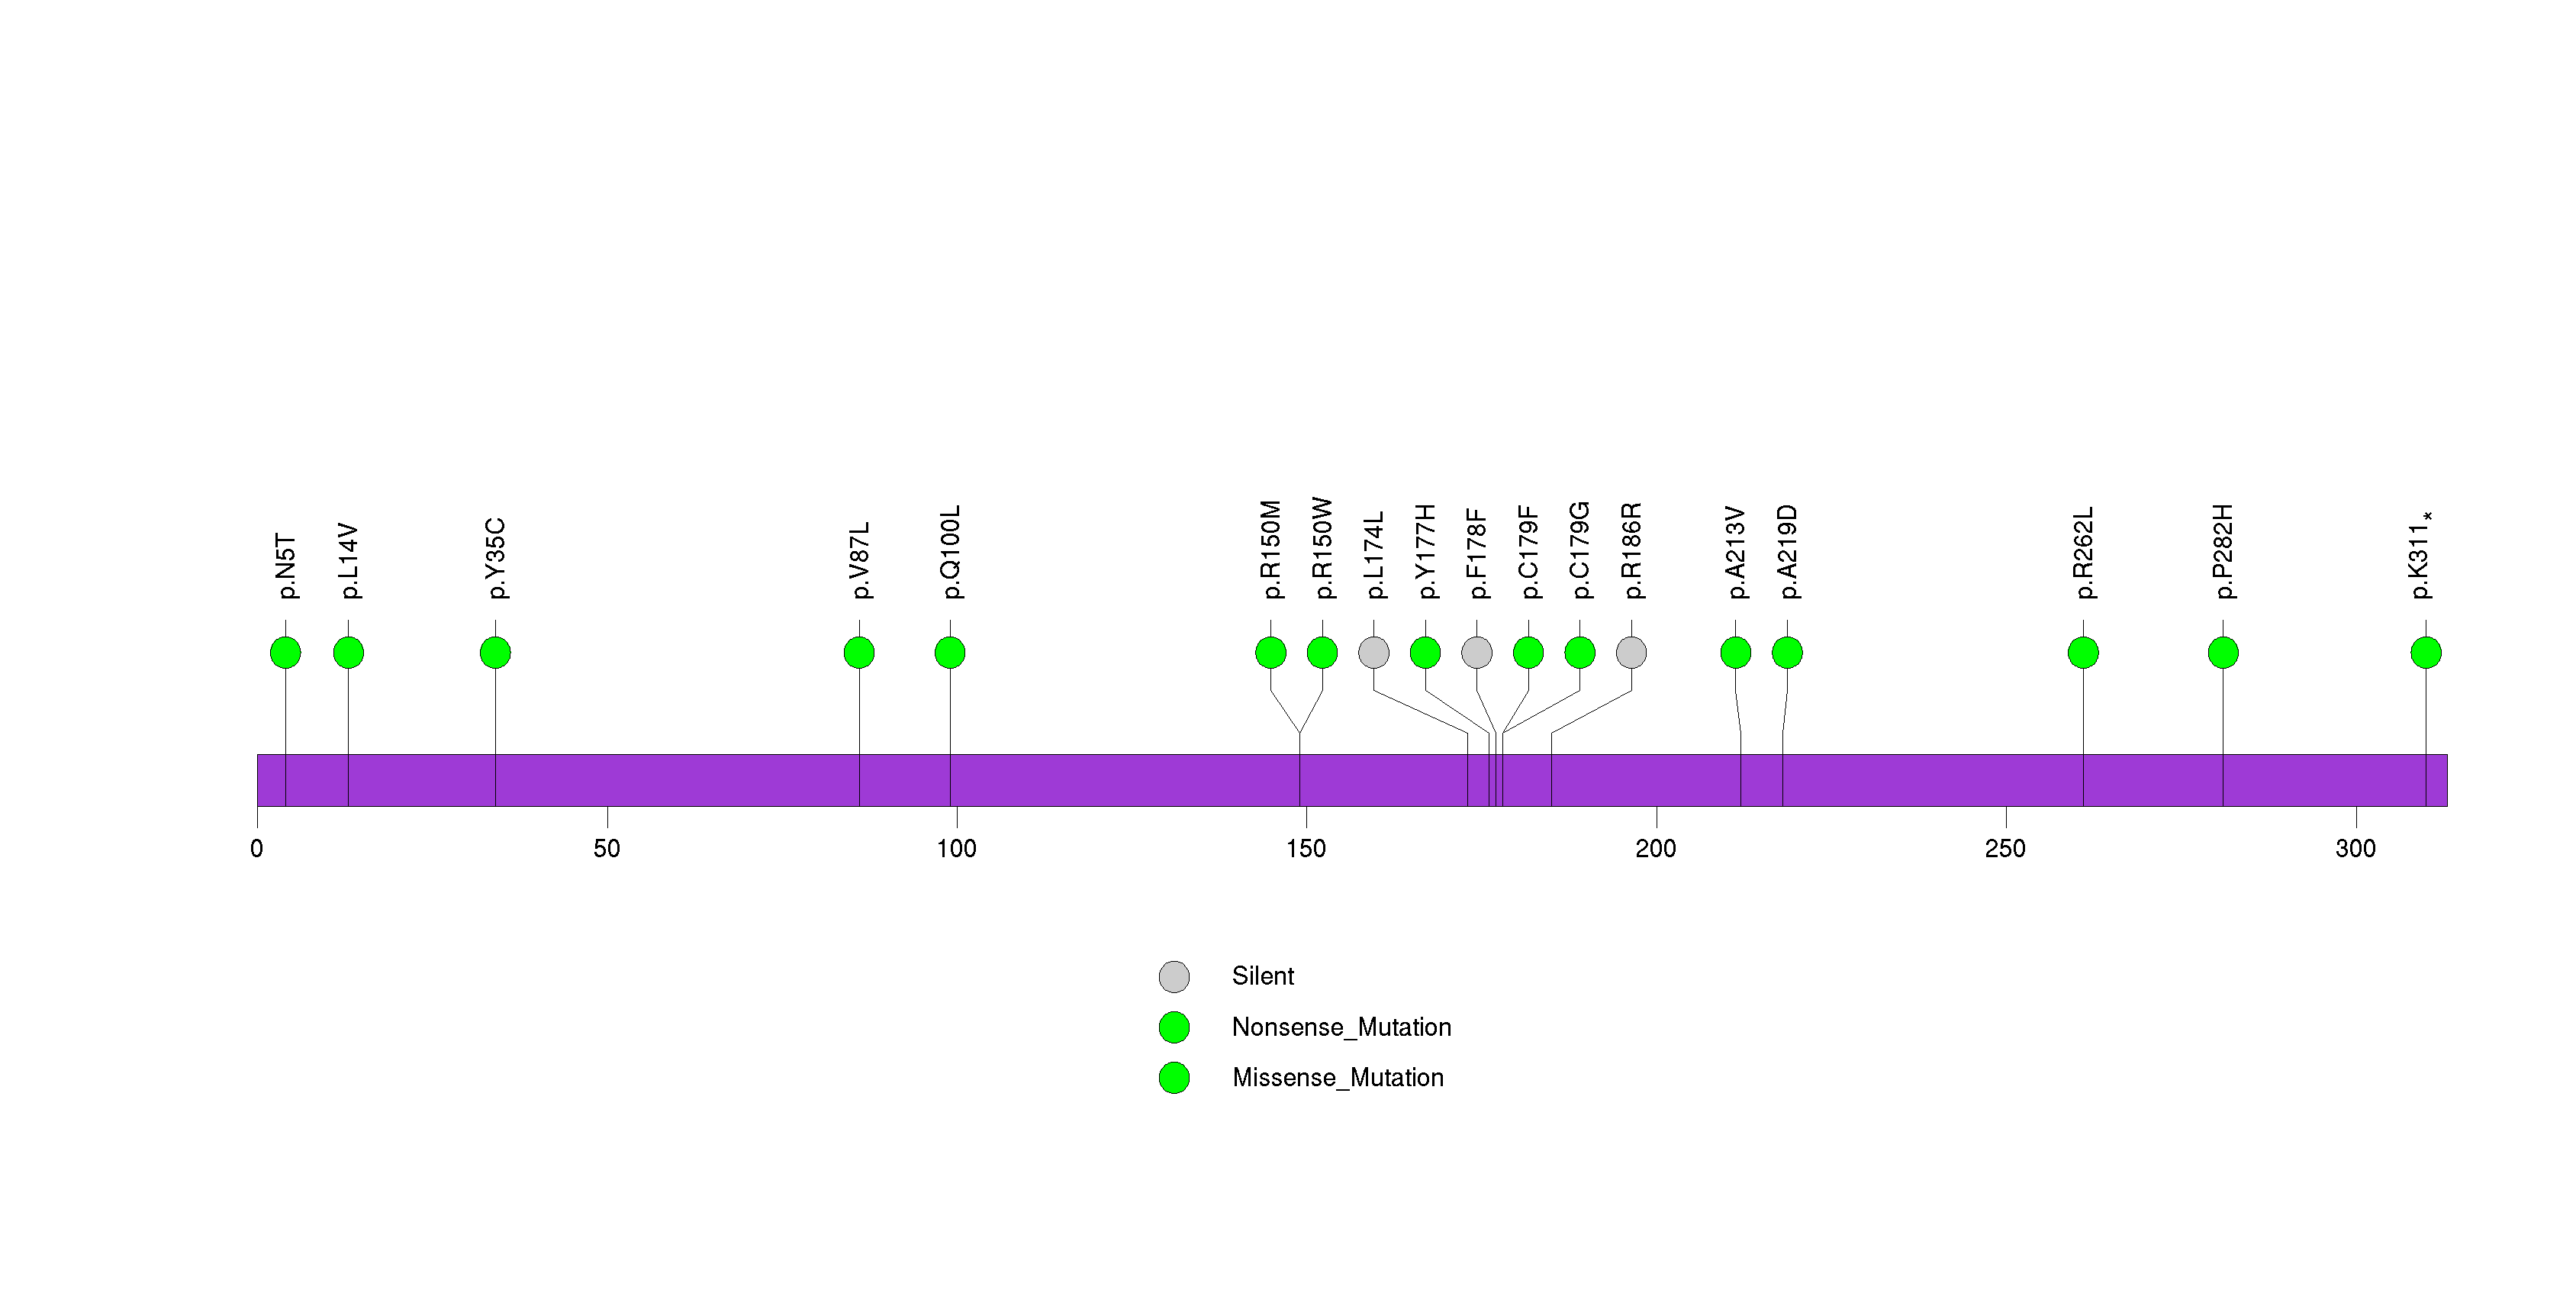
Figure S24. This figure depicts the distribution of mutations and mutation types across the PNLIPRP3 significant gene.
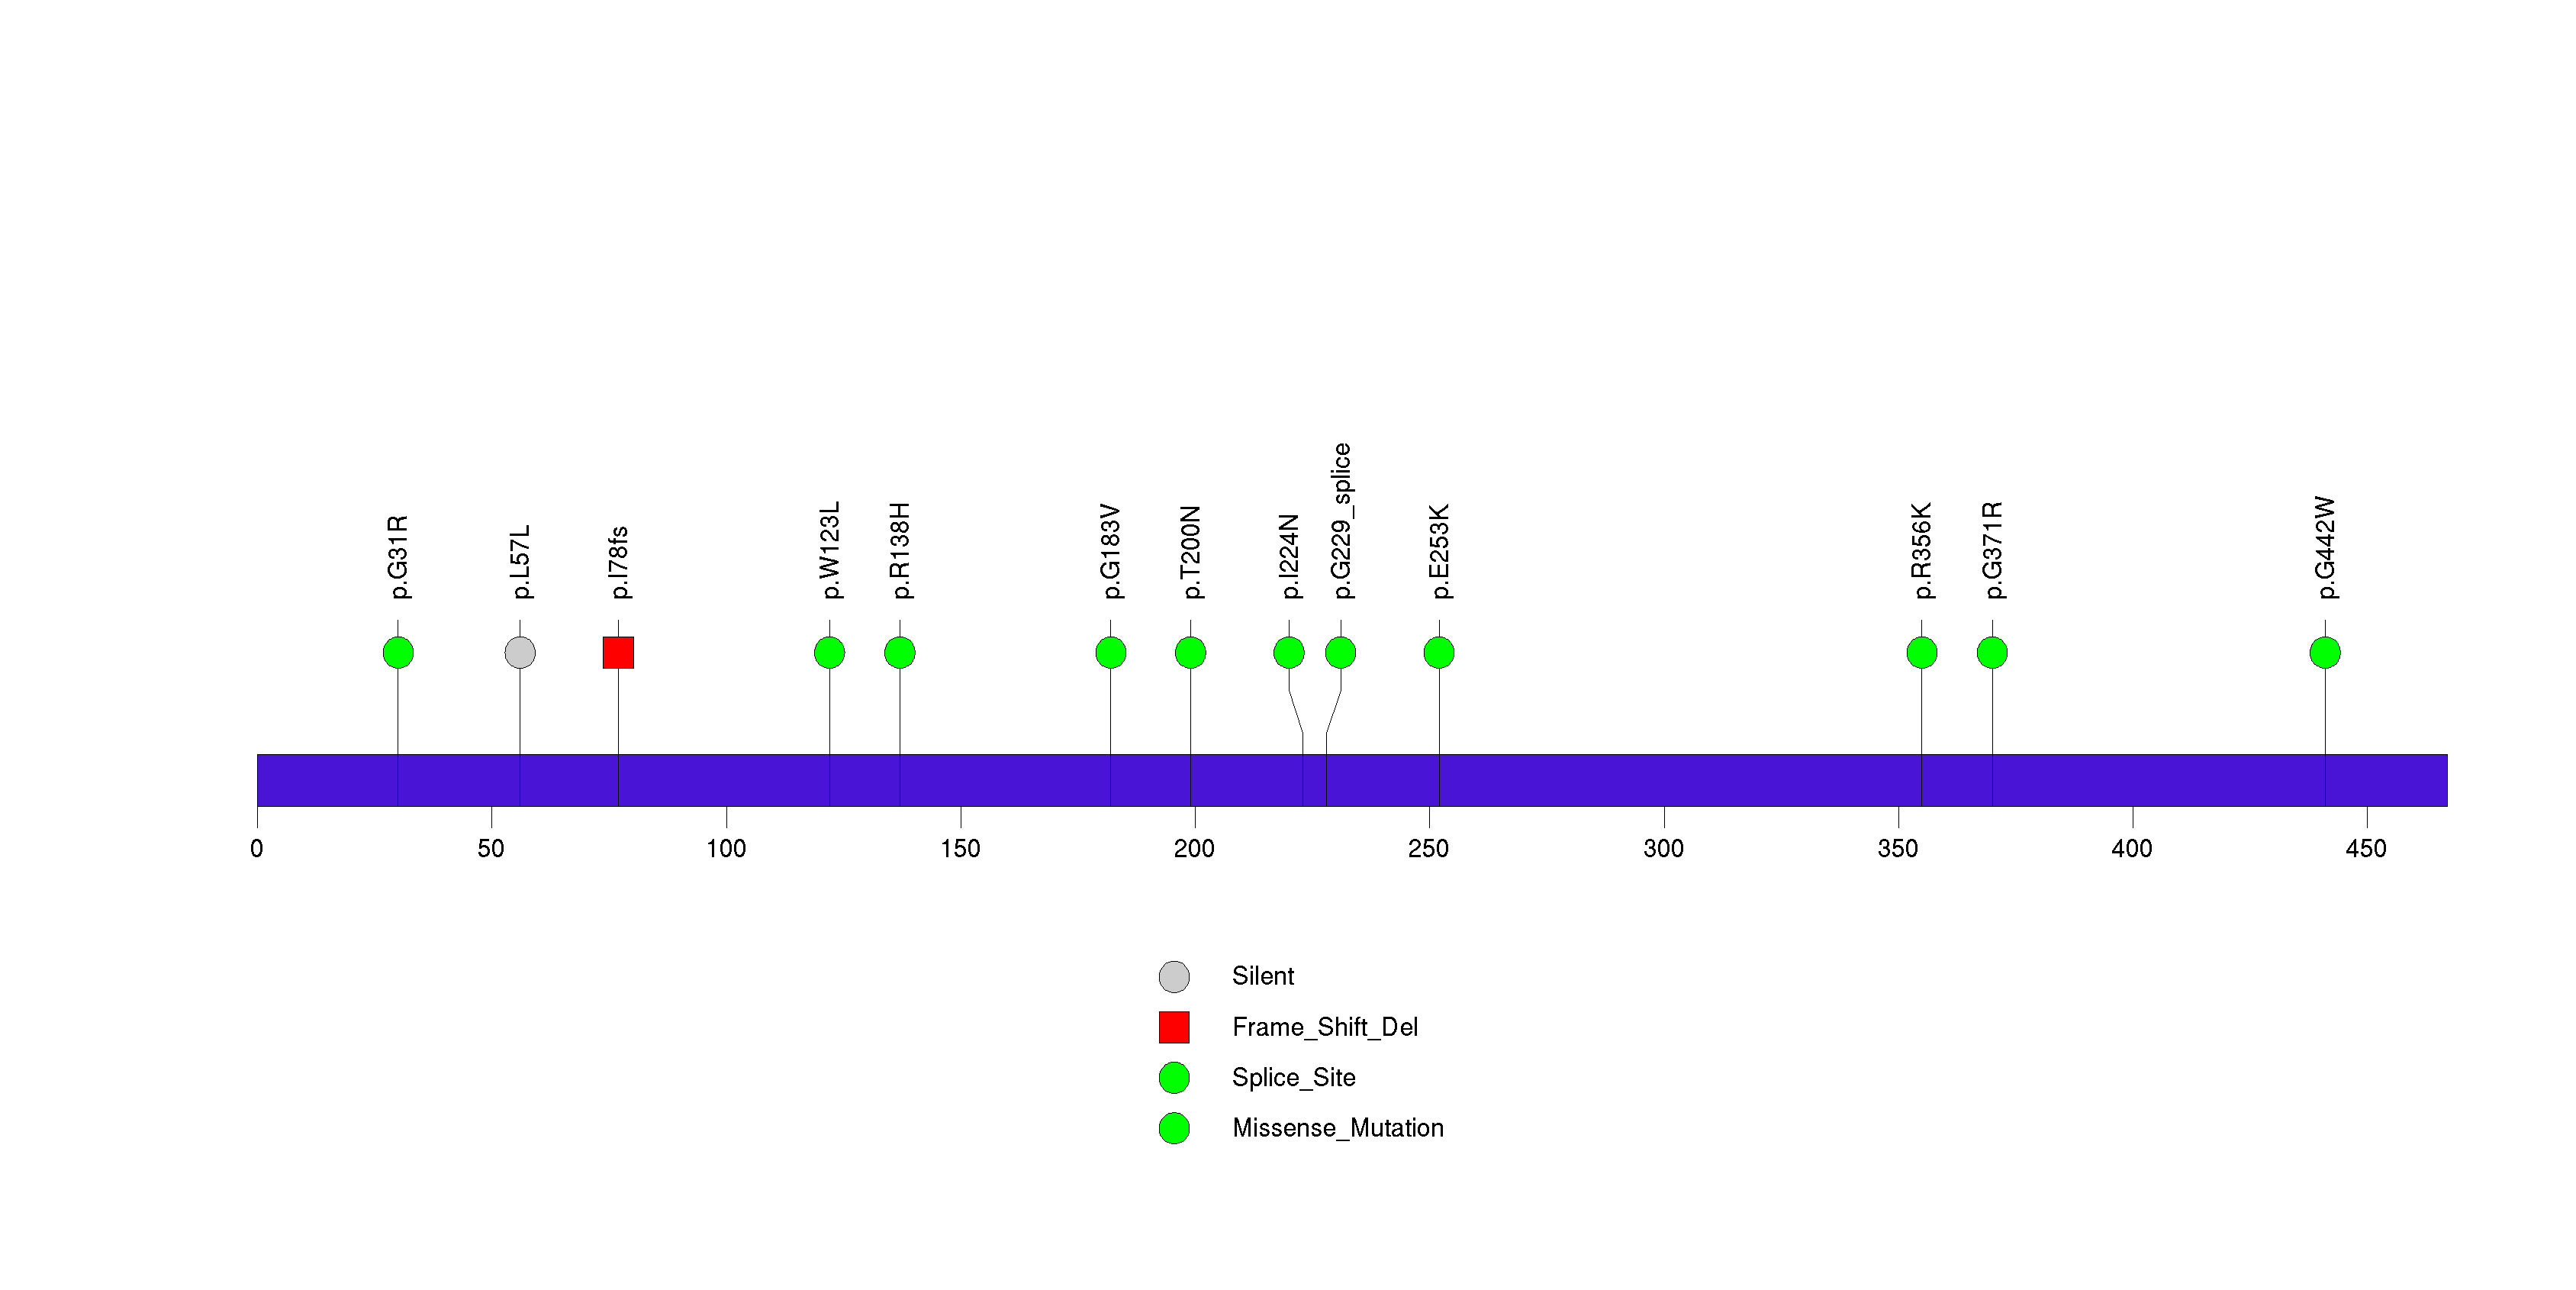
Figure S25. This figure depicts the distribution of mutations and mutation types across the CFHR4 significant gene.
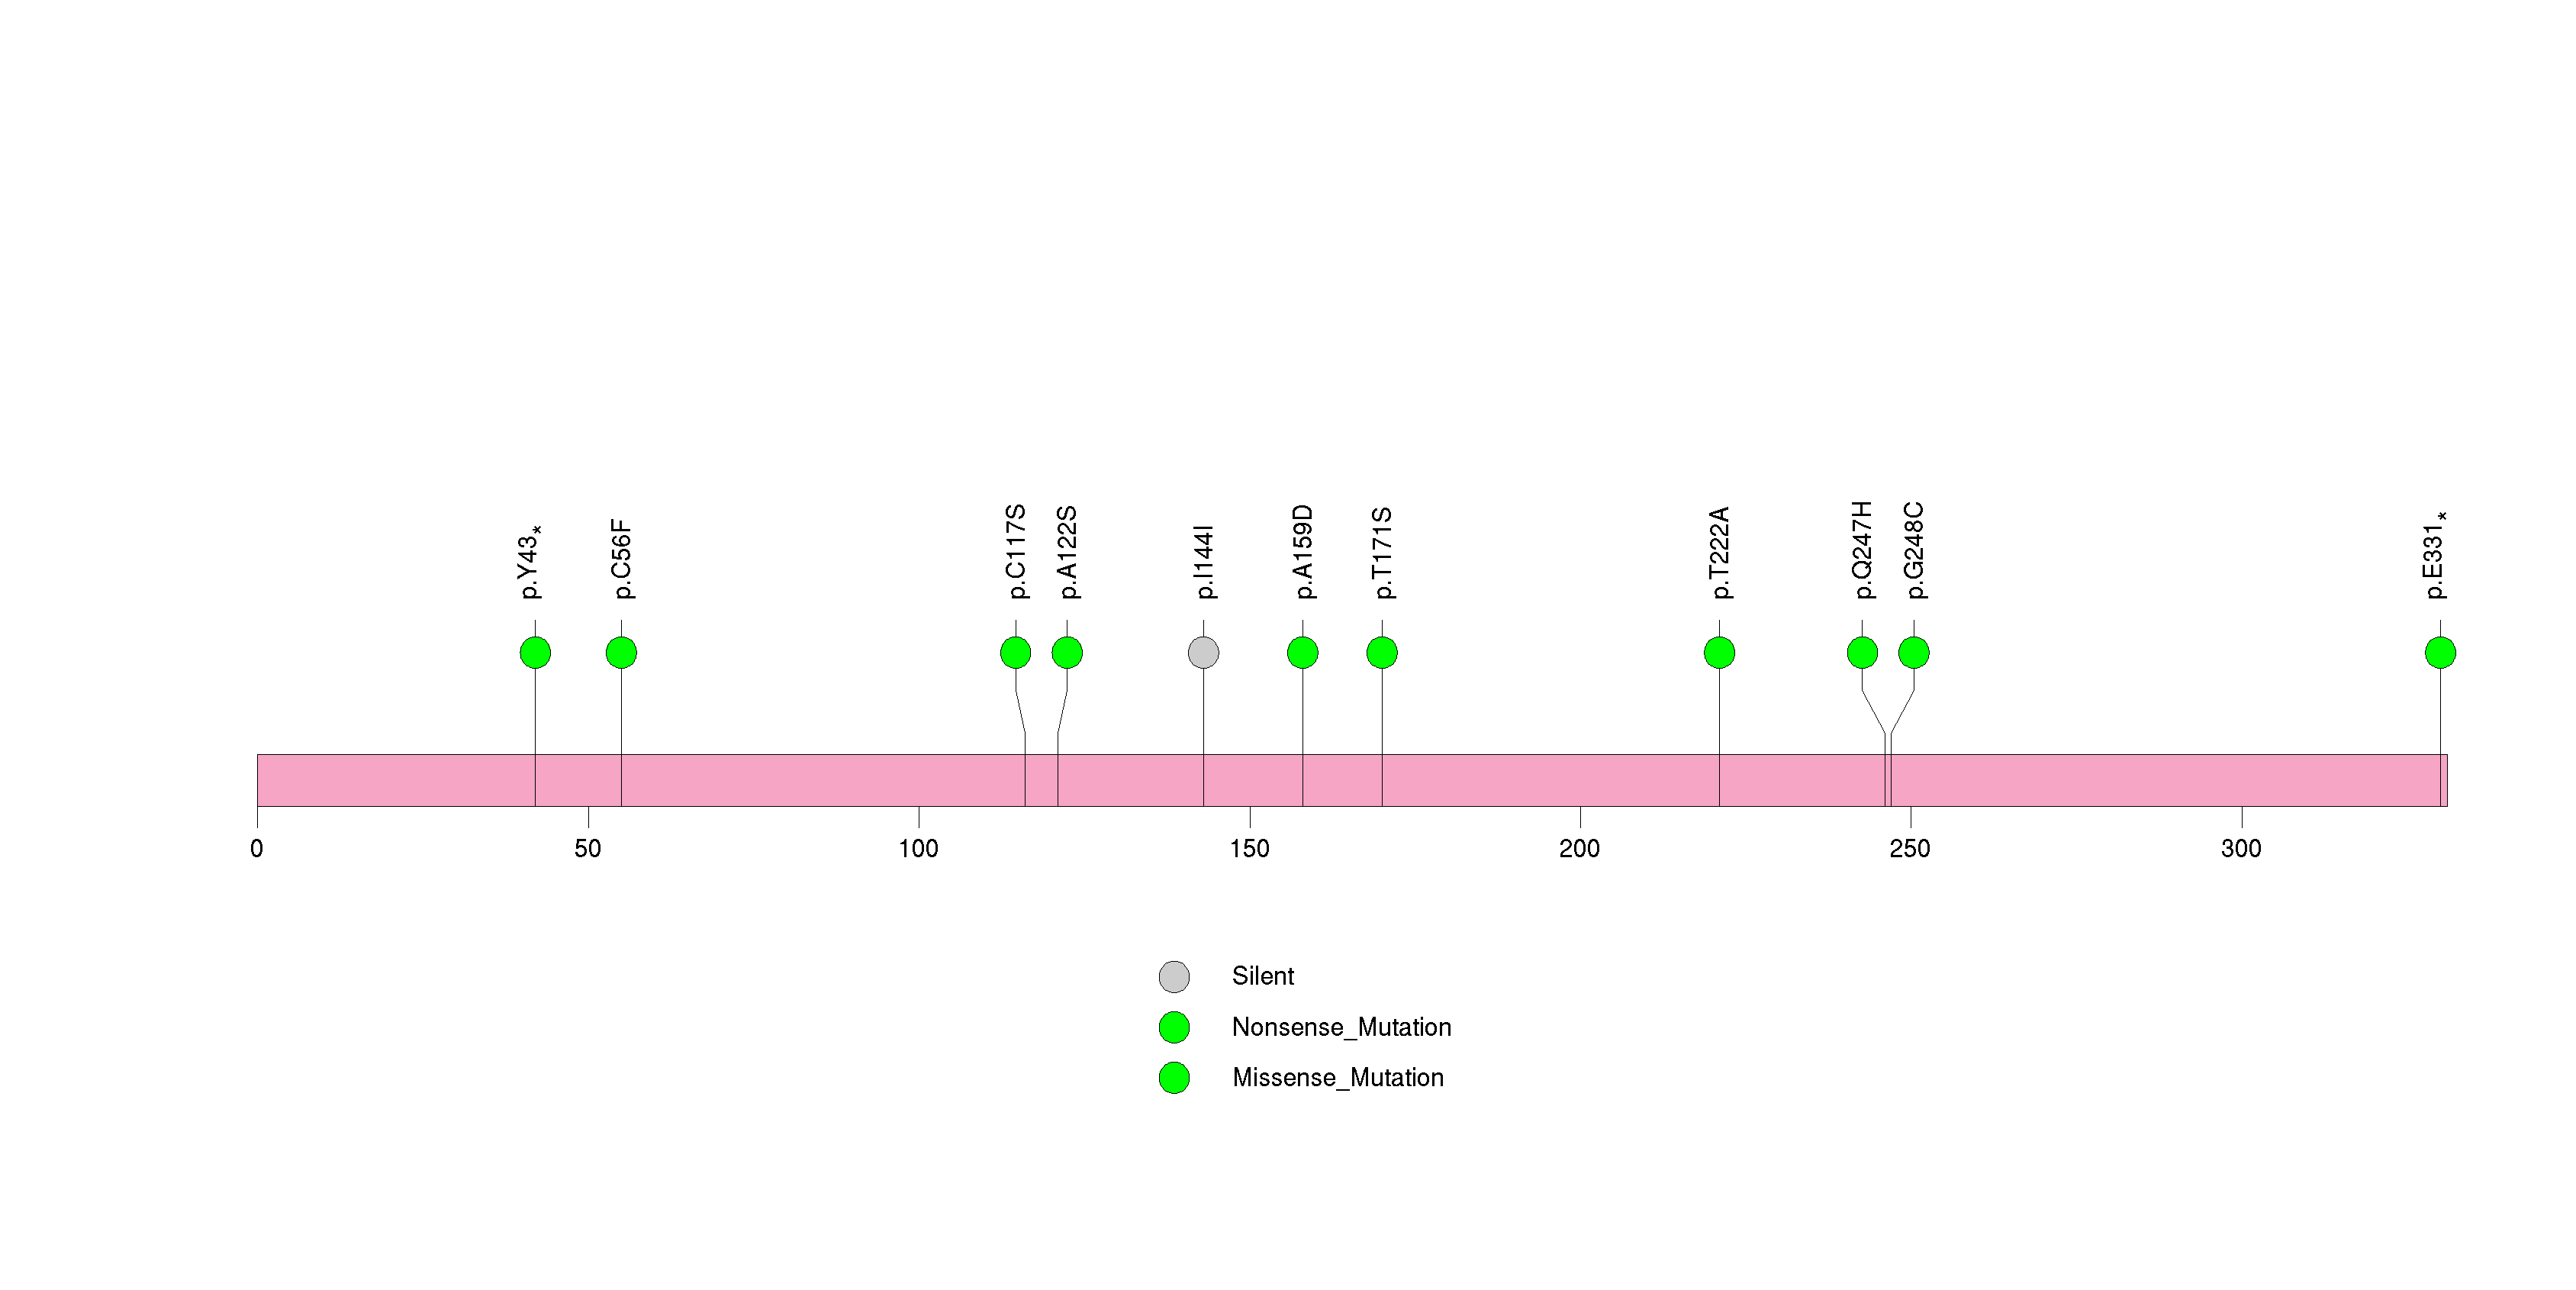
Figure S26. This figure depicts the distribution of mutations and mutation types across the ELTD1 significant gene.
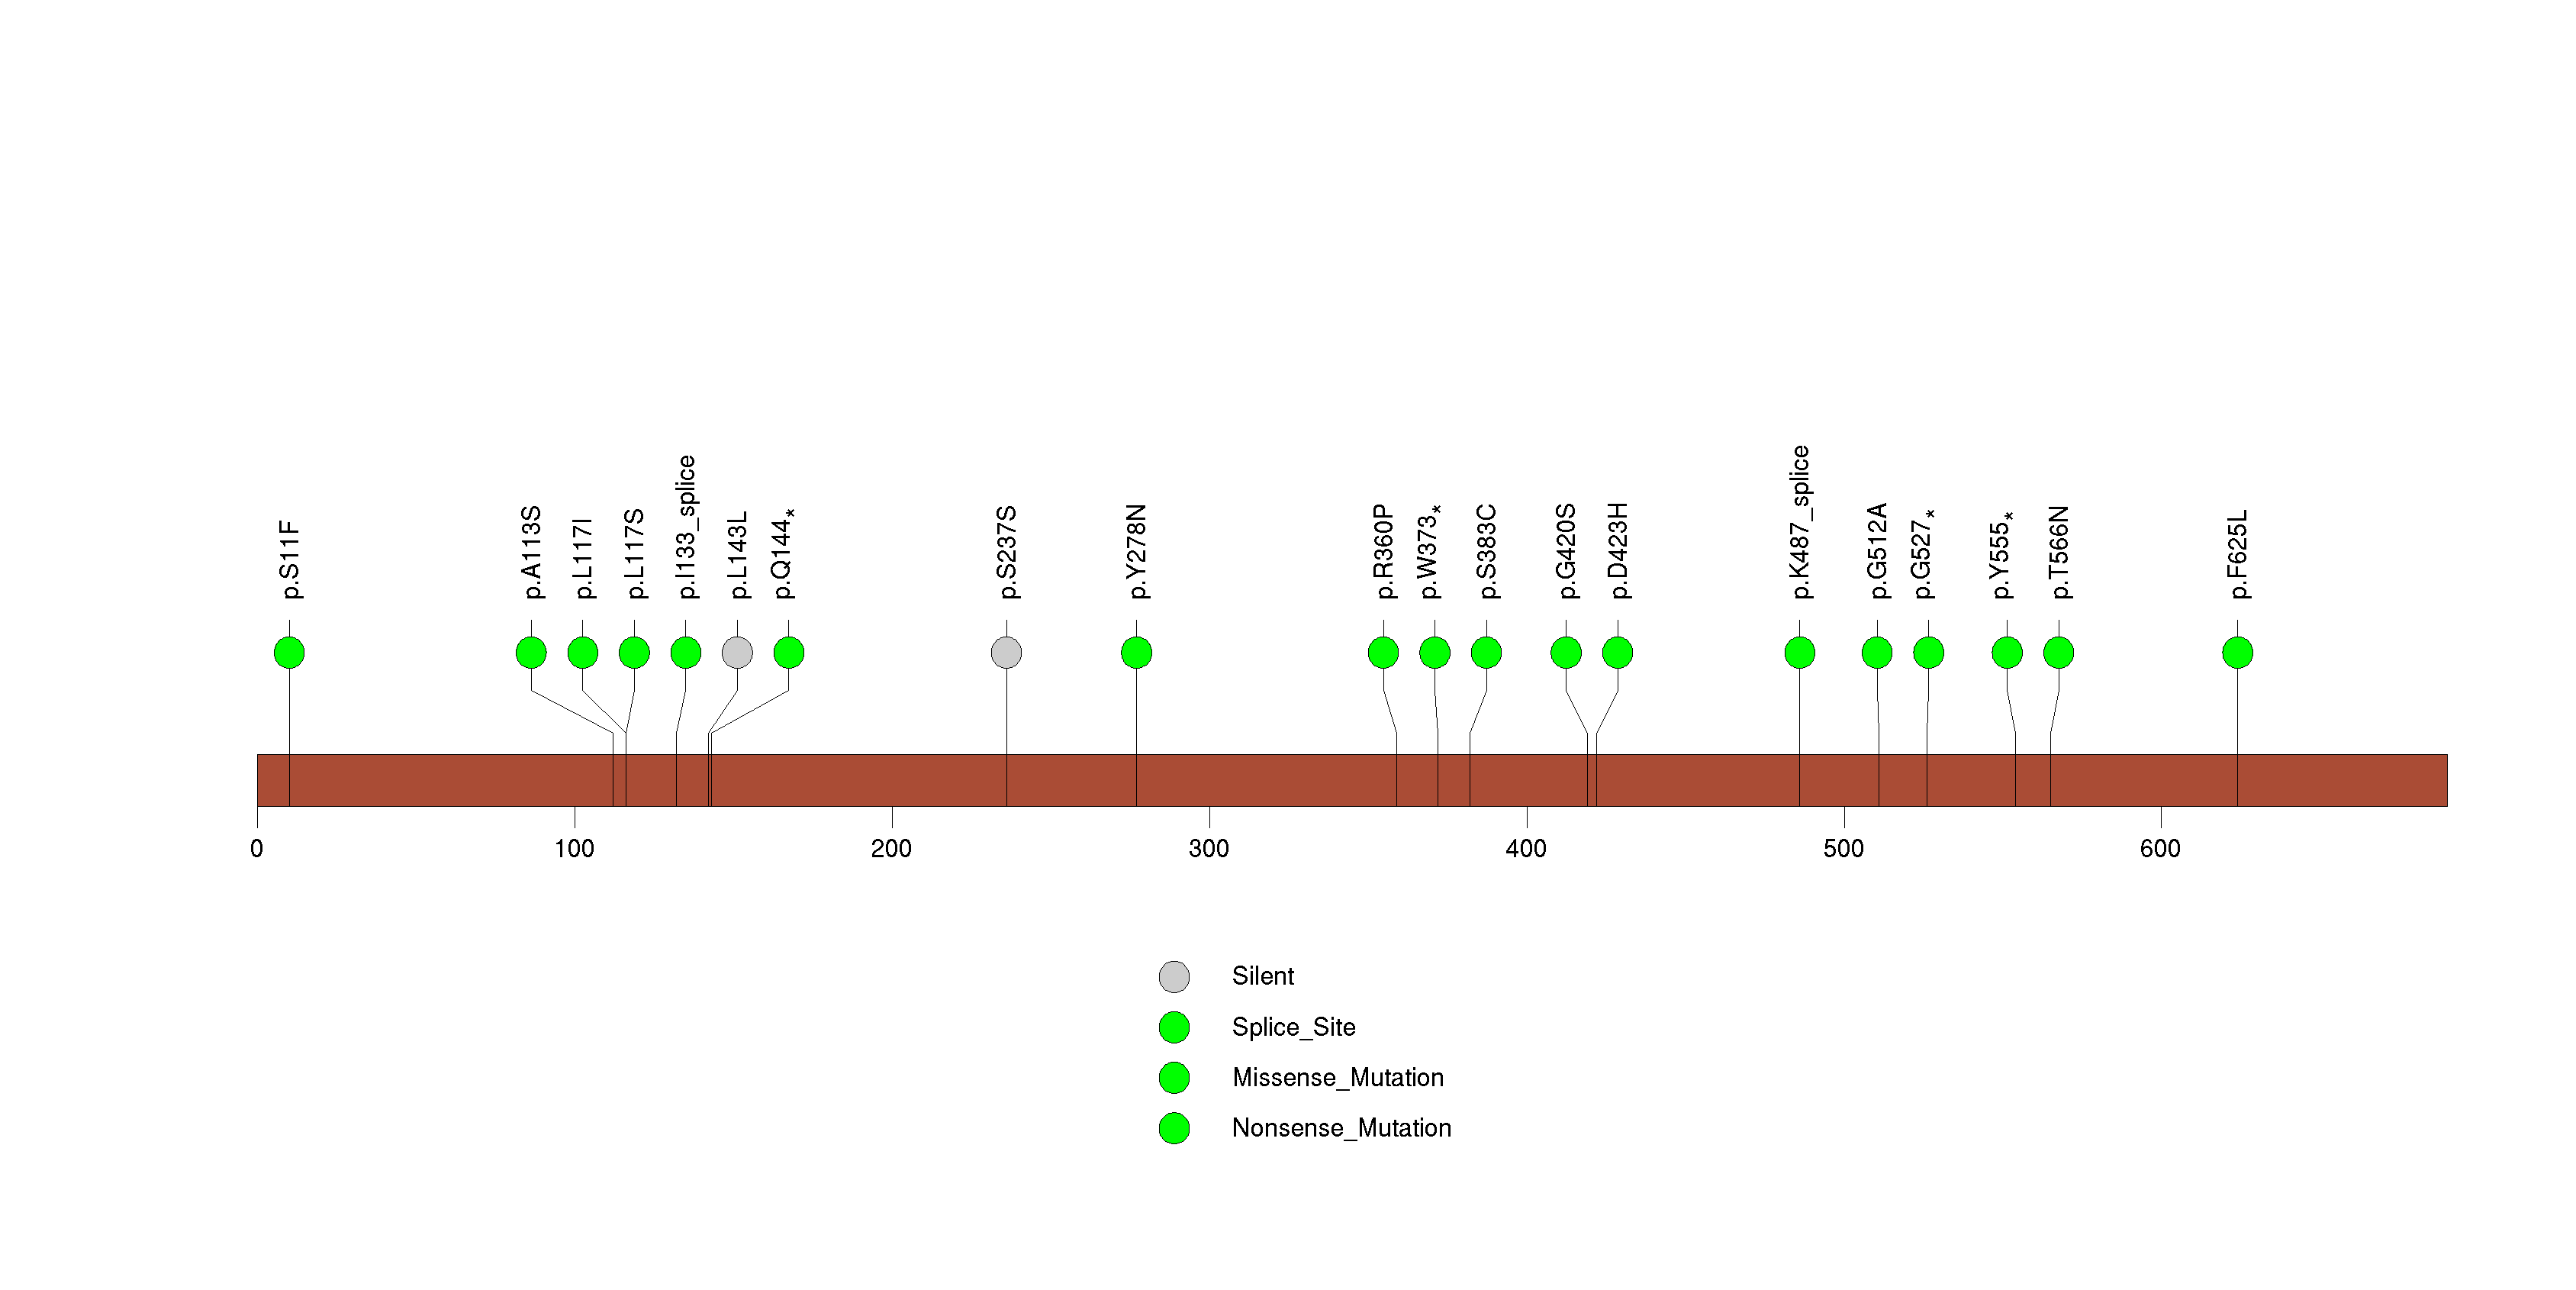
Figure S27. This figure depicts the distribution of mutations and mutation types across the OR51B2 significant gene.
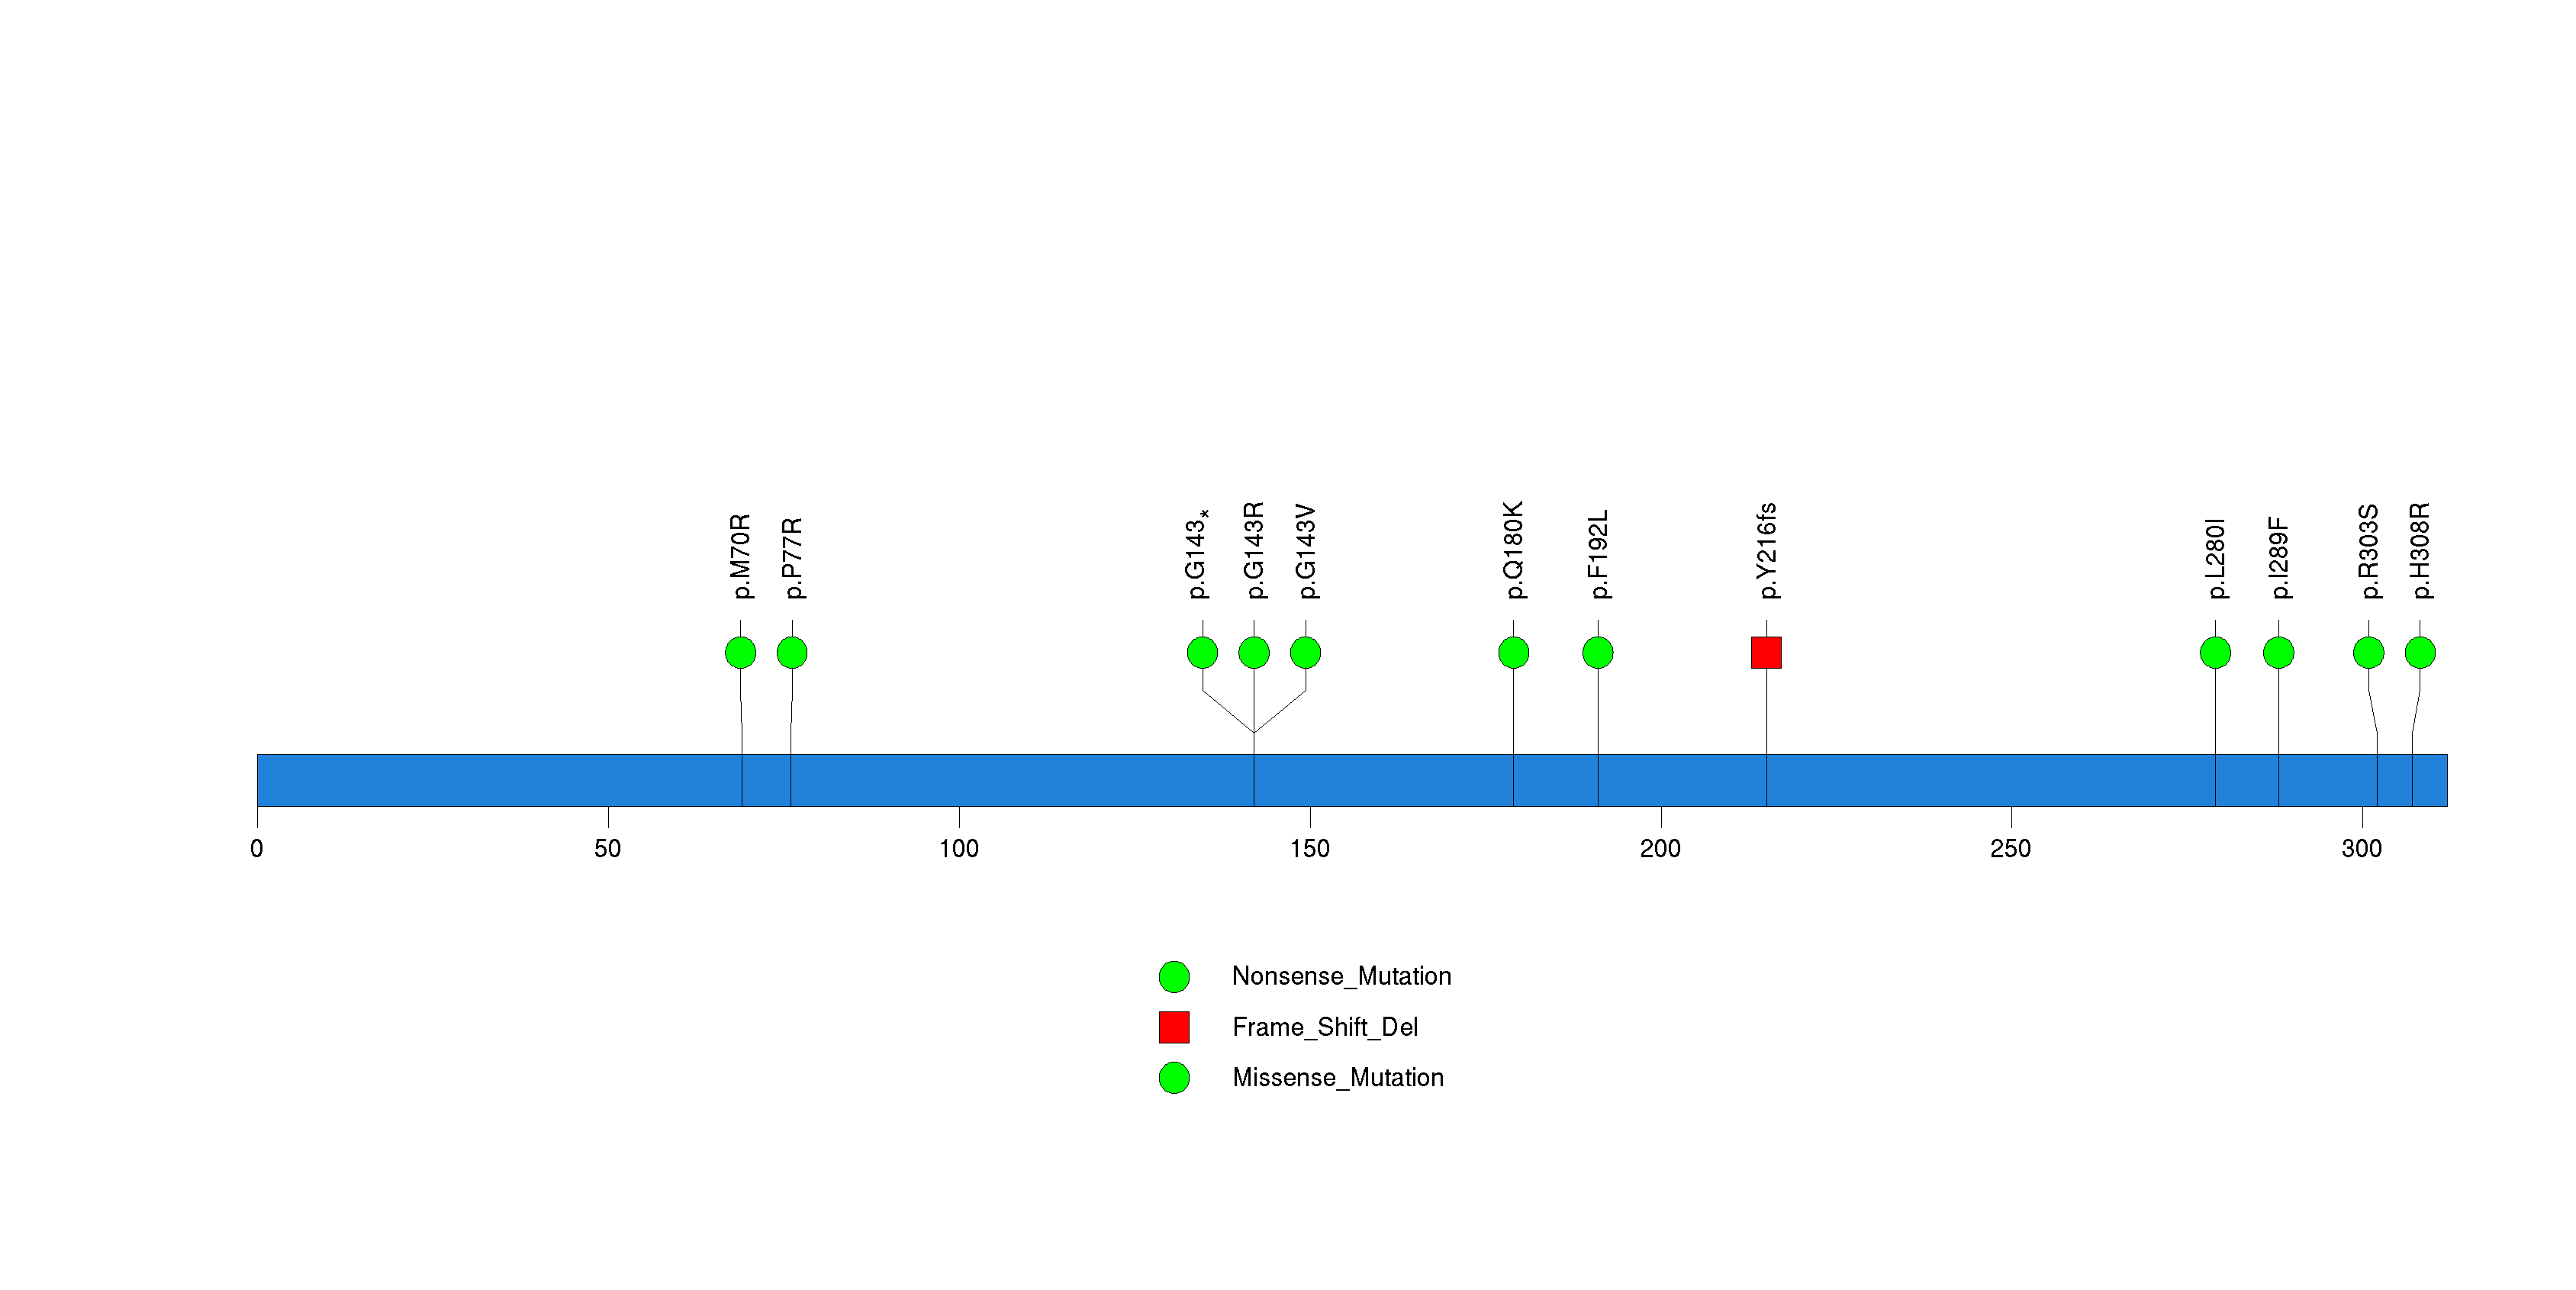
Figure S28. This figure depicts the distribution of mutations and mutation types across the TGIF2LX significant gene.
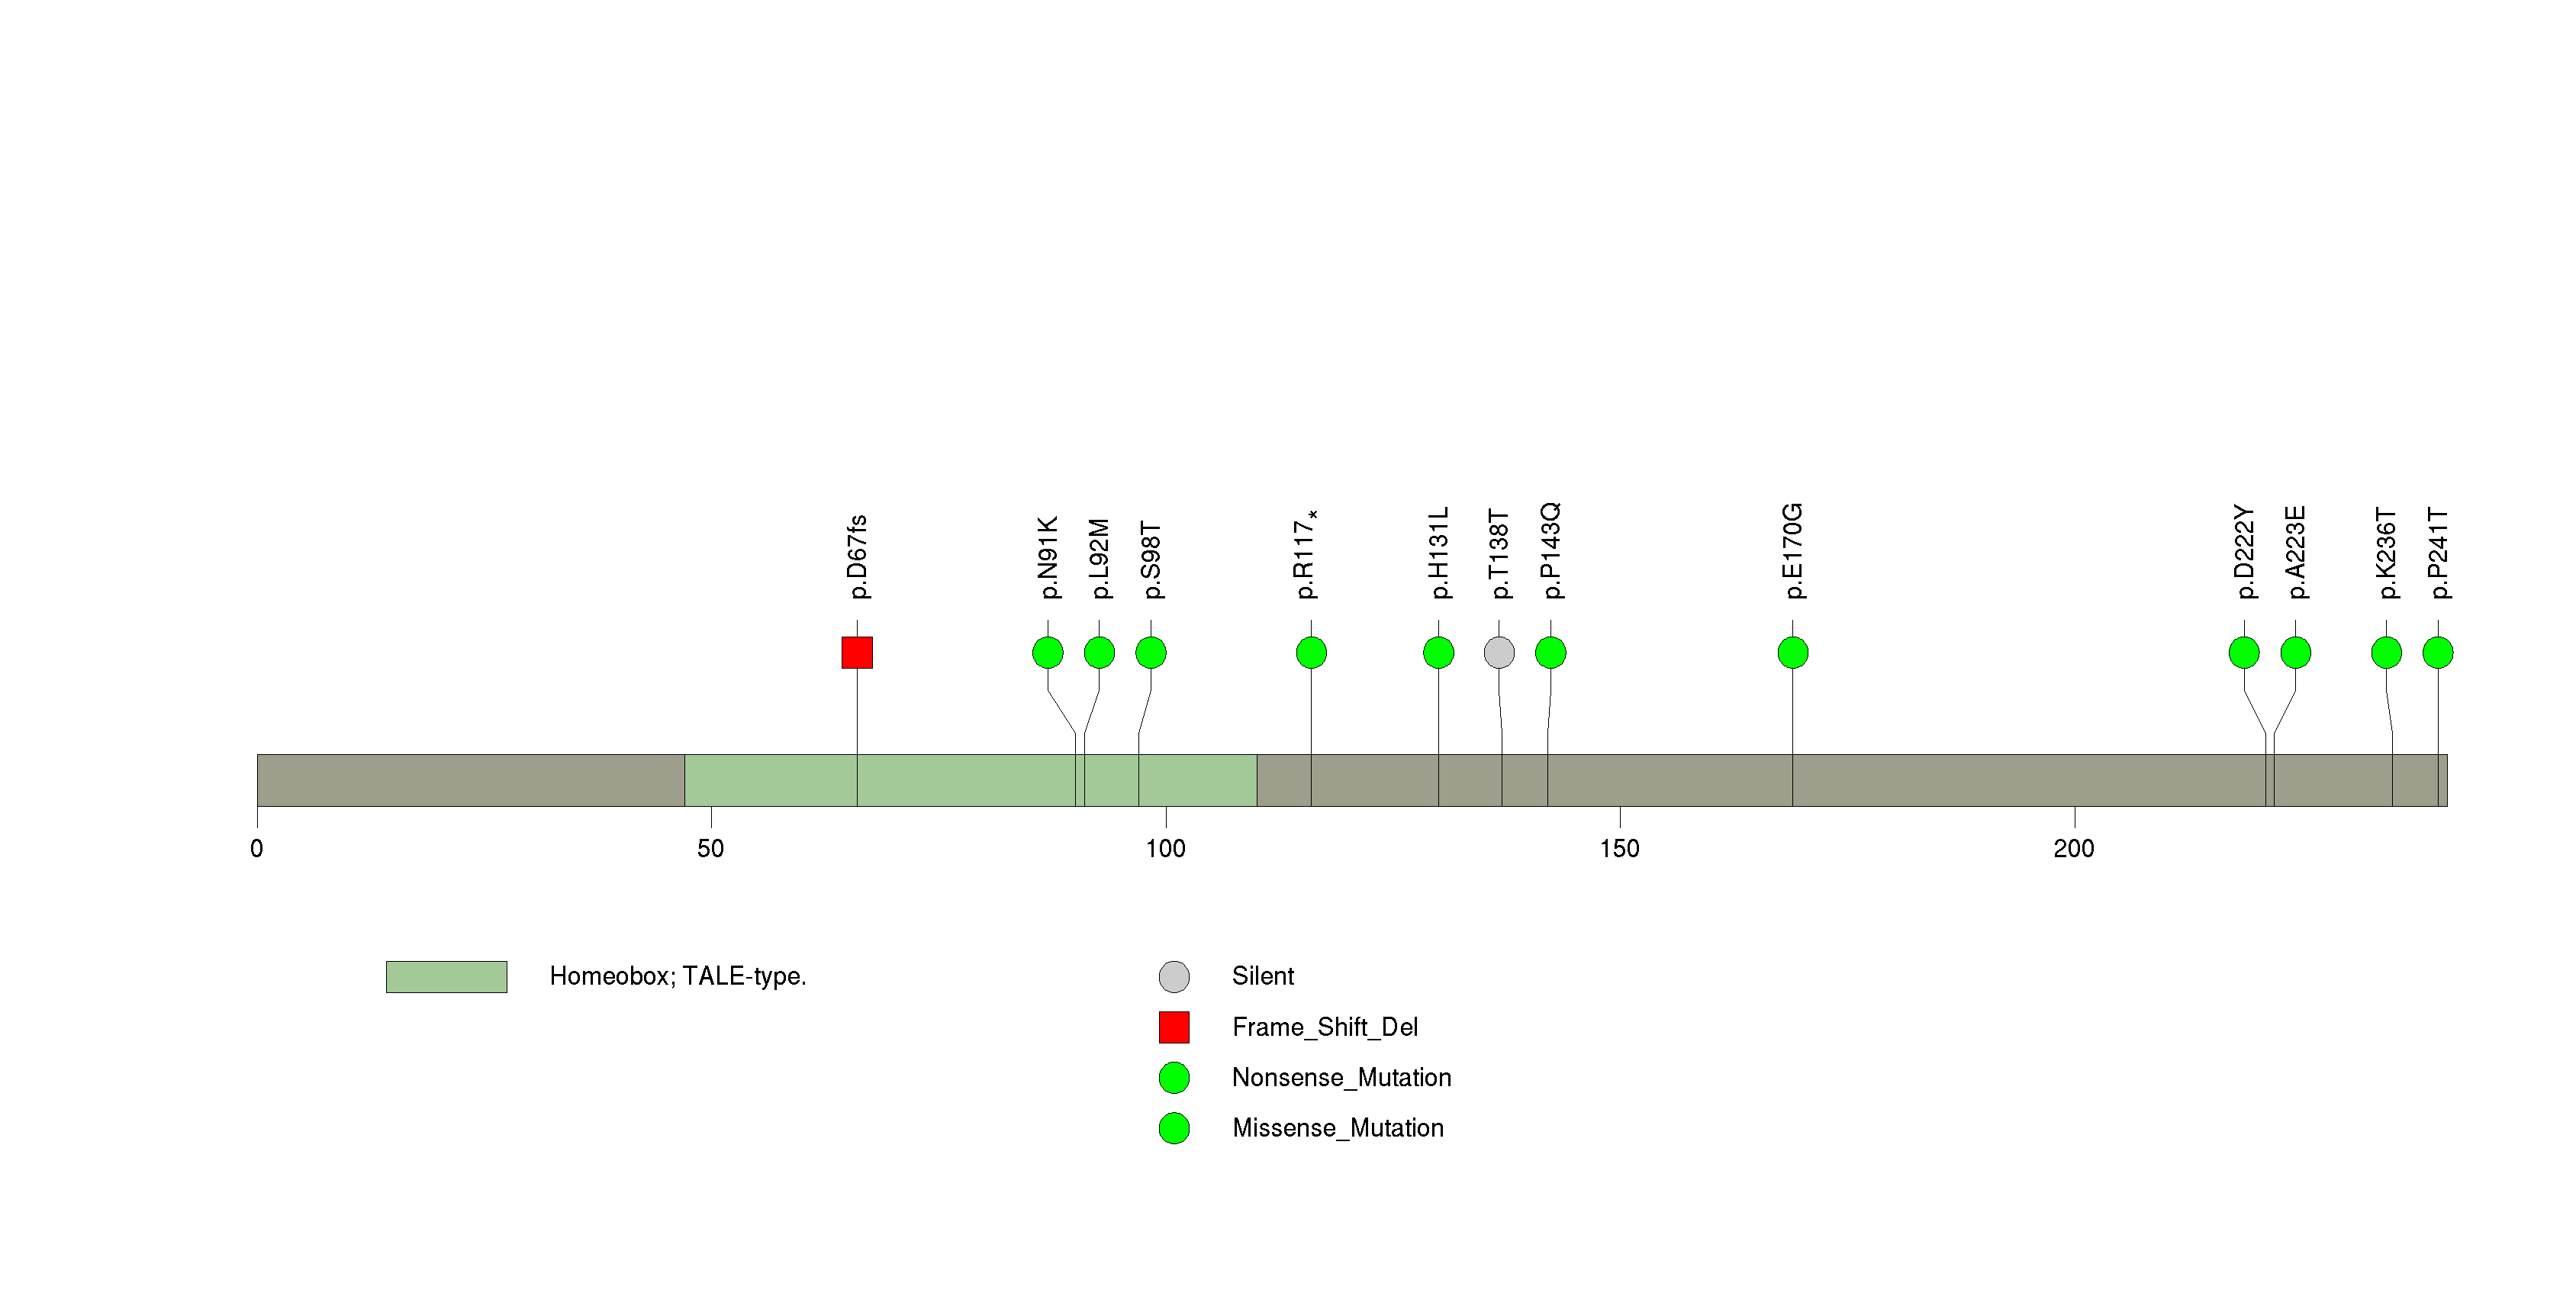
Figure S29. This figure depicts the distribution of mutations and mutation types across the ESRRG significant gene.
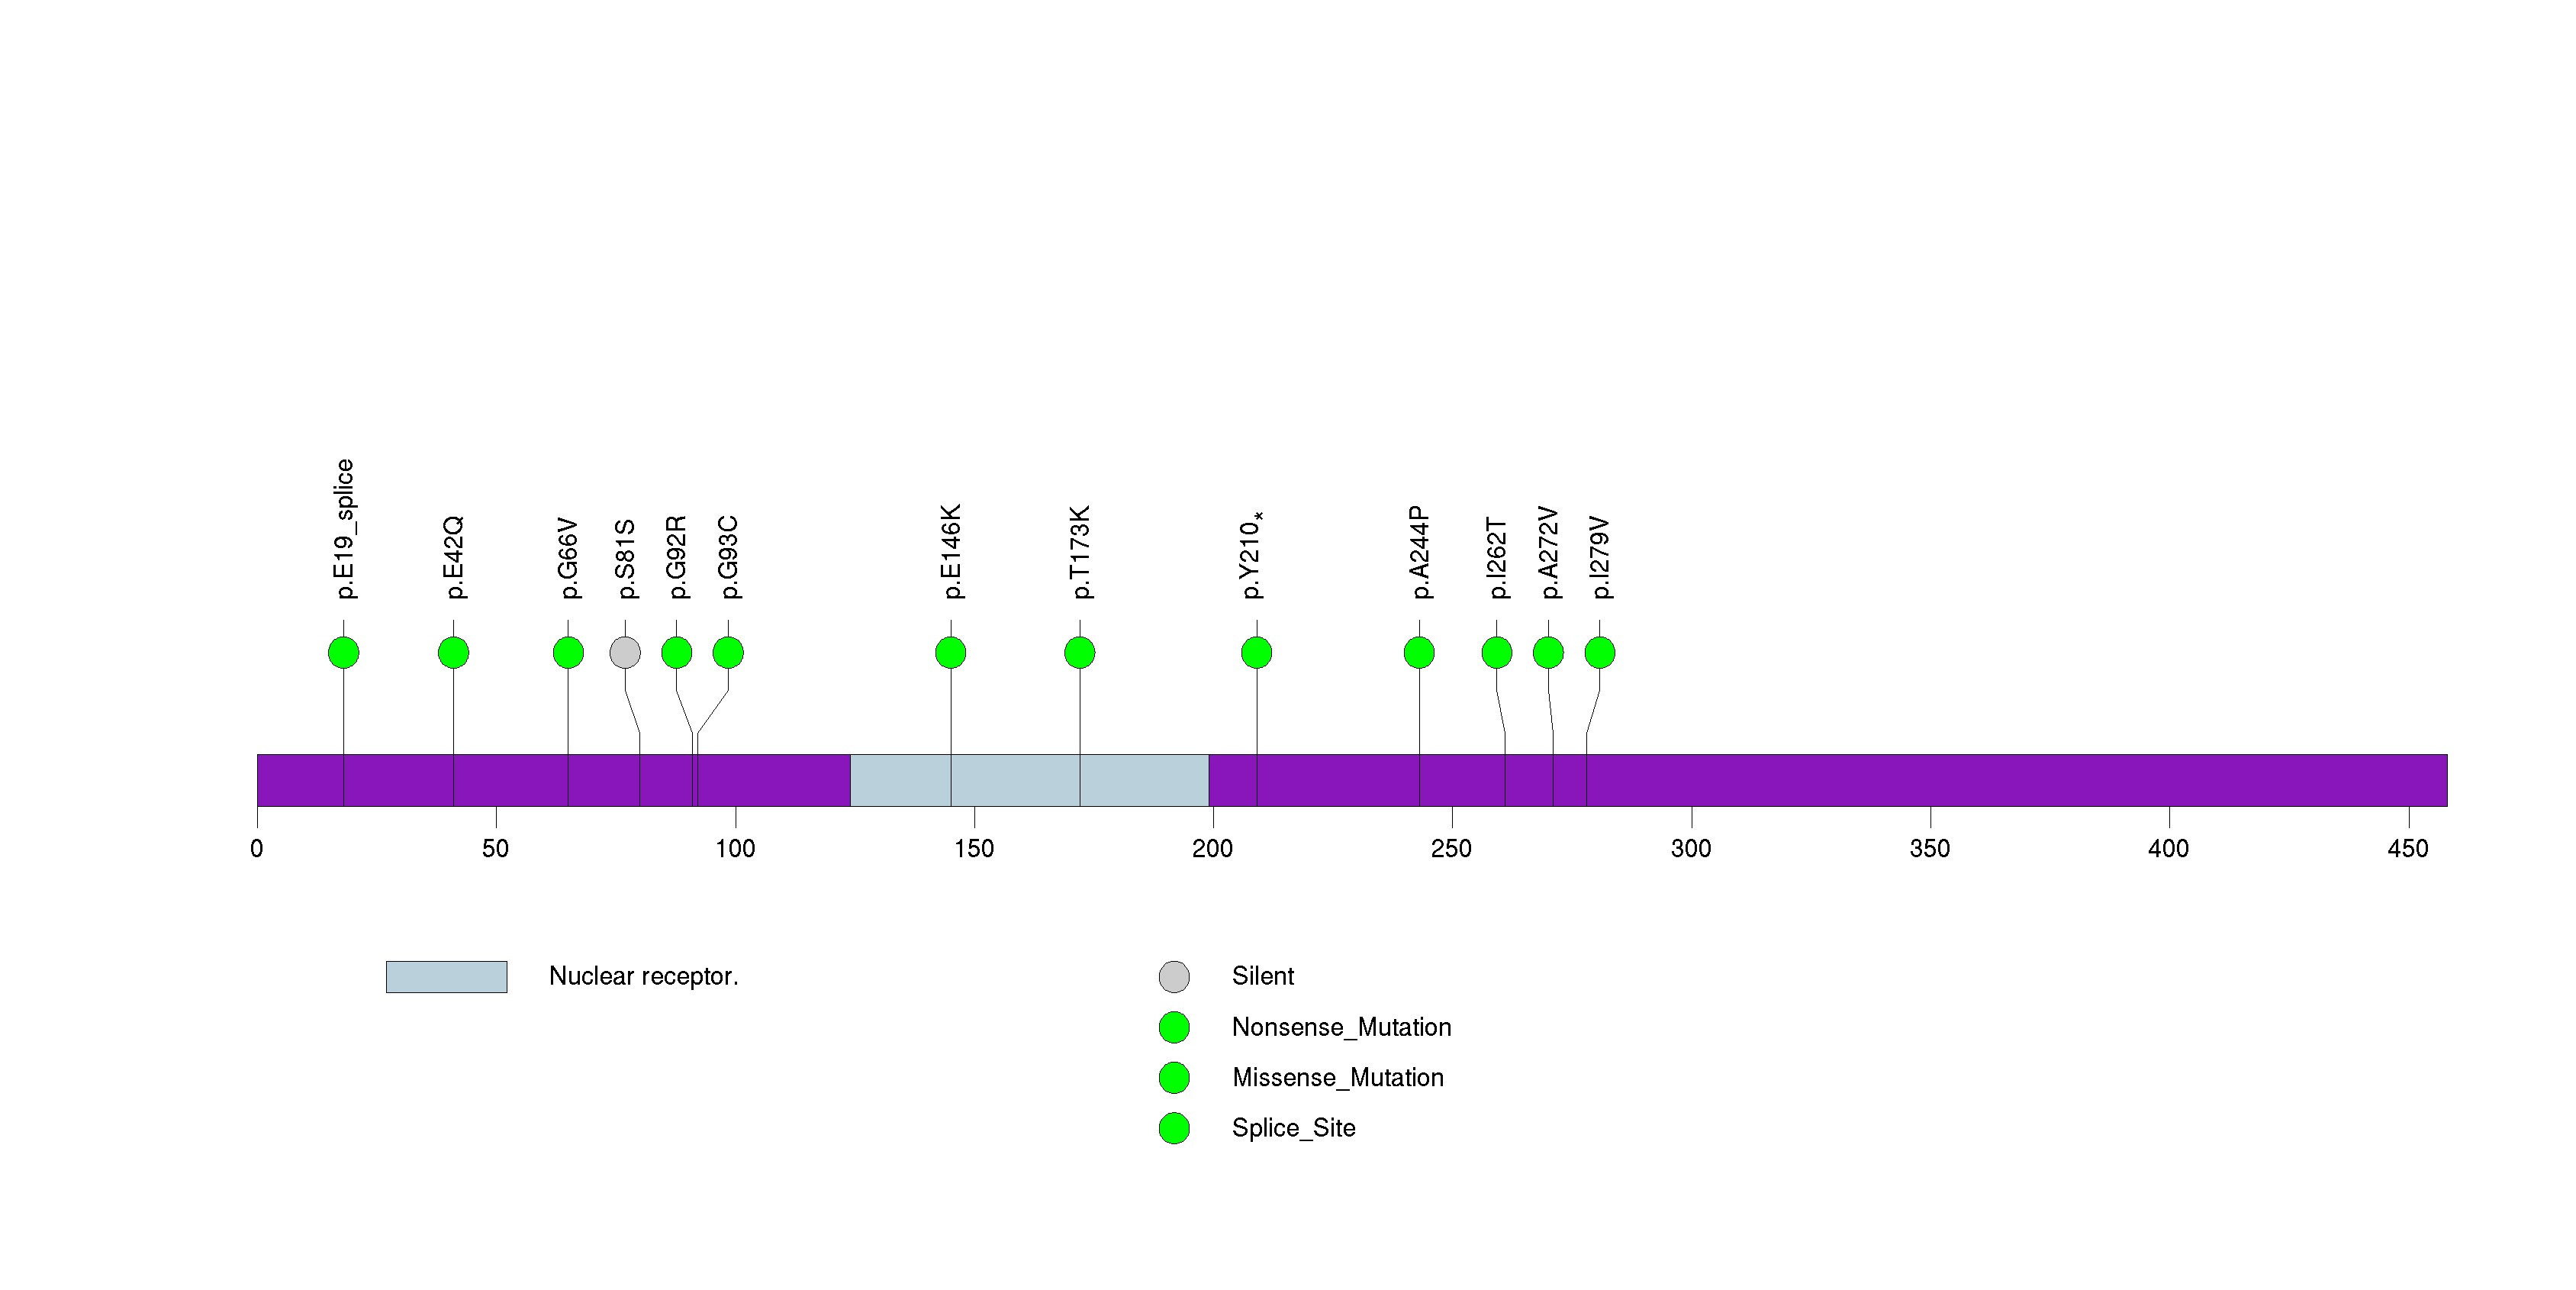
Figure S30. This figure depicts the distribution of mutations and mutation types across the REG3A significant gene.
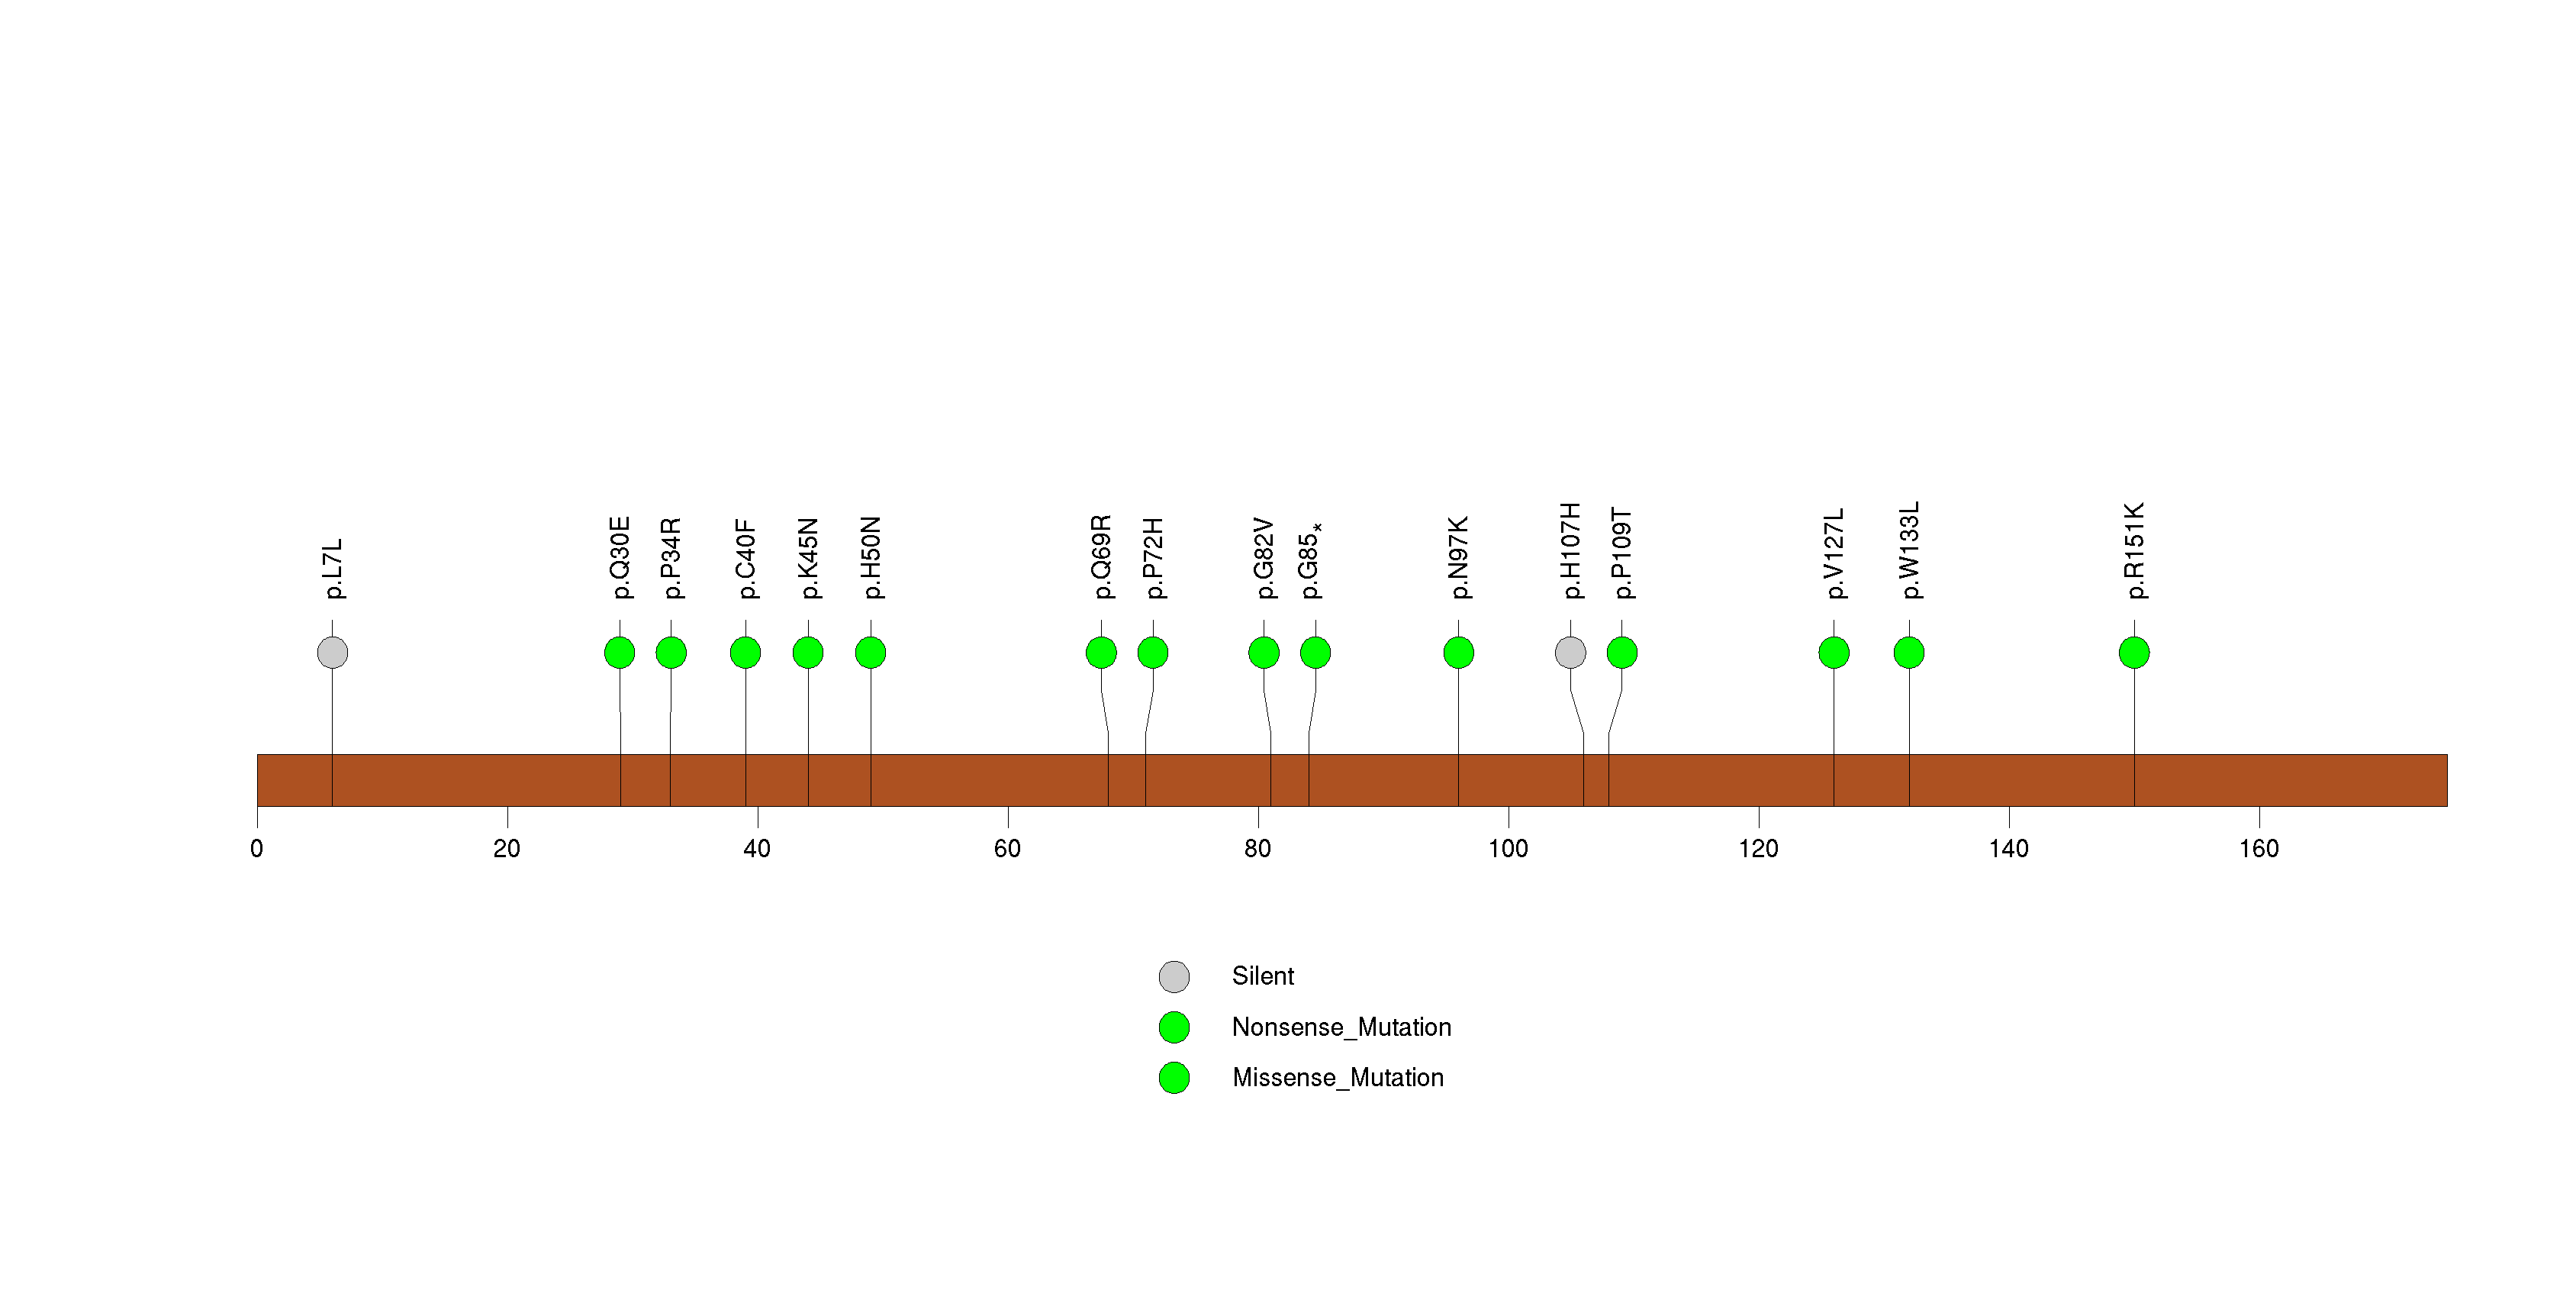
Figure S31. This figure depicts the distribution of mutations and mutation types across the REG3G significant gene.
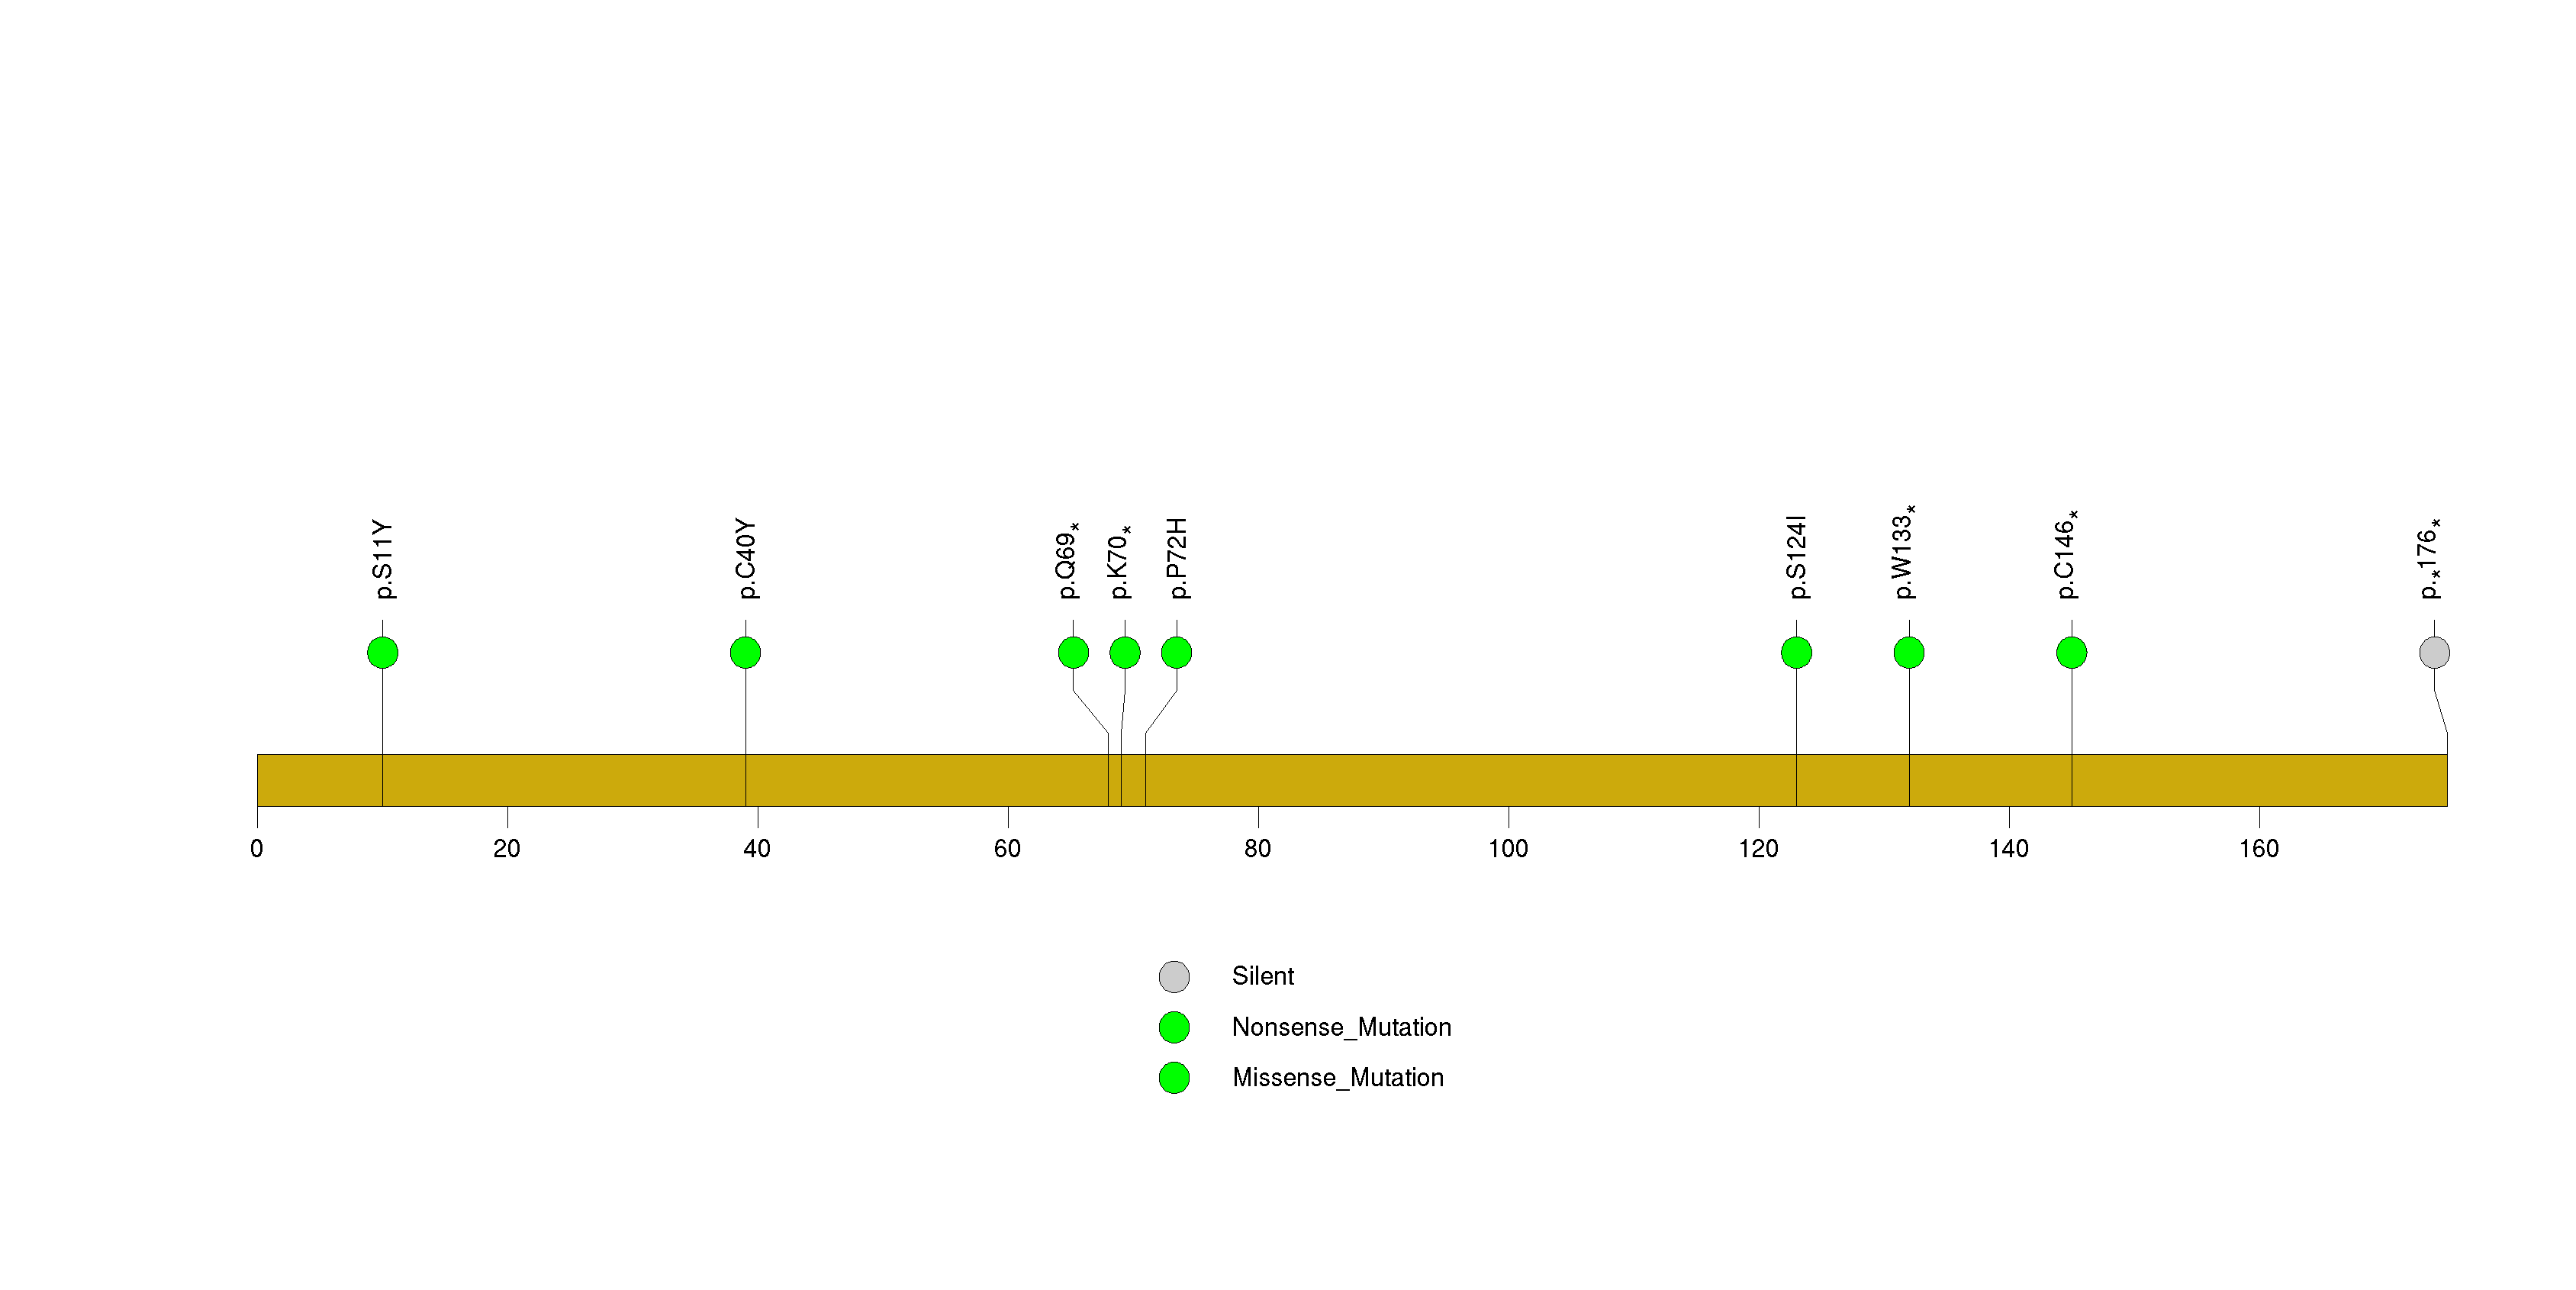
Figure S32. This figure depicts the distribution of mutations and mutation types across the OR4M1 significant gene.
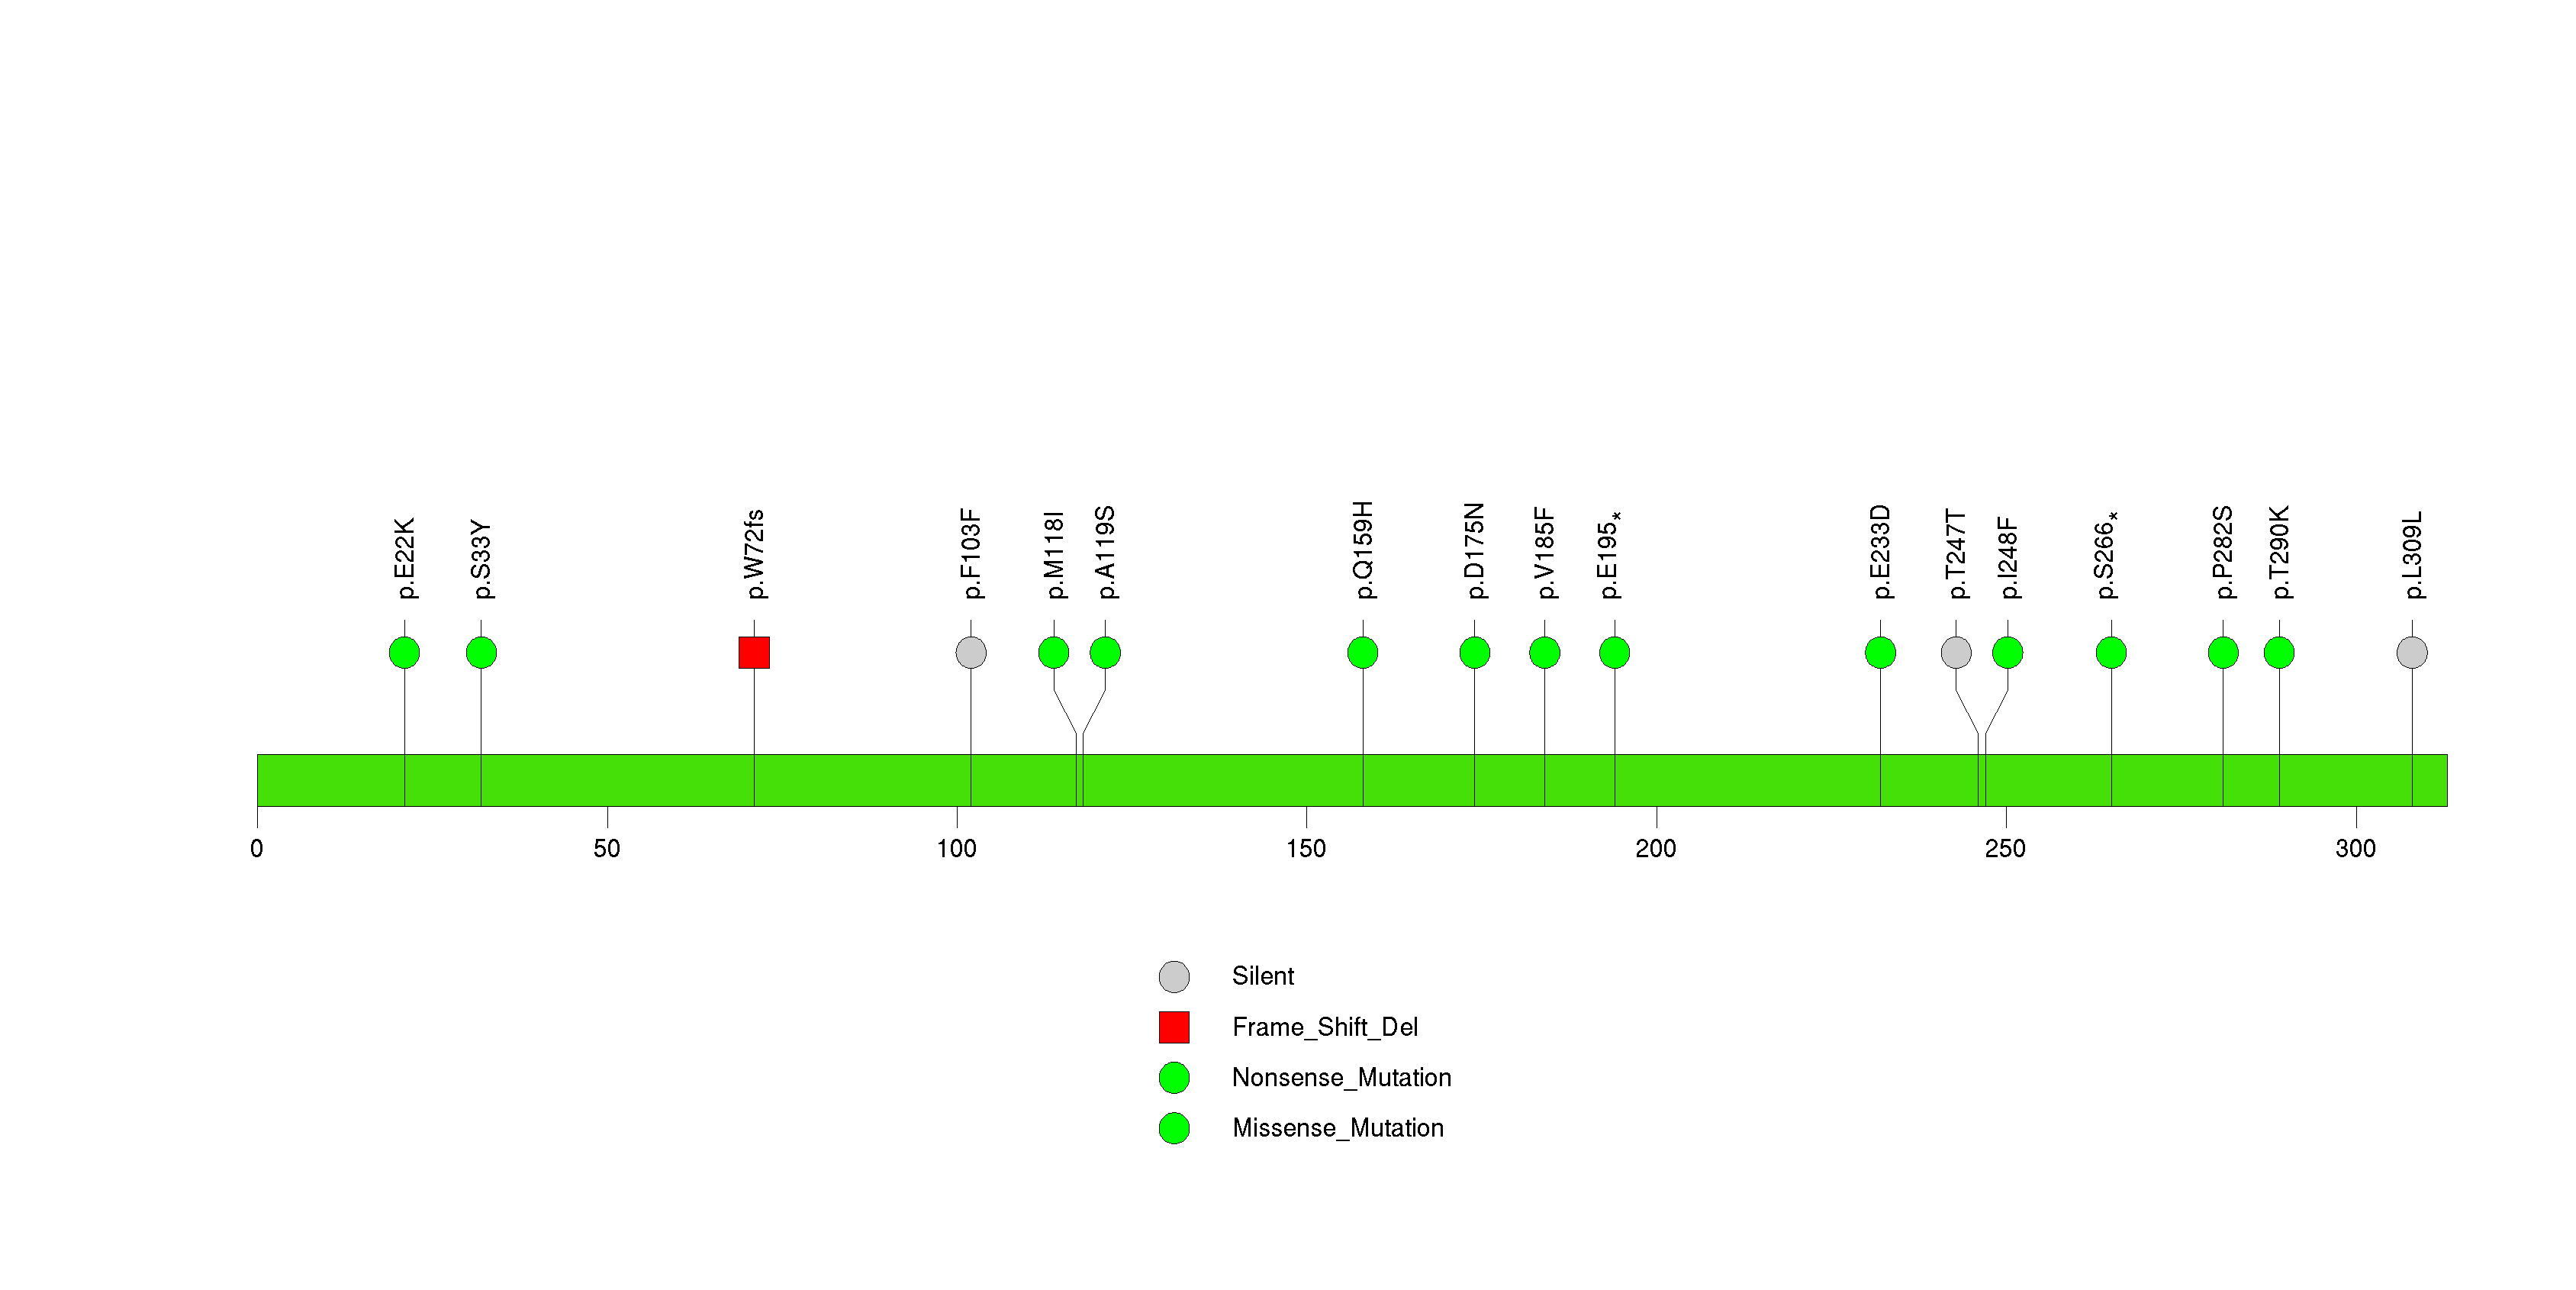
Figure S33. This figure depicts the distribution of mutations and mutation types across the OR2G6 significant gene.
In this analysis, COSMIC is used as a filter to increase power by restricting the territory of each gene. Cosmic version: v48.
Table 4. Get Full Table Significantly mutated genes (COSMIC territory only). To access the database please go to: COSMIC. Number of significant genes found: 11. Number of genes displayed: 10
| rank | gene | description | n | cos | n_cos | N_cos | cos_ev | p | q |
|---|---|---|---|---|---|---|---|---|---|
| 1 | TP53 | tumor protein p53 | 147 | 356 | 144 | 63368 | 25865 | 0 | 0 |
| 2 | PIK3CA | phosphoinositide-3-kinase, catalytic, alpha polypeptide | 29 | 220 | 24 | 39160 | 9572 | 0 | 0 |
| 3 | CDKN2A | cyclin-dependent kinase inhibitor 2A (melanoma, p16, inhibits CDK4) | 26 | 332 | 25 | 59096 | 559 | 0 | 0 |
| 4 | PTEN | phosphatase and tensin homolog (mutated in multiple advanced cancers 1) | 16 | 767 | 16 | 136526 | 579 | 0 | 0 |
| 5 | HRAS | v-Ha-ras Harvey rat sarcoma viral oncogene homolog | 5 | 19 | 5 | 3382 | 1133 | 2.4e-10 | 2.2e-07 |
| 6 | FBXW7 | F-box and WD repeat domain containing 7 | 11 | 91 | 6 | 16198 | 220 | 1.4e-08 | 1e-05 |
| 7 | RB1 | retinoblastoma 1 (including osteosarcoma) | 12 | 267 | 7 | 47526 | 17 | 4.2e-07 | 0.00027 |
| 8 | HEPACAM2 | HEPACAM family member 2 | 4 | 1 | 2 | 178 | 2 | 1.3e-06 | 0.00076 |
| 9 | NF1 | neurofibromin 1 (neurofibromatosis, von Recklinghausen disease, Watson disease) | 22 | 285 | 6 | 50730 | 21 | 9.8e-06 | 0.0049 |
| 10 | BRAF | v-raf murine sarcoma viral oncogene homolog B1 | 8 | 89 | 4 | 15842 | 77 | 0.000017 | 0.0077 |
Note:
n - number of (nonsilent) mutations in this gene across the individual set.
cos = number of unique mutated sites in this gene in COSMIC
n_cos = overlap between n and cos.
N_cos = number of individuals times cos.
cos_ev = total evidence: number of reports in COSMIC for mutations seen in this gene.
p = p-value for seeing the observed amount of overlap in this gene)
q = q-value, False Discovery Rate (Benjamini-Hochberg procedure)
Table 5. Get Full Table Genes with Clustered Mutations
| num | gene | desc | n | mindist | nmuts0 | nmuts3 | nmuts12 | npairs0 | npairs3 | npairs12 |
|---|---|---|---|---|---|---|---|---|---|---|
| 11890 | TP53 | tumor protein p53 | 147 | 0 | 115 | 344 | 950 | 115 | 344 | 950 |
| 8725 | PIK3CA | phosphoinositide-3-kinase, catalytic, alpha polypeptide | 29 | 0 | 50 | 93 | 112 | 50 | 93 | 112 |
| 7520 | NFE2L2 | nuclear factor (erythroid-derived 2)-like 2 | 28 | 0 | 32 | 112 | 189 | 32 | 112 | 189 |
| 5008 | HCN1 | hyperpolarization activated cyclic nucleotide-gated potassium channel 1 | 36 | 0 | 9 | 14 | 19 | 9 | 14 | 19 |
| 12151 | TTN | titin | 333 | 0 | 6 | 14 | 40 | 6 | 14 | 40 |
| 10005 | RYR2 | ryanodine receptor 2 (cardiac) | 120 | 0 | 5 | 12 | 38 | 5 | 12 | 38 |
| 2802 | CSMD3 | CUB and Sushi multiple domains 3 | 120 | 0 | 4 | 16 | 41 | 4 | 16 | 41 |
| 3897 | FAM135B | family with sequence similarity 135, member B | 49 | 0 | 4 | 9 | 19 | 4 | 9 | 19 |
| 9653 | REG1B | regenerating islet-derived 1 beta (pancreatic stone protein, pancreatic thread protein) | 13 | 0 | 4 | 7 | 15 | 4 | 7 | 15 |
| 5033 | HEATR7B2 | HEAT repeat family member 7B2 | 32 | 0 | 4 | 6 | 14 | 4 | 6 | 14 |
Note:
n - number of mutations in this gene in the individual set.
mindist - distance (in aa) between closest pair of mutations in this gene
npairs3 - how many pairs of mutations are within 3 aa of each other.
npairs12 - how many pairs of mutations are within 12 aa of each other.
Table 6. Get Full Table A Ranked List of Significantly Mutated Genesets. (Source: MSigDB GSEA Cannonical Pathway Set).Number of significant genesets found: 17. Number of genesets displayed: 10
| rank | geneset | description | genes | N_genes | mut_tally | N | n | npat | nsite | nsil | n1 | n2 | n3 | n4 | n5 | n6 | p_ns_s | p | q |
|---|---|---|---|---|---|---|---|---|---|---|---|---|---|---|---|---|---|---|---|
| 1 | P53HYPOXIAPATHWAY | Hypoxia induces p53 accumulation and consequent apoptosis with p53-mediated cell cycle arrest, which is present under conditions of DNA damage. | ABCB1, AKT1, ATM, BAX, CDKN1A, CPB2, CSNK1A1, CSNK1D, FHL2, GADD45A, HIC1, HIF1A, HSPA1A, HSPCA, IGFBP3, MAPK8, MDM2, NFKBIB, NQO1, TP53 | 19 | ABCB1(18), AKT1(1), ATM(8), BAX(1), CDKN1A(2), CPB2(3), CSNK1A1(2), CSNK1D(2), FHL2(1), GADD45A(1), HIF1A(1), IGFBP3(2), MAPK8(3), MDM2(2), NFKBIB(1), TP53(147) | 5514084 | 195 | 151 | 146 | 10 | 27 | 58 | 18 | 40 | 50 | 2 | 2.8e-10 | 1.2e-15 | 2.2e-13 |
| 2 | G1PATHWAY | CDK4/6-cyclin D and CDK2-cyclin E phosphorylate Rb, which allows the transcription of genes needed for the G1/S cell cycle transition. | ABL1, ATM, ATR, CCNA1, CCND1, CCNE1, CDC2, CDC25A, CDK2, CDK4, CDK6, CDKN1A, CDKN1B, CDKN2A, CDKN2B, DHFR, E2F1, GSK3B, HDAC1, MADH3, MADH4, RB1, SKP2, TFDP1, TGFB1, TGFB2, TGFB3, TP53 | 25 | ABL1(3), ATM(8), ATR(13), CCNA1(1), CCND1(1), CCNE1(3), CDKN1A(2), CDKN2A(26), CDKN2B(1), E2F1(2), HDAC1(2), RB1(12), SKP2(2), TFDP1(3), TGFB1(1), TGFB2(3), TP53(147) | 7994705 | 230 | 156 | 178 | 17 | 29 | 69 | 22 | 40 | 70 | 0 | 2.6e-09 | 1.6e-15 | 2.2e-13 |
| 3 | TIDPATHWAY | On ligand binding, interferon gamma receptors stimulate JAK2 kinase to phosphorylate STAT transcription factors, which promote expression of interferon responsive genes. | DNAJA3, HSPA1A, IFNG, IFNGR1, IFNGR2, IKBKB, JAK2, LIN7A, NFKB1, NFKBIA, RB1, RELA, TIP-1, TNF, TNFRSF1A, TNFRSF1B, TP53, USH1C, WT1 | 18 | IFNG(1), IFNGR1(4), IFNGR2(1), IKBKB(2), JAK2(4), LIN7A(1), NFKB1(2), RB1(12), RELA(3), TNF(1), TNFRSF1A(2), TNFRSF1B(1), TP53(147), USH1C(7), WT1(4) | 4825619 | 192 | 144 | 143 | 16 | 19 | 51 | 21 | 43 | 58 | 0 | 1.1e-07 | 1.8e-15 | 2.2e-13 |
| 4 | RBPATHWAY | The ATM protein kinase recognizes DNA damage and blocks cell cycle progression by phosphorylating chk1 and p53, which normally inhibits Rb to allow G1/S transitions. | ATM, CDC2, CDC25A, CDC25B, CDC25C, CDK2, CDK4, CHEK1, MYT1, RB1, TP53, WEE1, YWHAH | 12 | ATM(8), CDC25B(2), CDC25C(1), CHEK1(5), MYT1(4), RB1(12), TP53(147), WEE1(4) | 4677103 | 183 | 146 | 134 | 10 | 18 | 53 | 19 | 36 | 57 | 0 | 9.3e-09 | 2e-15 | 2.2e-13 |
| 5 | SA_G1_AND_S_PHASES | Cdk2, 4, and 6 bind cyclin D in G1, while cdk2/cyclin E promotes the G1/S transition. | ARF1, ARF3, CCND1, CDK2, CDK4, CDKN1A, CDKN1B, CDKN2A, CFL1, E2F1, E2F2, MDM2, NXT1, PRB1, TP53 | 15 | ARF1(1), CCND1(1), CDKN1A(2), CDKN2A(26), CFL1(2), E2F1(2), MDM2(2), NXT1(1), PRB1(5), TP53(147) | 2143952 | 189 | 149 | 137 | 12 | 18 | 56 | 19 | 37 | 59 | 0 | 2.5e-10 | 2.4e-15 | 2.2e-13 |
| 6 | PLK3PATHWAY | Active Plk3 phosphorylates CDC25c, blocking the G2/M transition, and phosphorylates p53 to induce apoptosis. | ATM, ATR, CDC25C, CHEK1, CHEK2, CNK, TP53, YWHAH | 7 | ATM(8), ATR(13), CDC25C(1), CHEK1(5), CHEK2(3), TP53(147) | 4260894 | 177 | 146 | 128 | 10 | 18 | 52 | 20 | 37 | 50 | 0 | 2.2e-07 | 2.4e-15 | 2.2e-13 |
| 7 | TERTPATHWAY | hTERC, the RNA subunit of telomerase, and hTERT, the catalytic protein subunit, are required for telomerase activity and are overexpressed in many cancers. | HDAC1, MAX, MYC, SP1, SP3, TP53, WT1, ZNF42 | 7 | HDAC1(2), MYC(1), SP1(2), SP3(1), TP53(147), WT1(4) | 1863398 | 157 | 146 | 108 | 12 | 10 | 45 | 19 | 36 | 47 | 0 | 8.6e-07 | 2.6e-15 | 2.2e-13 |
| 8 | RNAPATHWAY | dsRNA-activated protein kinase phosphorylates elF2a, which generally inhibits translation, and activates NF-kB to provoke inflammation. | CHUK, DNAJC3, EIF2S1, EIF2S2, MAP3K14, NFKB1, NFKBIA, PRKR, RELA, TP53 | 9 | CHUK(2), EIF2S2(1), MAP3K14(1), NFKB1(2), RELA(3), TP53(147) | 2611540 | 156 | 141 | 107 | 10 | 11 | 43 | 18 | 34 | 50 | 0 | 1.7e-07 | 3.3e-15 | 2.4e-13 |
| 9 | PMLPATHWAY | Ring-shaped PML nuclear bodies regulate transcription and are required co-activators in p53- and DAXX-mediated apoptosis. | CREBBP, DAXX, HRAS, PAX3, PML, PRAM-1, RARA, RB1, SIRT1, SP100, TNF, TNFRSF1A, TNFRSF1B, TNFRSF6, TNFSF6, TP53, UBL1 | 13 | CREBBP(17), DAXX(3), HRAS(5), PAX3(4), RARA(1), RB1(12), SIRT1(1), SP100(3), TNF(1), TNFRSF1A(2), TNFRSF1B(1), TP53(147) | 5020302 | 197 | 147 | 147 | 17 | 17 | 59 | 21 | 42 | 58 | 0 | 7.7e-08 | 3.4e-15 | 2.4e-13 |
| 10 | TELPATHWAY | Telomerase is a ribonucleotide protein that adds telomeric repeats to the 3' ends of chromosomes. | AKT1, BCL2, EGFR, G22P1, HSPCA, IGF1R, KRAS2, MYC, POLR2A, PPP2CA, PRKCA, RB1, TEP1, TERF1, TERT, TNKS, TP53, XRCC5 | 15 | AKT1(1), EGFR(7), IGF1R(1), MYC(1), POLR2A(2), PRKCA(5), RB1(12), TEP1(8), TERF1(3), TERT(3), TNKS(7), TP53(147), XRCC5(2) | 7492174 | 199 | 149 | 149 | 17 | 24 | 56 | 18 | 42 | 59 | 0 | 1.4e-08 | 4e-15 | 2.5e-13 |
Table 7. Get Full Table A Ranked List of Significantly Mutated Genesets (Excluding Significantly Mutated Genes). Number of significant genesets found: 0. Number of genesets displayed: 10
| rank | geneset | description | genes | N_genes | mut_tally | N | n | npat | nsite | nsil | n1 | n2 | n3 | n4 | n5 | n6 | p_ns_s | p | q |
|---|---|---|---|---|---|---|---|---|---|---|---|---|---|---|---|---|---|---|---|
| 1 | HSA00627_1,4_DICHLOROBENZENE_DEGRADATION | Genes involved in 1,4-dichlorobenzene degradation | CMBL | 1 | CMBL(3) | 134908 | 3 | 3 | 3 | 1 | 0 | 1 | 0 | 2 | 0 | 0 | 0.81 | 0.04 | 1 |
| 2 | HSA00902_MONOTERPENOID_BIOSYNTHESIS | Genes involved in monoterpenoid biosynthesis | CYP2C19, CYP2C9 | 2 | CYP2C19(9), CYP2C9(3) | 536360 | 12 | 10 | 12 | 3 | 5 | 4 | 0 | 2 | 1 | 0 | 0.48 | 0.099 | 1 |
| 3 | SA_G2_AND_M_PHASES | Cdc25 activates the cdc2/cyclin B complex to induce the G2/M transition. | CDC2, CDC25A, CDC25B, CDK7, CDKN1A, CHEK1, NEK1, WEE1 | 7 | CDC25B(2), CDK7(1), CDKN1A(2), CHEK1(5), NEK1(3), WEE1(4) | 1849805 | 17 | 17 | 17 | 1 | 7 | 5 | 1 | 3 | 1 | 0 | 0.1 | 0.24 | 1 |
| 4 | HSA00750_VITAMIN_B6_METABOLISM | Genes involved in vitamin B6 metabolism | AOX1, PDXK, PDXP, PNPO, PSAT1 | 5 | AOX1(13), PDXP(1), PSAT1(3) | 1279971 | 17 | 16 | 17 | 2 | 6 | 5 | 0 | 5 | 1 | 0 | 0.13 | 0.28 | 1 |
| 5 | HSA00472_D_ARGININE_AND_D_ORNITHINE_METABOLISM | Genes involved in D-arginine and D-ornithine metabolism | DAO | 1 | DAO(2) | 191569 | 2 | 2 | 2 | 0 | 0 | 1 | 0 | 0 | 1 | 0 | 0.5 | 0.36 | 1 |
| 6 | HSA00550_PEPTIDOGLYCAN_BIOSYNTHESIS | Genes involved in peptidoglycan biosynthesis | GLUL, PGLYRP2 | 2 | GLUL(4), PGLYRP2(2) | 477868 | 6 | 5 | 6 | 0 | 1 | 4 | 1 | 0 | 0 | 0 | 0.15 | 0.37 | 1 |
| 7 | FBW7PATHWAY | Cyclin E interacts with cell cycle checkpoint kinase cdk2 to allow transcription of genes required for S phase, including transcription of additional cyclin E. | CCNE1, CDC34, CDK2, CUL1, E2F1, FBXW7, RB1, SKP1A, TFDP1 | 7 | CCNE1(3), CUL1(4), E2F1(2), FBXW7(11), TFDP1(3) | 1728213 | 23 | 23 | 21 | 4 | 6 | 8 | 3 | 1 | 5 | 0 | 0.26 | 0.43 | 1 |
| 8 | P27PATHWAY | p27 blocks the G1/S transition by inhibiting the checkpoint kinase cdk2/cyclin E and is inhibited by cdk2-mediated ubiquitination. | CCNE1, CDK2, CDKN1B, CKS1B, CUL1, E2F1, NEDD8, RB1, RBX1, SKP1A, SKP2, TFDP1, UBE2M | 11 | CCNE1(3), CKS1B(1), CUL1(4), E2F1(2), RBX1(1), SKP2(2), TFDP1(3), UBE2M(1) | 1813849 | 17 | 16 | 17 | 1 | 5 | 8 | 0 | 2 | 2 | 0 | 0.05 | 0.46 | 1 |
| 9 | HSA00780_BIOTIN_METABOLISM | Genes involved in biotin metabolism | BTD, HLCS, SPCS1, SPCS3 | 4 | BTD(2), HLCS(5), SPCS1(1), SPCS3(2) | 816418 | 10 | 9 | 10 | 2 | 2 | 2 | 2 | 0 | 4 | 0 | 0.4 | 0.49 | 1 |
| 10 | HBXPATHWAY | Hbx is a hepatitis B protein that activates a number of transcription factors, possibly by inducing calcium release from the mitochondrion to the cytoplasm. | CREB1, GRB2, HBXIP, HRAS, PTK2B, SHC1, SOS1, SRC | 8 | CREB1(1), HBXIP(1), HRAS(5), SHC1(2), SOS1(11) | 2332935 | 20 | 19 | 19 | 1 | 3 | 9 | 2 | 4 | 2 | 0 | 0.029 | 0.52 | 1 |
In brief, we tabulate the number of mutations and the number of covered bases for each gene. The counts are broken down by mutation context category: four context categories that are discovered by MutSig, and one for indel and 'null' mutations, which include indels, nonsense mutations, splice-site mutations, and non-stop (read-through) mutations. For each gene, we calculate the probability of seeing the observed constellation of mutations, i.e. the product P1 x P2 x ... x Pm, or a more extreme one, given the background mutation rates calculated across the dataset. [1]
This is an experimental feature. The full results of the analysis summarized in this report can be downloaded from the TCGA Data Coordination Center.