This pipeline uses various statistical tests to identify genes whose promoter methylation levels correlated to selected clinical features.
Testing the association between 14047 genes and 7 clinical features across 571 samples, statistically thresholded by Q value < 0.05, 5 clinical features related to at least one genes.
-
3 genes correlated to 'Time to Death'.
-
THEM4 , AHCYL1 , BRD1
-
193 genes correlated to 'AGE'.
-
PCDHGA1__4 , PCDHGA10__3 , PCDHGA2__4 , PCDHGA3__4 , PCDHGA4__4 , ...
-
59 genes correlated to 'PRIMARY.SITE.OF.DISEASE'.
-
ZMYM5 , ZCCHC11 , CCNF , FOXN2 , SUV39H2 , ...
-
1327 genes correlated to 'RADIATIONS.RADIATION.REGIMENINDICATION'.
-
NID2 , ALDH6A1 , LIN52 , SLC25A17 , HSD17B14 , ...
-
1 gene correlated to 'COMPLETENESS.OF.RESECTION'.
-
ADAD2
-
No genes correlated to 'KARNOFSKY.PERFORMANCE.SCORE', and 'TUMOR.STAGE'.
Complete statistical result table is provided in Supplement Table 1
Table 1. Get Full Table This table shows the clinical features, statistical methods used, and the number of genes that are significantly associated with each clinical feature at Q value < 0.05.
| Clinical feature | Statistical test | Significant genes | Associated with | Associated with | ||
|---|---|---|---|---|---|---|
| Time to Death | Cox regression test | N=3 | shorter survival | N=2 | longer survival | N=1 |
| AGE | Spearman correlation test | N=193 | older | N=71 | younger | N=122 |
| PRIMARY SITE OF DISEASE | ANOVA test | N=59 | ||||
| KARNOFSKY PERFORMANCE SCORE | Spearman correlation test | N=0 | ||||
| TUMOR STAGE | Spearman correlation test | N=0 | ||||
| RADIATIONS RADIATION REGIMENINDICATION | t test | N=1327 | yes | N=1256 | no | N=71 |
| COMPLETENESS OF RESECTION | ANOVA test | N=1 |
Table S1. Basic characteristics of clinical feature: 'Time to Death'
| Time to Death | Duration (Months) | 0.3-180.2 (median=28.2) |
| censored | N = 266 | |
| death | N = 289 | |
| Significant markers | N = 3 | |
| associated with shorter survival | 2 | |
| associated with longer survival | 1 |
Table S2. Get Full Table List of 3 genes significantly associated with 'Time to Death' by Cox regression test
| HazardRatio | Wald_P | Q | C_index | |
|---|---|---|---|---|
| THEM4 | 65001 | 8.996e-07 | 0.013 | 0.537 |
| AHCYL1 | 46001 | 1.754e-06 | 0.025 | 0.521 |
| BRD1 | 0 | 2.517e-06 | 0.035 | 0.431 |
Figure S1. Get High-res Image As an example, this figure shows the association of THEM4 to 'Time to Death'. four curves present the cumulative survival rates of 4 quartile subsets of patients. P value = 9e-07 with univariate Cox regression analysis using continuous log-2 expression values.
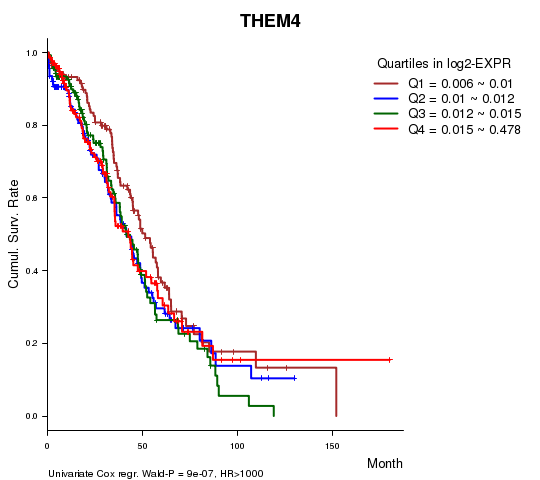
Table S3. Basic characteristics of clinical feature: 'AGE'
| AGE | Mean (SD) | 59.73 (12) |
| Significant markers | N = 193 | |
| pos. correlated | 71 | |
| neg. correlated | 122 |
Table S4. Get Full Table List of top 10 genes significantly correlated to 'AGE' by Spearman correlation test
| SpearmanCorr | corrP | Q | |
|---|---|---|---|
| PCDHGA1__4 | 0.3011 | 5.418e-13 | 7.61e-09 |
| PCDHGA10__3 | 0.3011 | 5.418e-13 | 7.61e-09 |
| PCDHGA2__4 | 0.3011 | 5.418e-13 | 7.61e-09 |
| PCDHGA3__4 | 0.3011 | 5.418e-13 | 7.61e-09 |
| PCDHGA4__4 | 0.3011 | 5.418e-13 | 7.61e-09 |
| PCDHGA5__4 | 0.3011 | 5.418e-13 | 7.61e-09 |
| PCDHGA6__4 | 0.3011 | 5.418e-13 | 7.61e-09 |
| PCDHGA7__4 | 0.3011 | 5.418e-13 | 7.61e-09 |
| PCDHGA8__3 | 0.3011 | 5.418e-13 | 7.61e-09 |
| PCDHGA9__3 | 0.3011 | 5.418e-13 | 7.61e-09 |
Figure S2. Get High-res Image As an example, this figure shows the association of PCDHGA1__4 to 'AGE'. P value = 5.42e-13 with Spearman correlation analysis. The straight line presents the best linear regression.
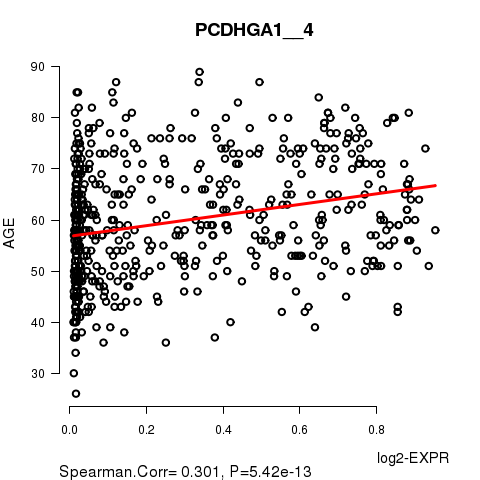
Table S5. Basic characteristics of clinical feature: 'PRIMARY.SITE.OF.DISEASE'
| PRIMARY.SITE.OF.DISEASE | Labels | N |
| OMENTUM | 2 | |
| OVARY | 557 | |
| PERITONEUM OVARY | 2 | |
| Significant markers | N = 59 |
Table S6. Get Full Table List of top 10 genes differentially expressed by 'PRIMARY.SITE.OF.DISEASE'
| ANOVA_P | Q | |
|---|---|---|
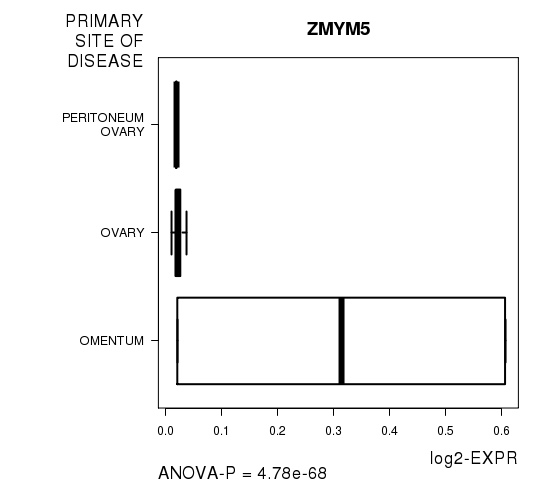
| ZMYM5 | 4.781e-68 | 6.72e-64 |
| ZCCHC11 | 1.97e-53 | 2.77e-49 |
| CCNF | 1.57e-47 | 2.21e-43 |
| FOXN2 | 3.198e-44 | 4.49e-40 |
| SUV39H2 | 2.957e-28 | 4.15e-24 |
| RANBP1 | 7.39e-27 | 1.04e-22 |
| TRMT2A | 7.39e-27 | 1.04e-22 |
| DBN1 | 7.661e-26 | 1.08e-21 |
| IRS2 | 1.668e-22 | 2.34e-18 |
| INHA | 4.149e-21 | 5.82e-17 |
Figure S3. Get High-res Image As an example, this figure shows the association of ZMYM5 to 'PRIMARY.SITE.OF.DISEASE'. P value = 4.78e-68 with ANOVA analysis.
No gene related to 'KARNOFSKY.PERFORMANCE.SCORE'.
Table S7. Basic characteristics of clinical feature: 'KARNOFSKY.PERFORMANCE.SCORE'
| KARNOFSKY.PERFORMANCE.SCORE | Mean (SD) | 75.64 (13) |
| Score | N | |
| 40 | 2 | |
| 60 | 20 | |
| 80 | 49 | |
| 100 | 7 | |
| Significant markers | N = 0 |
Table S8. Basic characteristics of clinical feature: 'TUMOR.STAGE'
| TUMOR.STAGE | Mean (SD) | 3.19 (0.46) |
| N | ||
| Stage 1 | 1 | |
| Stage 2 | 2 | |
| Stage 3 | 131 | |
| Stage 4 | 36 | |
| Significant markers | N = 0 |
1327 genes related to 'RADIATIONS.RADIATION.REGIMENINDICATION'.
Table S9. Basic characteristics of clinical feature: 'RADIATIONS.RADIATION.REGIMENINDICATION'
| RADIATIONS.RADIATION.REGIMENINDICATION | Labels | N |
| NO | 3 | |
| YES | 568 | |
| Significant markers | N = 1327 | |
| Higher in YES | 1256 | |
| Higher in NO | 71 |
Table S10. Get Full Table List of top 10 genes differentially expressed by 'RADIATIONS.RADIATION.REGIMENINDICATION'
| T(pos if higher in 'YES') | ttestP | Q | AUC | |
|---|---|---|---|---|
| NID2 | 27.55 | 1.142e-106 | 1.6e-102 | 0.9683 |
| ALDH6A1 | 20.77 | 1.124e-71 | 1.58e-67 | 0.9718 |
| LIN52 | 20.77 | 1.124e-71 | 1.58e-67 | 0.9718 |
| SLC25A17 | 20.86 | 8.082e-68 | 1.13e-63 | 0.8573 |
| HSD17B14 | 22.19 | 2.305e-67 | 3.24e-63 | 0.8609 |
| PLEKHA4__1 | 22.19 | 2.305e-67 | 3.24e-63 | 0.8609 |
| LYPD5 | 19.64 | 3.194e-65 | 4.48e-61 | 0.7259 |
| PTPRN | 19.69 | 1.63e-64 | 2.29e-60 | 0.8955 |
| THY1 | 20.25 | 3.217e-64 | 4.52e-60 | 0.8803 |
| ACY1 | -18.92 | 2.949e-62 | 4.14e-58 | 0.7042 |
Figure S4. Get High-res Image As an example, this figure shows the association of NID2 to 'RADIATIONS.RADIATION.REGIMENINDICATION'. P value = 1.14e-106 with T-test analysis.
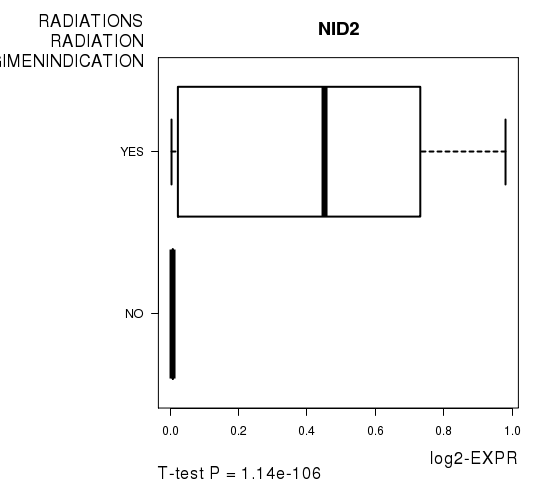
Table S11. Basic characteristics of clinical feature: 'COMPLETENESS.OF.RESECTION'
| COMPLETENESS.OF.RESECTION | Labels | N |
| R0 | 14 | |
| R1 | 26 | |
| R2 | 2 | |
| Significant markers | N = 1 |
Table S12. Get Full Table List of one gene differentially expressed by 'COMPLETENESS.OF.RESECTION'
| ANOVA_P | Q | |
|---|---|---|
| ADAD2 | 2.294e-09 | 3.22e-05 |
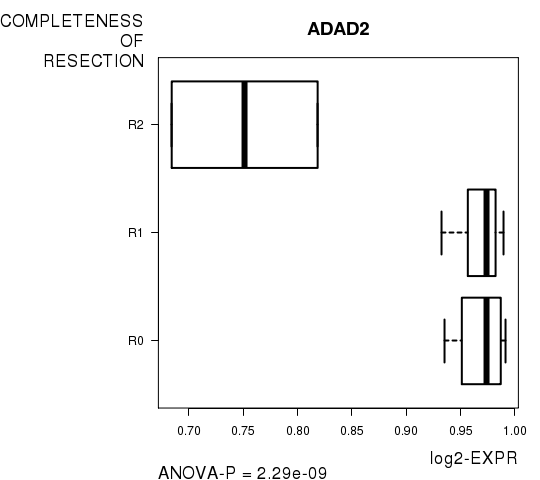
Figure S5. Get High-res Image As an example, this figure shows the association of ADAD2 to 'COMPLETENESS.OF.RESECTION'. P value = 2.29e-09 with ANOVA analysis.
-
Expresson data file = OV-TP.meth.by_min_expr_corr.data.txt
-
Clinical data file = OV-TP.clin.merged.picked.txt
-
Number of patients = 571
-
Number of genes = 14047
-
Number of clinical features = 7
For survival clinical features, Wald's test in univariate Cox regression analysis with proportional hazards model (Andersen and Gill 1982) was used to estimate the P values using the 'coxph' function in R. Kaplan-Meier survival curves were plot using the four quartile subgroups of patients based on expression levels
For continuous numerical clinical features, Spearman's rank correlation coefficients (Spearman 1904) and two-tailed P values were estimated using 'cor.test' function in R
For multi-class clinical features (ordinal or nominal), one-way analysis of variance (Howell 2002) was applied to compare the log2-expression levels between different clinical classes using 'anova' function in R
For two-class clinical features, two-tailed Student's t test with unequal variance (Lehmann and Romano 2005) was applied to compare the log2-expression levels between the two clinical classes using 't.test' function in R
For multiple hypothesis correction, Q value is the False Discovery Rate (FDR) analogue of the P value (Benjamini and Hochberg 1995), defined as the minimum FDR at which the test may be called significant. We used the 'Benjamini and Hochberg' method of 'p.adjust' function in R to convert P values into Q values.
This is an experimental feature. The full results of the analysis summarized in this report can be downloaded from the TCGA Data Coordination Center.