This pipeline uses various statistical tests to identify miRs whose expression levels correlated to selected clinical features.
Testing the association between 415 genes and 6 clinical features across 453 samples, statistically thresholded by Q value < 0.05, 3 clinical features related to at least one genes.
-
3 genes correlated to 'AGE'.
-
HSA-MIR-1269 , HSA-MIR-30D , HSA-MIR-767
-
1 gene correlated to 'TUMOR.STAGE'.
-
HSA-MIR-145
-
3 genes correlated to 'RADIATIONS.RADIATION.REGIMENINDICATION'.
-
HSA-MIR-34A , HSA-MIR-501 , HSA-MIR-500
-
No genes correlated to 'Time to Death', 'PRIMARY.SITE.OF.DISEASE', and 'KARNOFSKY.PERFORMANCE.SCORE'.
Complete statistical result table is provided in Supplement Table 1
Table 1. Get Full Table This table shows the clinical features, statistical methods used, and the number of genes that are significantly associated with each clinical feature at Q value < 0.05.
| Clinical feature | Statistical test | Significant genes | Associated with | Associated with | ||
|---|---|---|---|---|---|---|
| Time to Death | Cox regression test | N=0 | ||||
| AGE | Spearman correlation test | N=3 | older | N=2 | younger | N=1 |
| PRIMARY SITE OF DISEASE | ANOVA test | N=0 | ||||
| KARNOFSKY PERFORMANCE SCORE | Spearman correlation test | N=0 | ||||
| TUMOR STAGE | Spearman correlation test | N=1 | higher stage | N=1 | lower stage | N=0 |
| RADIATIONS RADIATION REGIMENINDICATION | t test | N=3 | yes | N=1 | no | N=2 |
Table S1. Basic characteristics of clinical feature: 'Time to Death'
| Time to Death | Duration (Months) | 0.3-180.2 (median=30.1) |
| censored | N = 198 | |
| death | N = 252 | |
| Significant markers | N = 0 |
Table S2. Basic characteristics of clinical feature: 'AGE'
| AGE | Mean (SD) | 59.76 (12) |
| Significant markers | N = 3 | |
| pos. correlated | 2 | |
| neg. correlated | 1 |
Table S3. Get Full Table List of 3 genes significantly correlated to 'AGE' by Spearman correlation test
| SpearmanCorr | corrP | Q | |
|---|---|---|---|
| HSA-MIR-1269 | 0.3265 | 1.639e-12 | 6.8e-10 |
| HSA-MIR-30D | -0.2601 | 2.587e-08 | 1.07e-05 |
| HSA-MIR-767 | 0.1997 | 5.641e-05 | 0.0233 |
Figure S1. Get High-res Image As an example, this figure shows the association of HSA-MIR-1269 to 'AGE'. P value = 1.64e-12 with Spearman correlation analysis. The straight line presents the best linear regression.
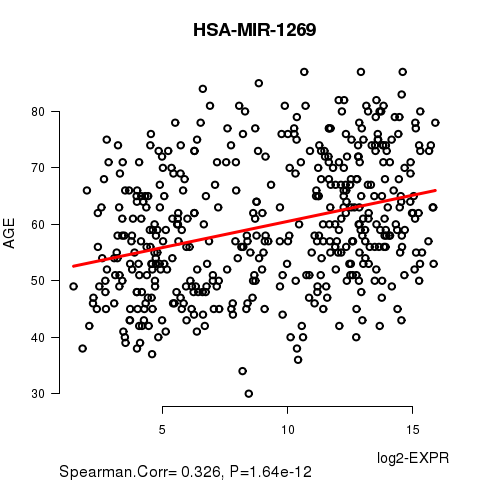
Table S4. Basic characteristics of clinical feature: 'PRIMARY.SITE.OF.DISEASE'
| PRIMARY.SITE.OF.DISEASE | Labels | N |
| OMENTUM | 2 | |
| OVARY | 450 | |
| PERITONEUM OVARY | 1 | |
| Significant markers | N = 0 |
No gene related to 'KARNOFSKY.PERFORMANCE.SCORE'.
Table S5. Basic characteristics of clinical feature: 'KARNOFSKY.PERFORMANCE.SCORE'
| KARNOFSKY.PERFORMANCE.SCORE | Mean (SD) | 75.31 (13) |
| Score | N | |
| 40 | 2 | |
| 60 | 17 | |
| 80 | 39 | |
| 100 | 6 | |
| Significant markers | N = 0 |
Table S6. Basic characteristics of clinical feature: 'TUMOR.STAGE'
| TUMOR.STAGE | Mean (SD) | 3.2 (0.43) |
| N | ||
| Stage 2 | 2 | |
| Stage 3 | 115 | |
| Stage 4 | 32 | |
| Significant markers | N = 1 | |
| pos. correlated | 1 | |
| neg. correlated | 0 |
Table S7. Get Full Table List of one gene significantly correlated to 'TUMOR.STAGE' by Spearman correlation test
| SpearmanCorr | corrP | Q | |
|---|---|---|---|
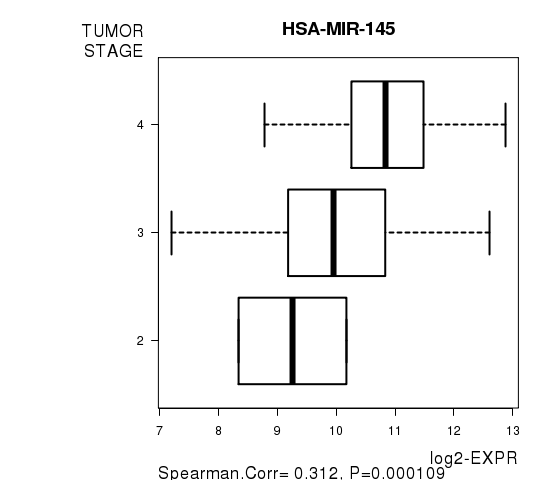
| HSA-MIR-145 | 0.3118 | 0.0001086 | 0.045 |
Figure S2. Get High-res Image As an example, this figure shows the association of HSA-MIR-145 to 'TUMOR.STAGE'. P value = 0.000109 with Spearman correlation analysis.
3 genes related to 'RADIATIONS.RADIATION.REGIMENINDICATION'.
Table S8. Basic characteristics of clinical feature: 'RADIATIONS.RADIATION.REGIMENINDICATION'
| RADIATIONS.RADIATION.REGIMENINDICATION | Labels | N |
| NO | 3 | |
| YES | 450 | |
| Significant markers | N = 3 | |
| Higher in YES | 1 | |
| Higher in NO | 2 |
Table S9. Get Full Table List of 3 genes differentially expressed by 'RADIATIONS.RADIATION.REGIMENINDICATION'
| T(pos if higher in 'YES') | ttestP | Q | AUC | |
|---|---|---|---|---|
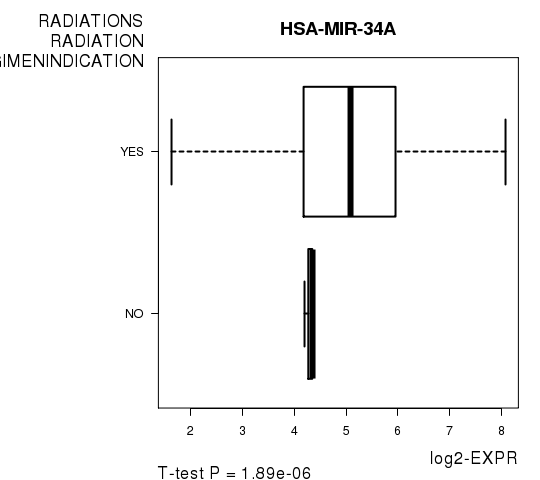
| HSA-MIR-34A | 9.66 | 1.891e-06 | 0.00063 | 0.723 |
| HSA-MIR-501 | -6.95 | 1.914e-06 | 0.000636 | 0.6844 |
| HSA-MIR-500 | -6.29 | 3.313e-06 | 0.0011 | 0.6511 |
Figure S3. Get High-res Image As an example, this figure shows the association of HSA-MIR-34A to 'RADIATIONS.RADIATION.REGIMENINDICATION'. P value = 1.89e-06 with T-test analysis.
-
Expresson data file = OV-TP.miRseq_RPKM_log2.txt
-
Clinical data file = OV-TP.clin.merged.picked.txt
-
Number of patients = 453
-
Number of genes = 415
-
Number of clinical features = 6
For survival clinical features, Wald's test in univariate Cox regression analysis with proportional hazards model (Andersen and Gill 1982) was used to estimate the P values using the 'coxph' function in R. Kaplan-Meier survival curves were plot using the four quartile subgroups of patients based on expression levels
For continuous numerical clinical features, Spearman's rank correlation coefficients (Spearman 1904) and two-tailed P values were estimated using 'cor.test' function in R
For multi-class clinical features (ordinal or nominal), one-way analysis of variance (Howell 2002) was applied to compare the log2-expression levels between different clinical classes using 'anova' function in R
For two-class clinical features, two-tailed Student's t test with unequal variance (Lehmann and Romano 2005) was applied to compare the log2-expression levels between the two clinical classes using 't.test' function in R
For multiple hypothesis correction, Q value is the False Discovery Rate (FDR) analogue of the P value (Benjamini and Hochberg 1995), defined as the minimum FDR at which the test may be called significant. We used the 'Benjamini and Hochberg' method of 'p.adjust' function in R to convert P values into Q values.
This is an experimental feature. The full results of the analysis summarized in this report can be downloaded from the TCGA Data Coordination Center.